STATISTICAL DIGEST REPORT
2016 - 2018
Annual Statistical Digest Report
MINISTRY OF EDUCATION AND TRAINING (MoET), VANUATU
Published by the Policy and Planning Unit, with technical support from UNICEF. Ministry of Education and Training
Table of
Contents
FOREWORD ... 7
ACKNOWLEDGEMENT ... 8
INTRODUCTION ... 9
SUMMARY STATISTICS ... 10
SCHOOLS, ENROLMENT AND TEACHERS, 2016 - 2018 ... 10
ENROLMENT CHANGE ... 11
INCREASING ACCESS AND PARTICIPATION IN EDUCATION ... 11
ACCESS ... 11
PARTICIPATION ... 12
GER and NER in ECCE, Primary and Secondary School, 2016 - 2018 ... 12
Percentage of under and overage students in the system, 2018 ... 12
Out-of-school children in ECCE, 4-5 years old, 2016 - 2018 ... 12
Out-of-school children in Primary School age 6-11 years old ... 12
IMPROVE QUALITY OF EDUCATION FOR ALL STUDENTS IN VANUATU ... 14
Early Childhood Development (ECD) ... 15
Early Childhood Care and Education (ECCE) ... 16
Key results ... 16
IMPROVE QUALITY OF PRIMARY AND SECONDARY EDUCATION ... 17
KEY INDICATORS ... 18
Learning outcomes through the National Assessment Results ... 19
STRENGTHEN EDUCATION MANAGEMENT ... 23
1. ACCESS AND PARTICIPATION IN EDUCATION ... 24
MEASURING ACCESS AND EQUITY... 24
ENROLMENT BY URBAN AND RURAL ... 27
ENROLMENT BY LANGUAGE OF INSTRUCTION ... 28
SCHOOLS BY LANGUAGE OF INSTRUCTION AND SCHOOL TYPE ... 28
ENROLMENT RATES ... 29
SCHOOL LIFE EXPECTANCY ... 30
TOTAL ENROLMENT BY YEAR LEVEL AND BY AGE ... 31
ENROLMENT RATES ... 32
INTERNAL EFFICIENCY INDICATORS ... 33
HIGHER EDUCATION ... 35
VANUATU SCHOLARSHIP AWARDS ... 37
VANUATU RURAL DEVELOPMENT TRAINING CENTERS ASSOCIATION (VRDTCA) ... 38
2. QUALITY OF EDUCATION ... 39
MEASURING QUALITY AND OUTCOMES ... 39
Year 8 and 10 Students Placement after sitting the National exams in 2017 ... 40
VANUATU STANDARDISED TEST OF ACHIEVEMENT (VANSTA) ... 41
VANUATU TEACHING FORCE ... 43
STUDENT TEACHER RATIO (STR) ... 45
TEACHERS CERTIFICATION AND QUALIFICATION ... 46
CURRICULUM RESOURCES ... 47
CLASSROOM ... 47
WATER, SANITATION AND HIGIENE IN SCHOOLS ... 48
3. MANAGEMENT AND PLANNING ... 50
RELEVANT INDICATORS FOR MOET MONITORING AND EVALUATION ... 50
MoET BUDGET AND EXPENDITURE BY PROGRAM COST CENTRES ... 51
DONORS CONTRIBUTIONS TOWARDS THE EDUCATION SECTOR DEVELOPMENT... 52
UNIT COSTS OF EDUCATION ... 52
ANNEX ... 53
Annual School Survey Process ... 53
Data Entry ... 54
Annex 2 ... 54
Annex 3 ... 55
ABBREVIATIONS ... 55
Annex 4 ... 56
GLOSSARY ... 56
Annex 5 ... 57
NUMBER OF SCHOOLS BY TYPE AND EDUCATION AUTHORITIES ... 57
LIST OF TABLES
Table 1: Total number of schools in Vanuatu by School type, 2016 - 2018 10
Table 2: School enrolment trend by sector level, 2016 - 2018 10
Table 3: Total number of teachers/Trainers by school type, 2016 - 2018 10
Table 4: Number of ECCE teachers, mobile ECCE officers and School Improvement Officers who have
benefited from the Parenting Support training in Penama Province, 2018 15
Table 5: Enrolment by education authority, sex and school level, 2016 – 2018 24 Table 6: Enrolment by Education Authority and by Education Level, 2016 - 2018 25 Table 7: Enrolment in Primary 1 to 6 by education authority and province, 2016 - 2018 26 Table 8: Total enrolment in secondary (Year 7+) by education authority and province, 2016 - 2018 27 Table 9: Total Enrolment in Urban and Rural Schools by school type and province, 2016 - 2018 27 Table 10: Total Enrolment by School and language of Instruction, 2016 - 2018 28 Table 11: Number of schools that are officially registered with the MOET by province, 2018 28 Table 12: Number of schools by language that the school is registered in, 2015 - 2018 28
Table 13: Number of schools by Urban and Rural, 2016 - 2018 29
Table 14: Gross Enrolment Rate and Parity Index (GPI) by school type, 2016 - 2018 29 Table 15: Net Enrolment Rate (NER) and Gender Parity Index (GPI) by School Type, 2016 - 2018 30
Table 16: Total Enrolment by Year Level and by Age, 2018 31
Table 17: GER and Gender Parity Index aggregated by province, 2016 - 2018 32
Table 18: NER and Gender Parity Index per province, 2016 - 2018 32
Table 19: Number of trainees in Post School Education and Training, 2016 - 2018 34 Table 20: Number of graduates in Post School Education and Training, 2016 - 2017 34 Table 21: Total number of trainers in Post School Education and Training, 2016 - 2018 35 Table 22: Number of USP Port Vila students by program and gender, 2016 - 2017 35
Table 23: USP Emalus Number of Students by program and gender, 2016 - 2018 35
Table 24: Number of AUF graduates, 2016 - 2017 36
Table 25: Number of AUF students by course, 2016 - 2018 36
Table 26: Number of AUF students by course and by province, 2016 - 2018 37
Table 27: Number of New awardees by sponsors, 2016 - 2018 37
Table 28: Number of On-going studies by sponsors, 2016 - 2018 38
Table 29: Total number of Trainees enrolled in existing Rural Training Centres, 2016 - 2017 38 Table 30: Number of Trainees in Rural Training Centres by Province, 2016 - 2017 38 Table 31: Trend showing the total number of teachers by school type, 2014 - 2018 43 Table 32: Total number of teachers by authority and school type, 2016 - 2018 43 Table 33: Total Number of Teachers by Level of Education and Province, 2015 - 2018 44
Table 34: Students -Teacher Ratio by Education Authorities, 2016 - 2018 45
Table 35: Student-Teacher Ratio by province, 2016 - 2018 46
Table 36: Percentage of Teachers Certified, 2016 - 2018 46
Table 37: Pupil’s Classroom ratio for Primary Schools, 2016 - 2018 47
Table 38: Pupil Toilet Ratio by province for Primary Schools, 2016 - 2018 49
Table 39: 2017 MOET budget and Actual Expenditure by program cost centres 51
Table 40: Unit Cost per student (In VUV) 52
Table 41: Summary table showing the number of schools/institutions throughout the country, 2016 – 2018 54 Table 42: Number of schools by education authority and School type, 2016 - 2018 57
LIST OF FIGURES AND INFOGRAPHICS
Figure 1: Enrolment by Authorities and school type, 2016 - 2018 13
Figure 2: Percentage of male and female students in each school type, 2016 - 2018 14 Figure 3: Nine parenting support intervention workshops for parents or caregivers with 0-5 year old children
16 Figure 4: Total Average mean Score by subject and province, Year 8 English speaking schools, 2017 19 Figure 5: Total Average mean Score by subject and province, Year 8 French speaking schools, 2017 20 Figure 6: Total Average mean score by subject and province, Year 10 English speaking schools, 2017 21 Figure 7: Total Average mean scores by subject and province, Year 10 French Speaking Schools, 2017 22 Figure 8: Total education expenditure as percentage of Gross Domestic Product (GDP), Education Sector,
2018 23
Figure 9: Age Participation Rate, 2018 26
Figure 10: Average number of years of schooling that the Education system in Vanuatu offers, 2018 30
Figure 11: Dropout, Repeater and Promotion Rate in Primary Schools, 2018 33
Figure 12: Dropout, Repeater and Promotion Rate in Secondary Schools, 2018 33
Figure 13: Placement of students passing the Final Year Exams in 2017 40
Figure 14: Percentage of year 13 students place in year 14 francophone in 2018 41
Figure 15: MOET Year 4 and 6 Literacy and Numeracy outcomes, 2017 42
Figure 16: Percentage of available textbooks and teacher guide, 2018 47
Figure 17: Number of classrooms in primary school by building structure and cyclone resistant, 2016 48 Figure 18: Access to Water defined by their source in Primary Schools, 2016 48 Figure 19: Share of MOET Budget as proportion of the Vanuatu Government Budget, 2016 - 2017 50
Figure 20: Share of Budget on MOET's Payroll, 2017 50
Figure 21: Donor Aid to the Ministry of Education and Training in 2017 52
FOREWORD
Vanuatu Ministry of Education and Training (MoET) is
very much
concerned about effective learning and teaching across all level of Education. Since 2015, significant work progress has been made to strengthen school data collection and entry in our online information system called “Open VEMIS”. We acknowledged the support given to MoET to capacity build our staff to be able to collect and analyse the education data to empower the government policies and planning decisions.
I have the honour to introduce to you all the 9th edition of the MoET Annual Statistical Digest, 2016-2018 for Vanuatu. This is the most recent statistical digest in which you could discover a holistic range of education statistics for Early Childhood Development (ECD) right up to Tertiary Education. Over the years, MoET progressed and committed to increase school enrolment across all level, to see the change in the transitioning of teacher certification to Diploma and Degree level at Vanuatu Institute of Teacher Education (VITE and In-Service Teaching programme and to better coordinate support around teaching and learning in schools. In order to maintain the consistency and common understanding on the use of the education statistics, it would be advisable for you to consult the Policy and Planning team should you need any assistance with the data.
Like every other Pacific Island Countries, Ministry of Education and Training in Vanuatu faced unprecedented demand of education data to support the achievement of the Sustainable Development Goal 4 (SDG 4) and
the monitoring of the implementation of the Pacific Regional Education Framework (PacREF).
The PacREF identifies four priority policy areas:
- Ensuring the quality and relevance of what is taught
- Continuous development to support the teaching profession
- Prioritizing student outcomes and wellbeing and
- Learning pathways that empower all Pacific islanders to equally enjoy the benefits of education without barriers.
ACKNOWLEDGEMENT
As the Director General of the MoET, I wish to acknowledge the tremendous efforts and work done by the staffs of the Ministry of Education and Training who have contributed in one way or the other for producing the 9th edition of the Education statistical Digest for Vanuatu.
My genuine appreciation goes to the Policy and Planning Unit for compiling and publishing the 2016-2018 Statistical Digest on time. May I extend the same gratitude to all the school principals and teachers across all schools for their time in sharing with us their school records. This document is published on the Ministry of Education and Training website:
www.moet.gov.vu should you need any recent data from the statistical digest report.
In terms of work coordination, I wish to thank all the Provincial Education Officers for their support, in particular the Open VEMIS team in the six provinces that have been of great help in entering and managing the schools data in Open VEMIS. I would also take this opportunity to acknowledge the contributions of the respective schools Principals for continuously submitting the annual school data either directly in Open VEMIS or hard copy forms.
The team was able to collect data from other data sources as well and I wish to particularly acknowledge the work collaboration between the MoET Finance Team, the National Exam’s Unit and with all the Principals of Post School Education and Training (PSET) institutions in country for the positive collaboration in sharing your data with the Policy and Planning Team for compilation. Last but not least, I am very grateful to our donor partners in country and to the regional and international institutions for their support in capacity building the staff of the Policy and Planning Unit namely UNICEF, MFAT, DFAT, SPC and UIS on use of the Open VEMIS and on Data Analysis. May I join our Minister of Education and Training to invite you all to make good use of the education data published in this digest. Should you need any clarification, do not hesitate to liaise with the Policy and Planning Team for assistance. Here is our contact: +678 22309 or obule@vanuatu.gov.vu;
dreuben@vanuatu.gov.vu.
INTRODUCTION
Ministry of Education and Training (MoET) is moving from a standalone EMIS system to an Open-Sourced Education Management Information System (Open VEMIS) since 2015. As the country as well as the global community refocuses their efforts towards Education 2030, the importance of quality education in Vanuatu is more apparent than ever. The Ministry of Education and Training Open VEMIS system begun to respond to the growing demands for quality data towards quality education and in the area of planning, management and monitoring and evaluation of the education system in Vanuatu.
This document contains relevant education statistics to measure progress towards the three policy goals of the MoET Corporate Plan 2017-2019 “ACCESS, QUALITY AND MANAGEMENT”. As with many such data collections, there may be limitations in terms of missing or complete data in some areas of educations sectors, however MoET through its business plan 2017-2018 continue to strengthen the quality of data in the Open VEMIS system to ensure all education data are captured. This system is able to import data from other sources; as such MoET through the Policy and Planning Division keeps encouraging other divisions such as the Post School Education and Training to start making use of the Open VEMIS.
In terms of the capacity building, most MoET staffs at the Central and Provincial level has received In-house training on how to use the Open VEMIS system. The same training has been rolled out to all the school principals throughout the country in 2017 and 2018.
What major achievements are made? The Open VEMIS has the ability to record individual student and school teachers data and provide statistics reports aggregated by different levels.
WHY EDUCATION MATTERS IN VANUATU
SUMMARY STATISTICS
This section provides a summary of education statistics related to ECCE, Primary and Secondary schools in Vanuatu for three consecutive years 2016-2018.
SCHOOLS, ENROLMENT AND TEACHERS, 2016 - 2018
Table 1: Total number of schools in Vanuatu by School type, 2016 - 2018
Education Sector Level 2016 2017 2018
Early Childhood Education 566 520 838
Primary School 438 436 455
Secondary School 93 93 104
Post School Education and Training 7 7 7
Vanuatu 1,104 1,056 1,404
Source: Open VEMIS, 2018.
Table 2: School enrolment trend by sector level, 2016 - 2018
Year ECCE Primary 1-6 Secondary 7+ Post School Education and Training Total
2016 8,800 44,965 18,408 2,122 74,295
2017 14,921 49,005 19,231 2,291 85,448
2018 15,661 52,789 19,983 2,055 90,488
Source: Open VEMIS, 2018.
Table 3: Total number of Teachers/Trainers by school type, 2016 - 2018
Year ECCE Primary Secondary 7+ Post School Education and
Training
Total
2016 311 1,548 761 174 2,794
2017 1,033 1,780 1,013 187 4,013
2018 1,306 1,908 980 166 4,360
Source: Open VEMIS, 2018.
According to the statistics of the ECCE sector in 2016 as outlined in table 2 and 3 above, number of enrolment and teachers shows big jumped compared to 2017 data. Reasonably this was due to the missing or incomplete data captured in Open VEMIS, taking into consideration that 201 was the period of transition from Old VEMIS to introducing Open VEMIS system. Slowly more schools have been trained and more awareness had been made on the use of Open VEMIS, resulting in the improvement on data captured in Open VEMIS in 2017 and 2018.
teachers by their qualification in the Open VEMIS. It is expected that 100% of these teachers will be recorded in the system by 2019.
In overall, school grant is the major incentive that contributed to the increase of school enrolment across the three education sector. Many other programs may have also contributed in one way or another but the fact that more children are going to school is mainly because parents in the communities are no longer paying for their children tuition fees since 2010.
ENROLMENT CHANGE
The number of students enrolled has shown significant increase in 2018 compared to 2017.
Total Enrolment Indicator Between
School Enrolment in ECCE 4.9% Increase 2017 and 2018
School Enrolment in Primary 7.7% Increase 2017 and 2018 School Enrolment in Secondary 3.9% Increase 2017 and 2018 Total enrolment ECCE – Urban Schools 12.3% Increase 2017 and 2018 Total enrolment ECCE – Rural Schools 3.4% Increase 2017 and 2018 Total Enrolment Primary – Urban Schools 14.3% Increase 2017 and 2018 Total Enrolment Primary – Rural Schools 6.3% Increase 2017 and 2018
Gross Intake Rate in primary Year 1 154% 2018
Source: Open VEMIS, 2018. The number of new entrants in the last year level of primary schools is not available in the Open VEMIS so MoET is not able to calculate the Gross Intake Rate to the last grade of primary (GIRLG) often use as proxy for the Completion Rate.
INCREASING ACCESS AND PARTICIPATION IN EDUCATION
Access: Universal access to education is the ability of all children in Vanuatu to have equal opportunity in education, regardless of their social class, gender, ethnicity background or physical and mental disabilities.
Participation: indicators could quantify pupil numbers relative to the size of the overall population of the respective age group (e.g. Attendance rate, Gross enrolment rate, Net enrolment rate, Gross Intake rate, Net Intake Rate, Adjusted Net Enrolment Rate, School Life expectancy, Out-of-School Children etc.)
Education in Vanuatu is not compulsory but the official entry age as stated in the Early Childhood Care and Education Policy 2017 has stated that the entry age in the ECCE centres in Vanuatu is 4 - 5 years old. According to the Education Act No. 9 of 2014, the entry age in primary year 1 is 6 years old so the calculation approach of the enrolment rates to determine access and participation were based on this respective age group.
ACCESS
Indicator 2016 2017 2018
Total % of student attending in ECCE, Primary and Secondary schools
92%
Percentage of entrants in Primary Year 1 77.3% 88.8% 89.1%
Gross Intake Rate in Primary Year 1 123% 150% 154%
5%
22% 73%
Under Age (<4 years) Overage (> 6 years) Official Age (4-5 years)
45%
47% 48%
42% 43% 42%
2016 2017 2018
GER vs NER in Secondary
GER NER
Transition Rate from Year ECCE to Year 1 102% 79.3%
Transition Rate from Year 6 to Year 7 78.2% 82.8%
Transition Rate from Year 10 to Year 11 64.4% 59.7%
Transition Rate from Year 12 to Year 13 63% 68.5%
Source: Open VEMIS, 2018.
PARTICIPATION
GER and NER in ECCE, Primary and Secondary School, 2016 - 2018
Percentage of under and overage students in the system, 2018
Out-of-school children in ECCE, 4-5 years old, 2016 - 2018
Out-of-school children in Primary School age 6-11 years old
112% 119% 125%
85% 90% 92%
2016 2017 2018
GER vs NER in Primary
GER NER
60%
101% 106%
33%
66% 78%
2016 2017 2018
GER vs NER in ECCE
GER NER
Out-of-school Children (age 6-11 years old), 2016
Out-of-school children (age 6-11 years old), 2017
Out-of-school Children (age 6-11 years old), 2018
2% 14% 84%
Under age (< 6 years) Overage (> 12 years) official Age (6-11 years)
1% 3% 96%
Under Age (< 12 years) Overage (> 19 years) Official Age (12-18)
56%
OOSC 4-5 years old, 2016
21% OOSC 4-5 years old, 2017
13,253 12,531
1,393
1,099 1,484
426 0
4000 8000 12000 16000
2014 2015 2016 2017 2018
Enrolment in Non-Government Schools
ECCE Primary Secondary
The gap between the Gross Enrolment Rate and the Net Enrolment Rate in ECCE and Primary Education is significant meaning that the number of overage students in both levels is still significant and will require a close attention. However, the percent of out-of-school children age 4-5 years old has dropped from 56% in 2016 to 16% in 2018. In Primary schools, the percent of Out-of-school children has reduced from 13% in 2016 compared to 8% in 2018. This demonstrates the effectiveness of the School grant scheme that have been introduced in 2010 for Primary school and later introduced in 2018 for ECCE. This scheme has contributed to the significant increase in access in ECCE and Primary schools throughout the country.
The positive effect of school grant is that more children in Vanuatu are coming back to school and this is a great achievement for the MoET.
Figure 1: Enrolment by Authorities and school type, 2016 - 2018
Source: Open VEMIS, 2018.
In early 2018, MoET begun to address access to ECCE in order to provide a path way for quality access to primary education in year 1. In doing so, the MoET is able to collect data on one of the core indicators for SDG4 target 4.2.2 which is the Participation rate in organized learning (one year before the official primary entry age). The number of enrolled students in government and non-government schools shows a gradual increase on school enrolment between 2016 and 2018. The bottom line for MoET and Vanuatu Government as a whole is to ensure that more children in Vanuatu have to go through ECCE before entering year 1 in primary.
Definition:
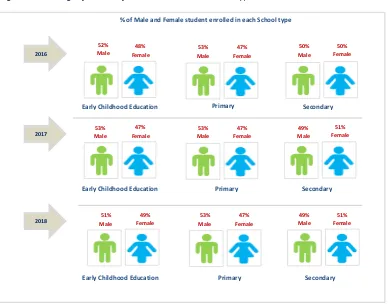
One of the SDG4 targets is by 2030, “Ensure that all girls and boys complete free, equitable and quality primary and secondary education leading to relevant and effective learning outcomes”. Figure 3 below is showing that there is gender parity in male and female participation across the
452
3,130 44,304
51,690
18490 19,557
0 10000 20000 30000 40000 50000 60000
2014 2015 2016 2017 2018
Enrolment in Government Schools
ECCE Primary Secondary
According to the Education Act no.9 of 2014:
A School is a Government Schools if a Provincial Education Board is responsible for the operation.
2016
% of Male and Female student enrolled in each School type
53% Male 47% Female Primary 52% Male 48% Female
Early Childhood Education
50% Male 50% Female Secondary 49% Male 51% Female Secondary 53% Male 47% Female Primary 53% Male 47% Female
Early Childhood Education
49% Male 51% Female Secondary 53% Male 47% Female Primary 51% Male 49% Female
Early Childhood Education
2017
2018
three level of education. The gap between the percentage of enrolled male and female students is fluctuated overtime and is not that large.
Figure 2: Percentage of male and female students in each school type, 2016 - 2018
IMPROVE QUALITY OF EDUCATION FOR ALL STUDENTS IN VANUATU
Quality education is not an easy concept to qualify and it does take time to really understand it. Quality determines how much and how well children in Vanuatu learn and the extent to which the
education system translates it into a range of personal, social and developmental benefits.It is the
teaching and learning process that brings the curriculum to life, they determine what happens through regular assessment and monitoring. Studies have revealed that “quality of education” is the most fundamental component in children’s life in Vanuatu. Quality Learning for instance is not just the concern of the Vanuatu Government or the Ministry of Education and Training, but it requires support from all level; parents, school principals, teachers, the Ministry of Education and Training and from the Vanuatu Government as a whole. At the regional and global level and from support partners, donors, international and national NGOs, much support has been provided to ensure that “education quality” in Vanuatu has a status and that learning outcomes are succeeded across
Early Childhood Development (ECD)
Early Childhood Development is a new program launched this year by the Government of Vanuatu. In terms of advocacy on this initiative, Vanuatu has provided its political support on the ratification of the Early Childhood Development early this year. As a way forward, the Minister of Education and Training with support from his colleague Ministers of Justice and Health has made a presentation on the first 100 days plan to the political leaders at the National Parliament of Vanuatu in June this year. That presentation appears to be revealing and was then displayed on the National Television of Vanuatu as instructed by the Government.
MoET is guided by a Policy on Early Childhood Care and Education (ECCE) 2017 and supported by a five years strategic Development Plan, developed in 2017 to facilitate the strategic implementation of the MoET’s plans. In line with the 100 days plan advocacy program, MoET was also able to
develop and rollout the piloted trainings on the parenting support interventions in Penama Province for caregivers with 0-5 year old children. The rollout turns out to be innovative and mind changing on parents in the communities. The MoET has planned to rollout that same parenting support intervention programs in other provinces starting in 2019 onwards.
ECD aligns very well with the SDG4 target 4.2: “By 2030 ensure that all girls and boys have access to quality Early Childhood Development, care and pre-primary education so that they are ready for primary education”. Ultimately, Vanuatu through the Ministry of Education and Training has started to advocate on the early childhood development and its potentials to the citizens of this country. The following table demonstrates the number of the first participants who took part in the parenting support training in Pentecost and Maewo islands.
Table 4: Number of ECCE teachers, mobile ECCE Officers and School Improvement Officers who have benefited from the Parenting Support training in Penama and Sanma Province, 2018
Island Number of Participants
Participants Training focus
Santo 19 National and provincial ECCE
Coordinators and School Improvement Officers (Torba & Sanma Province)
ECCE Minimum Quality Service Standards
Pentecost (Central)
15 School Improvement Officers and
mobile ECCE teachers (Pentecost and Maewo)
Training of the ECCE MQSS and Improvement Plan Manual
Maewo (Lalavaru)
33 ECCE teachers, ECCE committees and
Primary school principals
Rollout training of ECCE MQSS and ECCE
Improvement Plan
Pentecost (South)
41 ECCE teachers, ECCE committees and
Primary school principals
Rollout training of ECCE MQSS and ECCE
Improvement Plan
Pentecost (Central)
22 ECCE teachers, ECCE committees and
Primary school principals
Rollout training of ECCE MQSS and ECCE
Improvement Plan
Pentecost (Central)
40 ECCE teachers, ECCE committees and
Primary school principals
Rollout training of ECCE MQSS and ECCE
Improvement Plan
Footnote: This training was not conducted in Ambae due to the state of emergency of the Ambae Volcano. All materials developed for the parenting support interventions are available with MoET who is going to roll out the same training in other provinces.
Through the recent parenting support workshops in Pentecost and Maewo, parents and young couples were invited to participate in roll plays as a way forward for them to understand better what kind of family and parenting support works for them. The parenting support program has been developed with high respect to the countries livelihood, cultures and values. The following diagram shows the nine (9) themes of the parenting support program recently developed for Vanuatu. Figure 3: Nine parenting support intervention workshops for parents or caregivers with 0-5 year old children
Footnote: 9 themes of the parenting support workshops.
Early Childhood Care and Education (ECCE)
Ministry of Education and Training has newly developed the Minimum Quality Service Standards for Early Childhood Care and Education. The 23 policy standards for ECCE have been developed in response to the implementation plan of the revised policy for Early Childhood Care and education 2017.
Key results
The number of ECCE has significantly increased by 3.3% in 2018 compared to 2017. This has contributed to the following outcomes:
- 520 ECCE centres have been registered with MOET since 2017
- 851 ECCE teachers out of the total number of teachers have been appointed to received their first salary starting in June 2018
- 63% ECCE teachers are certified to teach in 2018
- 170 ECCE teachers, committees, School Improvement Officers (SIO) and Primary School Principals in Penama Province are trained on the MoET Minimum Quality Service Standards (MQSS) for ECCE.
- Out-of-school children age 4-5 years old has reduced from 56% in 2016 to 16% in 2018. The rollout of the newly developed ECCE MQSS has been rolled out to the other provinces starting in October this year.
Home Safety Support
Children with Disabilities Nurturing
Children's Emergent Literacy Encouraging
Play Nutrition for
Young Children Positive
Discipline Parent-Child
Interaction Hand Washing
IMPROVE QUALITY OF PRIMARY AND SECONDARY EDUCATION
In Vanuatu, School inspectors are responsible for monitoring the quality of education in ECCE, Primary and Secondary schools throughout the country. More and more primary schools in Vanuatu have adopted results-driven teaching. They set clear goals and encourage each pupil to perform to the best of their ability. The government through the Ministry of Education and Training has also invested lots of resources and efforts to strengthen teaching and learning in schools.
In general, MoET teaching force is comprised of certified and certified teachers. The non-certified teachers are basically those who are currently teaching without going through a formal teaching program. Certified teachers however are those who diploma program in teaching at the VITE. At the policy level, Ministry of Education and Training has piloted an external study under the VESP support to upgrade teaching certificate Degree level through VITE and the In-service teacher training programs.
The In-Service Teacher Training has set a platform for School Principals and Teachers to further strengthen teaching and learning practices in the existing primary schools by developing a module called the Vanuatu School-Based In-Service Teacher Training (VanSBITT). This module helps many teachers and school Principals to understand their roles and responsibilities better as educational leaders and managers in schools. The same module has the opportunity to help teachers to improve their teaching performance in the classroom. In terms of planning, the In-Service Teacher Training Unit with support from the development partners has already started rolled out the In-service training in some provinces in 2017 & 2018 and will continue to be rollout in other province in the coming years.
KEY INDICATORS
SCHOOL LIFE EXPECTANCY INDICATORS 2018
School life expectancy in ECCE 2.0
School life expectancy in Primary, years 1-6 6.0
School life expectancy in Secondary, year 7-13 5.3
YEAR 8 AND YEAR 10 NATIONAL EXAMS ASSESSMENT RESULTS, 2017
Year 8 - National average mean score, English and French language 49.4
Year 8 – Nation average mean score, Maths 49.2
Year 8 – National average mean score, Social Science 48.6
Year 8 – National average mean score, Basic Science 49.6
Year 8 – National average mean score, Agriculture 50.3
Year 8 – National average mean score, language taught (English in French speaking schools and French in English speaking schools)
48.9
Year 8 – National average mean score, religious education 50
Year 10 – National average mean score, English and French language 47.6
Year 10 – National average mean score, Maths 49.4
Year 10 – National average mean score, Social Science 47.4
Year 10 – National average mean score, Basic Science 48.5
Year 10 – National average mean score, Agriculture 48.8
Year 10, National average mean score, language taught (English in French speaking schools and French in English speaking schools)
47.6
Year 10 – National average mean score, religious education 47.6
Year 10 – National average mean score, technology 52.5
Footnote: National average mean scores are comprised of assessment results from both English and French schools. Language taught is defined as French in English speaking schools and English in French speaking schools. National marking scale is out of 100.
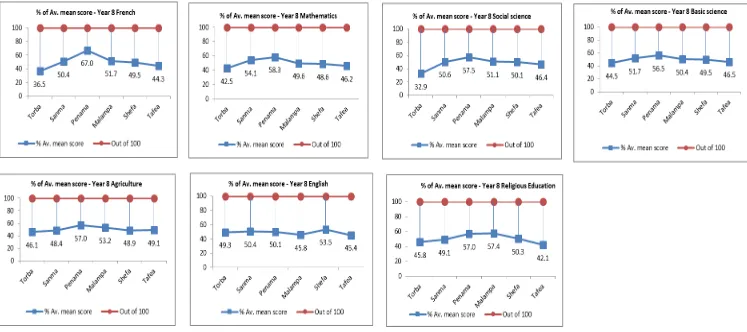
Only one indicator has been chosen to determine “Quality” in Primary and Secondary education which are the exams results. The graphs below are showing students learning outcomes using the average mean scores by subject level to determine the overall student’s performances after sitting the national year 8, 10 and year 12 exams in 2017. The analysis of the exam’s results is very useful and can be used to influence any decision-making at cross-sectoral level.
The calculation of the average mean scores is out of 100%. The overall analysis shows that year 8 students in Penama province performed better than other year 8 students in other provinces. In overall, the average mean scores by subject are mostly close to or above 50%.
Learning outcomes through the National Assessment Results
Figure 4: Total Average mean Score by subject and province, Year 8 English speaking schools, 2017
STRENGTHEN EDUCATION MANAGEMENT
Figure 8: Total education expenditure as percentage of Gross Domestic Product (GDP), Education Sector, 2018
The total of education expenditure covers (School Province, and Central) government expenditures on education (current, capital, and transfers) and it includes expenditure funded by transfers from international sources to government as percentage of the GDP. The country’s school enrolment in ECCE, Primary and Secondary Schools has increased from 72,173 in 2016 to 88,433 students in 2018 as a result of growing population and most importantly the School Grant Scheme that was implemented in 2010 for Primary and ECCE lately in June 2018. In addition to the budget increase for scholarships in 2017, MoET made a policy decision to also provide school grant to all the registered ECCE centres and to pay for the ECCE teacher salaries starting in 2018. Such policy decision may have contributed to increase school enrolment in the existing ECCE centres throughout the country in 2018.
Though the school grant policy has been introduced since 2009 to increase the net enrolment rate in primary, still many schools are requesting contributions from parents’ especially for schools in town. Beside the financial support through the government system, schools are also receiving help or direct contributions in kind or by cash from external sources. The GDP calculation does also take into account the direct funding sources to the schools.
6.6%
7.3% 7.6%
7.9%
5.5% 6.0% 6.5% 7.0% 7.5% 8.0%
2014 2015 2016 2017
1.
ACCESS AND PARTICIPATION IN EDUCATION
MEASURING ACCESS AND EQUITY
Indicators 2014 2015 2016 2017 2018 Net Enrolment Rate (NER)
ECCE 42.8% 42.7% 33.3% 65.8% 77.9%
Primary (Year 1-6) 88.0% 86.2% 84.6% 90.4% 91.7%
Secondary (Year 7+) 34.9% 34.9% 42.2% 43.2% 42.4%
% of over, under and official age
< 4 year old in ECCE 11% 11% 32% 24% 5%
> 4-5 years old in ECCE 11% 11% 8% 3% 21%
< 6 years old in Primary Year 1-6 1% 1% 3% 4% 2%
> 6 - 12 years old in Primary year 1-6 15% 15% 10% 11% 14%
< 12 years old in Junior Secondary 7-10 2% 2% 3% 3% 1%
> 20 years old in Junior Secondary 7-10 14% 14% 0% 1% 1%
Out-of-school children
Out-of-school 4-5 years old 61% 68% 56% 21% 16%
Out-of-school 6-11 years old 12% 13% 13% 8% 8%
New Entrants in primary Year 1 who have
attended Early Childhood Development Program 66% 42% 66% 67% 73%
Net Intake Rate (NIR) 36% 31% 45% 59% 60%
Gross Intake Rate (GIR) 119% 127% 123% 150% 154%
Average Dropout Rate
Primary (Year 1-6) 5.0% 8.7% 6% 6% 4%
Secondary (Year 7+) 34% 28% 20% 18% 18%
Survival Rate
Survival rate to Year 6 81% 79% 58% 69% 99%
Survival Rate to Year 13 22% 20% 21% 23% 23%
Open VEMIS is in progression since 2015. Some of the indicators as stated in the above table can be generated from the system. However some indicators relevant to determine the internal efficiency of the education system in Vanuatu are yet to be automated in the system. Data around repeaters and dropout or the completion rate to the last grade of primary (GIRLG) will likely be made available in the 2019 Digest since data is not available in the Open VEMIS for now. On the other side, the integrity of the indicators for ACCESS and PARTICIPATION becomes more reliant and vital since Open VEMIS is tracking individual student by their name and date of birth.
Table 5: Enrolment by education authority, sex and school level, 2016 – 2018
ECE Primary (1–6) Secondary (7+)
Private 3,137 2,863 6,000 110 71 181 83 66 149
Community 1,032 1,010 2,042 100 100 200 133 83 216
Total 4,577 4,223 8,800 23,770 21,195 44,965 9,161 9,247 18,408 2017 Government 1,204 995 2,199 18,205 15,948 34,153 6,121 6,277 12,398
Church (Govt. Assisted) 470 415 885 7,469 6,635 14,104 3,140 3,299 6,439
Subtotal Govt. 1,674 1,410 3,084 25,674 22,583 48,257 9,261 9,576 18,837
Church 33 34 67 0 0 0
Private 4,572 4,103 8,675 186 145 331 90 82 172
Community 1,615 1,547 3,162 187 163 350 132 90 222
Total 7,861 7,060 14,921 26,080 22,925 49,005 9,483 9,748 19,231 2018 Government 1,186 1,135 2,321 18,660 16,248 34,908 6,001 6,374 12,375
Church (Govt. Assisted) 390 419 809 8,861 7,921 16,782 3,552 3,630 7,182
Subtotal Govt. 1,576 1,554 3,130 27,521 24,169 51,690 9,553 10,004 19,557
Church 49 64 113 16 16 32
Private 4,685 4,479 9,164 349 311 660 120 90 210
Community 1,723 1,644 3,367 176 150 326 115 69 184
Total 7,984 7,677 15,661 28,095 24,694 52,789 9,804 10,179 19,983 Source: Open VEMIS, 2018
Table 6: Enrolment by Education Authority and by Education Level, 2016 - 2018
Education Level
Year Education Authority ECE Primary (1–
6) Jnr Secondary (7–10) Snr Secondary (11+) Vanuatu
2016 Government 547 31,675 9,214 2,736 44,172
Church (Govt. assisted) 211 12,858 4,569 1,512 19,150
Subtotal Govt. 758 44,533 13,783 4,248 63,322
Church 51 11 1 63
Private 6,000 181 149 0 6,330
Community 2,042 200 149 67 2,458
Total 8,800 44,965 14,092 4,316 72,173
2017 Government 2,199 34,153 9,582 2,816 48,750
Church (Govt. assisted) 885 14,104 4,914 1,525 21,428
Subtotal Govt. 3,084 48,257 14,496 4,341 70,178
Church 0 67 0 0 67
Private 8,675 331 172 0 9,178
Community 3,162 350 148 74 3,734
Total 14,921 49,005 14,816 4,415 83,157
2018 Government 2,321 34,908 9,585 2,790 49,604
Church (Govt. assisted) 809 16,782 5,761 1,421 24,773
Subtotal Govt. 3,130 51,690 15,346 4,211 74,377
Church 113 32 0 145
Private 9,164 660 210 0 10,034
Community 3,367 326 117 67 3,877
Total 15,661 52,789 15,705 4,278 88,433
Source: Open VEMIS, 2018
The age participation rate is a valuable indicator to calculate the School Life Expectancy. The level of NER by age is determined by the number of students enrolled by age specific divided by the same age population.
Figure 9: Age Participation Rate, 2018
This indicator is actually relevant as it gives a rough idea of students’ participation rate in primary schools in the correct age. In terms of analysis, the age level NER is showing the increase as we move from age 6 to 12 years old and indicated a decreased as we moved from age 13 to 18 years old.
ENROLMENT BY PROVINCE
The following tables are aggregated by province and by sex will be an opportunity for the decision makers to use the roll data aggregated by province to rationalize their plans according to the schools improvement needs around teaching and learning. School-Based Management (SBM) can also use the roll data from this section to develop realistic monitoring plans for all schools throughout the country. For now, MoET is not able to define how many of the enrolled students are in special needs due to lack of data on children with disability.
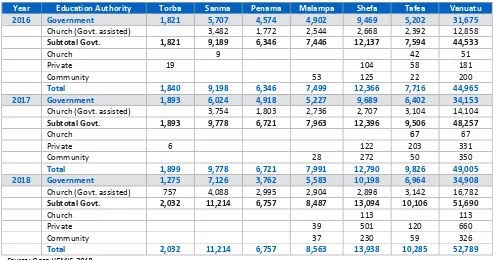
Table 7: Enrolment in Primary 1 to 6 by education authority and province, 2016 - 2018
Year Education Authority Torba Sanma Penama Malampa Shefa Tafea Vanuatu
2016 Government 1,821 5,707 4,574 4,902 9,469 5,202 31,675
Church (Govt. assisted) 3,482 1,772 2,544 2,668 2,392 12,858
Subtotal Govt. 1,821 9,189 6,346 7,446 12,137 7,594 44,533
Church 9 42 51
Private 19 104 58 181
Community 53 125 22 200
Total 1,840 9,198 6,346 7,499 12,366 7,716 44,965 2017 Government 1,893 6,024 4,918 5,227 9,689 6,402 34,153
Church (Govt. assisted) 3,754 1,803 2,736 2,707 3,104 14,104
Subtotal Govt. 1,893 9,778 6,721 7,963 12,396 9,506 48,257
Church 67 67
Private 6 122 203 331
Community 28 272 50 350
Total 1,899 9,778 6,721 7,991 12,790 9,826 49,005 2018 Government 1,275 7,126 3,762 5,583 10,198 6,964 34,908
Church (Govt. assisted) 757 4,088 2,995 2,904 2,896 3,142 16,782
Subtotal Govt. 2,032 11,214 6,757 8,487 13,094 10,106 51,690
0% 1% 12%
66%
90% 99% 98% 99% 97% 90%
58% 34%
16%
6% 5% 2%
0 20 40 60 80 100
3 4 5 6 7 8 9 10 11 12 13 14 15 16 17 18
Age
Table 8: Total enrolment in secondary (Year 7+) by education authority and province, 2016 - 2018
Province
Year Education Authority Torba Sanma Penama Malampa Shefa Tafea Vanuatu 2016 Government 454 2,914 914 1,755 4,727 1,186 11,950
Church (Govt. assisted) 72 1,202 1,184 795 1,756 1072 6,081
Subtotal Govt. 526 4,116 2,098 2,550 6,483 2,258 18,031
Church 12 12
Private 73 76 149
Community 216 216
Total 526 4,201 2,098 2,550 6,699 2,334 18,408
2017 Government 394 3,006 960 1,754 4,839 1,445 12,398
Church (Govt. assisted) 82 1,396 1,123 825 1,837 1176 6,439
Subtotal Govt. 476 4,402 2,083 2,579 6,676 2,621 18,837
Church 0
Private 52 120 172
Community 222 222
Total 476 4,454 2,083 2,579 6,898 2,741 19,231
2018 Government 249 2,985 457 1,811 5,095 1,778 12,375
Church (Govt. assisted) 272 1,542 1,531 909 1,964 964 7,182
Subtotal Govt. 521 4,527 1,988 2,720 7,059 2,742 19,557
Church 32 32
Private 32 106 72 210
Community 184 184
Total 521 4,559 1,988 2,720 7,381 2,814 19,983
Source: Open VEMIS, 2018.
ENROLMENT BY URBAN AND RURAL
The number of student in urban and rural schools is relevant information; the same information can be used to equally share school resources and subsidize grants to schools. Around 79% of students enrolled in rural schools and 21% in urban schools.
Table 9: Total Enrolment in Urban and Rural Schools by school type and province, 2016 - 2018
Year School Type
Rural Urban
Torba Sanma Penama Malampa Shefa Tafea Total Sanma Shefa Total
2016
ECCE 408 1,315 744 1,897 971 2,077 7,412 726 662 1,388
Primary 1,840 6,538 6,346 7,499 7,139 7,716 37,078 2,660 5,227 7,887
Secondary 526 2,455 2,098 2,550 2,696 2,334 12,659 1,746 4,003 5,749
Total 2,774 10,308 9188 11,946 10,806 12,127 57,149 5132 9892 15,024
2017
ECCE 532 2,372 1,745 2,123 2,750 2,921 12,443 1,032 1,446 2,478
Primary 1,899 7,054 6,721 7,991 7,314 9,826 40,805 2,724 5,476 8,200
Secondary 476 2,647 2,083 2,579 2,808 2,741 13,334 1,807 4,090 5,897
Total 2,907 12,073 10,549 12,693 12,872 15,488 66,582 5,563 11,012 16,575
2018
ECCE 778 2,741 1,376 2,187 2,994 2,801 12,877 1,049 1,735 2,784
Primary 2,032 7,978 6,757 8,563 7,801 10,285 43,416 3,236 6,137 9,373
Secondary 521 2,638 1,988 2,720 2,893 2,814 13,574 1,921 4,488 12,157
ENROLMENT BY LANGUAGE OF INSTRUCTION
Table 10: Total Enrolment by School and language of Instruction, 2016 - 2018
ECE Primary (1–6) Secondary (7+)
Language 2015 2016 2017 2018 2015 2016 2017 2018 2015 2016 2017 2018
Bilingual 60 133
Bislama 505 407 852 1,183
English 8,836 5,392 7,259 7,464 30,011 29,177 32,092 34,862 14,754 13,008 13,509 13,847
French 2,006 1,278 1,965 1,821 15,920 15,788 16,913 17,927 5,681 5,400 5,722 6,136
Vernacular 2,954 1,723 4,785 5,193
Vanuatu 14,301 8,800 14,921 15,661 45,931 44,965 49,005 52,789 20,568 18,408 19,231 19,983 Source: Open VEMIS, 2018.
In 2018, the distribution of students by language of instruction shows that in ECCE, 48% of student enrolled in English schools, 48% in French and other 12% of students enrolled in either Vernacular or Bislama. In Primary 66% students enrolled in English schools and 34% enrolled in French speaking schools. And, in Secondary, 69% of students enrolled in English schools and 31% students enrolled in French speaking schools.
SCHOOLS BY LANGUAGE OF INSTRUCTION AND SCHOOL TYPE
Table 11: Number of schools that are officially registered with the MOET by province, 2018
Province School Type Government Church (Govt. assisted)
Church (Not Govt.
assisted) Community Private Total
Torba
ECCE 3 2 20 23 48
Primary 18 8 26
Secondary 3 2 5
Total 24 12 20 23 79
Sanma
ECCE 6 9 46 136 197
Primary 57 41 1 2 101
Secondary 6 8 1 1 16
Total 69 58 2 46 139 314
Penama
ECCE 7 62 57 126
Primary 39 25 64
Secondary 6 9 15
Total 45 41 62 57 205
Malampa
ECCE 22 42 75 139
Primary 54 34 2 90
Secondary 10 10 20
Total 64 66 44 75 249
Shefa
ECCE 74 4 12 37 127
Primary 65 16 1 2 9 93
Secondary 13 9 1 1 3 27
Total 152 29 2 15 49 247
Tafea
ECCE 6 69 100 175
Primary 49 25 1 1 2 78
Secondary 13 6 1 20
Total 62 37 1 70 103 273
Registered Schools in Vanuatu 416 243 5 257 446 1,367
Table 12: Number of schools by language that the school is registered in, 2015 - 2018
ECCE Primary (1–6) Secondary (7+)
Language 2015 2016 2017 2018 2015 2016 2017 2018 2015 2016 2017 2018
Bilingual 1 1 1
Bislama 26 27 26 74
English 340 338 315 364 282 288 286 303 65 63 63 71
French 71 68 65 81 151 150 150 152 30 29 29 33
Vernacular 139 133 114 319
Vanuatu 576 566 520 838 433 438 436 455 96 93 93 104 Source: Open VEMIS, 2018.
Table 13: Number of schools by Urban and Rural, 2016 - 2018
Year
School Type
Urban/Rural ECCE Primary Secondary Total
2016
Rural 532 406 74 1,012
Urban 34 32 19 85
Vanuatu 566 438 93 1,097
2017
Rural 489 404 74 967
Urban 31 32 19 82
Vanuatu 520 436 93 1,049
2018
Rural 792 419 83 1,294
Urban 46 36 21 103
Vanuatu 838 455 104 1,397
Source: Open VEMIS, 2018.
ENROLMENT RATES
Enrolment rates are expressed as gross and net enrolment rates, which are calculated by dividing the number of students of a particular age group enrolled in all levels of education by the size of the population of that age group.
Table 14: Gross Enrolment Rate and Parity Index (GPI) by school type, 2016 - 2018
ECCE Primary (1–6) Secondary (7–13)
Year Male Female Total GPI Male Female Total GPI Male Female Total GPI
2016 60% 60% 60% 1.00 114% 110% 112% 0.96 43% 48% 45% 1.10
2017 102% 100% 101% 0.98 122% 116% 119% 0.95 44% 49% 47% 1.12
2018 104% 109% 106% 1.05 128% 122% 125% 0.95 46% 51% 48% 1.12 Source: Open VEMIS, 2018.
The gross enrolment rate in ECCE has increased significantly from 66% in 2016 to 109% in 2018. The strengthening of ECCE data collection in 2017 and the school grant were two incentives that
contributed to the change on the GER in ECCE in 2018. The Out-of-School Children age 4 and 5 years old has also significantly dropped from 56% in 2016, 21% in 2017 and 16% in 2018, that clearly indicate that more children have been enrolled in the ECCE centres in 2017 and 2018.
Table 15: Net Enrolment Rate (NER) and Gender Parity Index (GPI) by School Type, 2016 - 2018
ECCE Primary (1–6) Secondary (7–14)
Year Male Female Total GPI Male Female Total GPI Male Female Total GPI
2016 32.8% 33.8% 33.3% 1.03 84.8% 84.6% 84.6% 1.00 40.1% 44.9% 42.4% 1.12 2017 66.4% 65.4% 65.8% 0.99 87.6% 90.8% 90.4% 1.04 39.9% 45.6% 43.2% 1.15 2018 75.5% 80.5% 77.9% 1.07 92.9% 90.4% 91.7% 0.97 39.2% 45.8% 42.4% 1.17
Source: Open VEMIS, 2018.
Though there is an increase on the net enrolment rate in ECCE and in primary education between 2016 and 2018, the gap between the GER and NER remains significant. The percentage of the overage students in existing ECCE centres is 26% in 2018 and 16% in primary schools. The net enrolment rate in ECCE however has increased from 65.8% in 2017 to 77.9% in 2018. In Primary, the NER has shown a slide increase from 90.4% in 2017 to 91.7% in 2018.
SCHOOL LIFE EXPECTANCY
Figure 10: Average number of years of schooling that the Education system in Vanuatu offers, 2018
The school life expectancy is calculated as the sum of the age specific enrolment rates for the year levels as specified in figure 10. The total average of years of schooling spends by a Ni-Vanuatu student is approximately 12.8 years which indicates probabilities for high retention in the education system.
0 1 2 3 4 5 6 7 8 9 10 11 12 13 14
Year 1 Year 2 Year 3 Year 4 Year 5 Year 6 Year 7 Year 8 Year 9 Year 10 Year 11 Year 12 Year 13 Year 14
TOTAL ENROLMENT BY YEAR LEVEL AND BY AGE
Table 16: Total Enrolment by Year Level and by Age, 2018
Source: Open VEMIS, 2018.
Age In
Years Pre-School 1 2 3 4 5 6 7 8 9 10 11 12 13 Total
3 829 3 1 1 834
4 5,287 101 4 2 1 2 5,397
5 6,192 793 52 4 2 1 2 2 7,048
6 2,596 4,428 396 26 12 4 3 1 1 1 7,468
7 500 3,751 2,518 245 39 10 4 2 2 3 1 7,075
8 156 1,576 4,049 1,572 196 20 5 6 5 1 2 7,588
9 43 400 2,106 3,059 1,118 142 39 5 7 2 4 1 4 6,929
10 18 139 829 2,225 2,491 916 107 10 7 7 1 2 6,753
11 9 26 289 1,042 2,195 1,993 791 107 8 9 2 6,471
12 3 19 106 451 1,312 2,029 1,780 663 86 9 7 2 1 6,468
13 4 6 25 158 513 1,223 1,681 1,298 582 72 7 1 1 5,571
14 11 7 18 66 189 618 1,157 1,361 1,235 478 85 7 1 5,233
15 7 9 8 21 62 218 614 974 1,064 951 458 67 3 1 4,457
16 2 14 5 5 18 83 246 440 709 896 824 341 41 2 3,626
17 1 52 42 55 17 27 86 178 333 554 783 535 305 59 3,027
18 1 6 13 4 8 19 43 69 131 338 554 484 501 264 2,435
19 2 1 1 1 12 14 35 73 180 219 360 354 1,252
20 1 1 1 2 3 9 22 43 73 149 231 534
21 1 1 2 7 10 13 45 93 172
22 1 2 3 2 0 10 7 27 53
23 1 1 1 1 2 1 1 7 10 25
24 1 1 4 6
25 1 1 1 1 3 1 3 11
Total 15,661 11,333 10,463 8,938 8,170 7,311 6,574 5,138 4,218 3,432 2,960 1,759 1,426 1,050 88,433
ECCE Primary
Secondary Level
ENROLMENT RATES
Table 17: GER and Gender Parity Index aggregated by province, 2016 - 2018
Province Torba Sanma Penama Malampa Shefa Tafea
GER GPI GER GPI GER GPI GER GPI GER GPI GER GPI
ECCE
2016 66.4% 1.06 67.9% 0.95 39.5% 0.98 91.5% 1.07 32.6% 0.99 96.9% 0.98 2017 86.7% 1.13 112.3% 1.00 92.9% 1.07 103.8% 0.99 82.6% 0.95 140.0% 0.91 2018 126.9% 1.23 124.2% 1.13 73.27% 0.93 108.3% 1.07 92.1% 0.99 137.4% 1.02
Primary
(1–6)
2016 110.7% 0.98 114.1% 0.99 118.1% 0.93 124.6% 0.93 97.3% 1.00 122.1% 0.91 2017 111.8% 0.99 117.8% 0.97 122.8% 0.93 131.6% 0.94 95.4% 0.97 155.4% 0.88 2018 117.3% 1.04 131.4% 0.97 121.95% 0.96 140.4% 0.94 99.1% 0.97 163.5% 0.89
Secondary
(7+)
2016 29.1% 1.23 51.0% 1.06 37.6% 1.08 38.8% 1.11 58.0% 1.11 34.4% 0.92 2017 26.2% 1.35 53.3% 1.09 37.2% 1.08 39.1% 1.15 58.1% 1.13 39.6% 1.03 2018 28.5% 1.14 53.7% 1.15 35.2% 1.10 41.0% 1.18 60.2% 1.15 40.1% 0.97
Source: Open VEMIS, 2018.
Table 18: NER and Gender Parity Index per province, 2016 - 2018
Province Torba Sanma Penama Malampa Shefa Tafea
NER GPI NER GPI NER GPI NER GPI NER GPI NER GPI
ECE
2016 37.9% 1.05 38.8% 1.01 22.8% 0.97 53.6% 1.08 20.5% 1.03 43.8% 1.01 2017 65.4% 1.12 68.4% 1.05 63.6% 1.06 82.2% 0.96 51.1% 0.94 89.6% 1.01 2018 83.5% 1.23 85.9% 1.14 54.9% 0.95 86.8% 1.09 65.6% 1.03 107.5% 1.04
Primary
(1–6)
2016 81.2% 1.02 86.3% 1.03 88.7% 0.99 95.3% 0.99 78.9% 1.06 81.2% 0.93 2017 78.7% 1.04 89.1% 1.01 93.3% 0.97 101.7% 0.98 77.5% 1.00 106.5% 0.90 2018 81.8% 1.08 96.6% 1.00 87.6% 1.00 104.8% 0.97 77.3% 0.98 110.8% 0.89
Secondary
(7+)
2016 28.5% 1.25 46.6% 1.08 35.7% 1.13 37.1% 1.11 52.6% 1.12 27.73 1.13 2017 25.3% 1.42 48.1% 1.11 34.9% 1.11 36.7% 1.16 51.4% 1.10 35.2% 0.92
2018 23.7% 1.22 46.8% 1.19 32.0% 1.09 38.3% 1.20 53.1% 1.21 34.6% 1.04
Source: Open VEMIS, 2018.
In general, the GER value by province is approaching or exceeding 100% across all provinces. It is likely that most provinces are able to accommodate their school-age population. However the difference between the GER and NER by province remains high indicating that there are still high numbers of overage in ECCE and Primary schools. The gap between the GER and NER in Shefa province is large; this could be determined by the number of overage students in primary within the urban and rural schools.
96%
4% Average Retention and Dropout Rate, year 1-6,
2018
Average completion Rate Average Dropout Rate
99% Average Promotion Rate,
Year 1-6, 2018
Average promotion rate, Year 1 - 6
99%
Average Survival Rate to Year 6, 2018
Average Survival Rate, Year 1 - 6
24% Average Repetition rate
Year 1 - 6, 2018
Average Repetition rate
INTERNAL EFFICIENCY INDICATORS
The Internal efficiency is the relationship between the outputs and inputs of the education system in Vanuatu.
Figure 11: Dropout, Repeater and Promotion Rate in Primary Schools, 2018
Source: UNESCO flow rate approach was used to calculate these indicators
These indicators were calculated to determine the internal efficiency in Primary Education in
Vanuatu. The dropout rate is calculated based on 100-(Promotion Rate + Repetition Rate). In overall, the average dropout rate in primary is low; meaning that around 96% of students may have
completed their primary education.
The average promotion rate is at 99% in 2018 and it’s close to 100%. Ideally the approach to calculate this indicator is very simple (Promotion Rate + Dropout Rate + Repetition Rate) = 100. This is a key indicator which the MoET planners could use to analyse and project the pupils flow from grade to grade within an education cycle.
The survival rate is affected by the number of students being dropped out, promoted and repeated in primary schools.
Figure 12: Survival Rate and Promotion Rate in Secondary Schools, 2018
The average promotion rate from Year 7 to Year 12 is 65% with a potential 3% average of students may have dropped out and 32% of them may have repeated along the way in secondary schools. The internal efficiency of the system depends a lot on the quality of the data in the Open VEMIS and it defines the optimal use of resources (inputs) in producing its outputs. MoET does not have a policy around repetition; however the enrolment by age has confirmed that around 3% of the secondary
77% 23%
Survival Rate to Year 13, 2018
Started Year 7 Survive through Year 13
84%
58% 65%
0% 20% 40% 60% 80% 100%
Promotion from Year 8 to Year 9
Promotion from Year 9 to Year 10
Promotion from Year 12 to Year 13 Promotion Rate from Year 8 to 9, form Year 9 to 10
school students are overage. More boys turn to dropout from the secondary schools in Vanuatu than girls. Girls’ pregnancy is another factor that affects girls’ opportunities to complete their education. The demographic and health survey in 2013 has pointed out that roughly 500 girls aged 15 to 19 gave birth to their child and this is one of the main reasons girls are dropping out from schools. Another area that can be described as a barrier to education is the high costs of school fees that vary from school to school. Due to financial challenges, Parents may find it difficult to meet the high costs of school fees in the existing secondary schools which may have resulted to the out-of-school children in high schools. According to the Open VEMIS data, the out-of-school children aged 12-19 years old could range from 58% to 60% in 2017 based on the 2018 estimated population data.
POST SCHOOL EDUCATION AND TRAINING (PSET)
According to ISCED4 level, post-secondary and non-tertiary education provides learning and educational activities building on secondary education preparing students for both labor market entry as well as formal tertiary education. It typically targets students who have completed upper secondary (ISCED level 3) but who wish to increase their opportunities either to enter the labour market or to progress to tertiary education.
In Vanuatu, Higher Education, PSET, Tertiary Education or Third level education is an optional final stage of formal learning that occurs after secondary education. So far the 2009 national census has indicated that the overall adult literacy rate is 64% of the overall population of Vanuatu.
Table 19: Number of trainees in Post School Education and Training, 2016 - 2018
Institutions 2016 2017 2018
M F T M F T M F T
Vanuatu Maritime College (VMC) 1,160 96 1256 925 38 963 748 8 756
Vanuatu Institute of Teachers
Education (VITE) 75 142 217 108 184 292 54 72 126
Vanuatu Institute of Technology
(VIT) 213 142 355 290 227 517 509 382 891
Vanuatu Nursing College (VNC) 28 43 71 32 79 111 32 79 111
Australian Pacific Training College
(APTC) 51 84 135 108 206 314
Vanuatu Agriculture College (VAC) 69 19 88 65 29 94 79 57 136
Vanuatu Police College 24 11 35
Total 1,596 526 2,122 1,528 763 2,291 1,446 609 2,055
Source: Data on post-secondary education were provided by the respective institutions as listed above. APTC was not able to provide their roll data for 2018 as they are still gathering data.
Table 20: Number of graduates in Post School Education and Training, 2016 - 2017
Institution 2016 2017
M F T M F T
Vanuatu Maritime College (VMC) 1,149 86 1,235 923 34 3,427
Vanuatu Institute of Teachers Education (VITE) 41 60 101 40 82 324
Vanuatu Institute of Technology (VIT) 191 105 296 20 9 621
Vanuatu Nursing College (VNC) 11 30 41