Page 236
DETERMINING THE PERCEPTIONS OF SECONDARY SCHOOL STUDENTS ABOUT THE CONCEPT OF MAP WITH METAPHOR
Yasin Duran1, Caner Aladağ2, Tahsin Tapur2
1Sarayönü Ladik Multi-Programmed Anatolian High School, Turkey 2Ahmet Keleşoğlu Faculty of Education, Department of Geography Teaching,
Necmettin Erbakan University, Turkey
Abstract
The aim of this study is to reveal the perceptions of secondary school students about the concept of map through metaphors. The population of the research is secondary-school students. The sample of this research carried out in the pattern of phenomenology is composed of 56 students studying in the 9th grade of Ladik Ahmet Hüdai Anatolian Imam Hatip (religious vocational) High School (Sarayönü, Konya). In the study, answers were tried to be found out to determine which metaphors the secondary school students used to explain their perceptions about the map, and what the common characteristics of these metaphors were. The data of the study was obtained by each student's completing his/her statement of "Map is like ... Because..." The content analysis technique was used to analyse and interpret the data. According to the results of the study, students produced 26 valid metaphors related to the concept of the map. These metaphors were then examined for their common features and gathered in 5 conceptual categories (map as a guide, map as a protective, map as a reduced, map as a puzzle and map as informative). As a result of the research, the category of map as a guide is mentioned by the students most. As a result, it has been observed that the students have constructed the concept of map correctly in their minds in general.
Key words: map, qualitative research, metaphor, phenomenology, secondary education
1. INTRODUCTION
Geography is a branch aimed at enabling people to recognize the world from their immediate surroundings and to develop their geographical consciousness in this sense.
Although geographers have many techniques for displaying, shaping, generalizing and storing information, according to Harvey (1969), none of them are “as close to the hearts and minds of geographers as ‘maps’ ” (Transmitter: Kızılçaoğlu, 2007: 341). According to Özgüç and Tümertekin (2000), since its first appearance, the map has continued to be a powerful metaphor that reflects how we see our world and shapes that view. Since ancient times, people have used a variety of tools to recognize and understand the environment they live in better and over time, the need to express the environment they live in has begun to be shown through maps even if they are primitive and incomplete. Today, with very advanced technical possibilities, maps are indispensable elements to transmit the geographical features and knowledge of the environment. In other words, maps constitute the basis of geography (Demiralp, 2009). From the past to the present day, maps have had a great place in the lives of people. Maps are the most important means of communication that transmit all geographical formations in the world to people with different forms and symbols (Kartal and Koç, 2017). So, maps have been prepared to make it easier to recognize a bordered region and to transfer the selected information so that they can be perceived as a whole.
Metaphors are defined by scientists in different ways. The metaphor comes from the ancient Greek word metaphora, meaning "transfer" (Presmeg, 1998). Turkish Language Association (TDK) has defined the concept of "metaphor" in its Contemporary Turkish Dictionary as “Using a word or concept in a way other than accepted” (Turkish Language Association, 2017).
Page 237
metaphorical”. The metaphor comes into existence through stating the fact that the X-factor is like the Y-factor, explicitly or secretly. The thing that makes the metaphor strong as a mental model is that it allows establishing a relationship between the two disjunctive phenomena or allows a certain mental schema to be reflected on another mental schema (Saban, 2008a: 460). The metaphor allows the individual to make a comparison between two events, phenomenon, subjects or concepts, and to present the similarities of them in a figurative narrative (Coşkun, 2010). Human beings have an endless creativity inherently. This creativity forms a basis for individuals to relate what they see and think to other things. Thus, the concept called the metaphor reveals the "relevance" in its essence and comes out as "expressing a concept or situation with another concept or situation" (Aydın and Pehlivan, 2010).
In order for anything to deserve the "metaphor" label, the answer to these three questions needs to be given: 1) what is the target and source of metaphor and how can we know? (The subject of metaphor), (2) which is the target and resource area of the metaphor and how can we know? (The source of metaphor), (3) what properties can be matched to the target domain from the metaphor's source domain and how the choice has been decided? (Forceville, 1994; Forceville, 2002). This relation is expressed by Saban (2004) with an example: When we say "Teacher is like a gardener" or "Teacher resembles to a gardener", the subject of metaphor is teacher, the source of metaphor is gardener and the feature that is supposed to be attributed from the source of metaphor to its subject is the teacher should also take the individual differences of the students into account in the class, as the gardener is interested in the seedlings he has cultivated one by one.
When the relevant literature is examined, it is noteworthy that there is an increase in studies dealing with education and metaphors produced for some phenomena related to education. These researches have generally been carried out to reveal what metaphors have been used by participants in the study group to express concepts or phenomena such as "school", "teacher", "student", "knowledge", "learning", "culture", "geography" and "climate".
2. OBJECTIVE OF THE RESEARCH
The perceptions of secondary school students regarding the concept of "map" vary depending on the education they receive during their school life, their communication tools, the interest of their family and the people around them. It is expected that secondary school students' mental images about the map, which is a general concept, should present an important point of view both to the teachers of the lessons and to the educators. In this research, it was aimed to investigate the mental perceptions of the secondary school students about the concept of map through metaphors. In the survey, two main questions were searched within this general purpose:
(1) What are the mental images of secondary school students about the concept of maps?
(2) Under which conceptual categories are the mental imageries of the secondary school students reflecting the concept of map grouped in terms of their common features?
3. METHOD 3.1. Research Design
This study has been carried out within the scope of "phenomenology" design, which is one of the qualitative research designs, and the concept of "map" constitutes the form of study.
Page 238 3.2. Participants
In this research, "easily accessible" sampling technique was used from purposeful sampling techniques in the qualitative research tradition (Saban et al., 2014). Participants of the study consist of 9th grade students who are studying in Ladik Ahmet Hüdai Anatolian Imam Hatip High School (Sarayönü / Konya) in 2016-2017 education year.
Table 1. Frequency and percentage distribution of secondary school students participated in research according to gender
Gender Frequency (f) Percentage (%)
Girl 30 53,57
Boy 26 46,43
Total 56 100,00
As seen in Table 1, a total of 56 secondary school 9th grade students -26 of them (46.43%) were boys and 30 (53.57%) were girls- attended the research.
3.3. Data Collection
In order to reveal the mental imagery of the 9th grade students participating in the research on the concept of the map, each student was asked to complete the sentence of “Map is like .... Because...”. For this purpose, students were given a blank piece of paper on which this statement was written, and they were asked to express their thoughts through a single mental image using this phrase. In the phase of collecting data, an information program which was prepared before, applied in each class. At the beginning of the lesson, the concept of "metaphor" was explained and students were given some examples about metaphor from geography and daily life.
In studies that metaphors are used as a research tool, the concept of "like or as" is usually used to evoke the relationship between the subject of metaphors and the source of metaphors more clearly. In this research, the concept of “because” is included and requested from participants to provide a justification for their own metaphors.
3.4. Analysis and Interpretation of Data
The data obtained from this study was analysed by the "content analysis" technique. Although the related literature reveals different data analysis approaches, it is possible to examine the data analysis in two groups according to the depth of the analysis: content analysis and descriptive analysis. The main goal in content analysis is to reach the concepts and relationships that can explain the collected data. The data summarized and interpreted according to the previously determined theme in descriptive analysis are subjected to deeper processing in content analysis and the concept and themes that cannot be recognized by the descriptive approach can be explored (Yıldırım and Şimşek, 2016).
The metaphors developed by the students were analysed in five stages: (1) the naming phase, (2) the elimination and purification phase, (3) the compilation and category development phase, (4) the phase of ensuring validity and reliability, and (5) the phase of transferring data to the computer environment. (1) The Naming Phase: At this stage, a temporary list of mental images (or metaphors) produced by the students participating in the survey were put in alphabetical order. For this purpose, it was tried to be understood whether students expressed a clear metaphor in their writing. The metaphors provided by each student (for example, "compass", "guide", etc.) are coded.
Page 239
At first, more students were required to write metaphors (69); however, only 56 students' metaphors were taken into consideration while evaluating the study. A total of 13 students, 7 boys and 6 girls were excluded from the scope of the research, because of three basic reasons: (a) papers that do not contain any source of metaphors, (b) papers that do not provide any justification for the metaphor, (c) metaphor that is irrational and does not contribute to a better understanding of the concept of "map". For example, some sentences such as "Map is like geography. Because ..." or "The map is like Turkish Flag. Because ..." were eliminated because they do not contain any metaphor source.
(3) The Compilation and Category Development Phase: After removing a total of 13 papers containing students' weakly structured metaphors images, a total of 26 valid metaphor images were obtained. At this stage, these metaphors were again arranged in alphabetical order and re-examined to create a list of sample metaphor from selected students’ compositions that represent each metaphor. At this stage, also from the sample metaphors presented by the students were grouped under five conceptual categories in terms of their common features related to the concept of "map".
(4) The Phase of Ensuring Validity and Reliability: Validity and reliability are two of the most important measures used to achieve (or increase) the credibility of the results of a study (Saban, 2008b). Detailed reporting of collected data and explaining how the investigator reaches the results are important criteria for validity in a qualitative study (Yıldırım and Şimşek, 2016: 270).
For this research, two important processes have been carried out in order to ensure the validity of the results of the research: (a) The data analysis process is explained in detail. (b) Participant metaphor images compiled in the process of analysing and interpreting the findings were used as the primary source of data and given in the part of ‘findings’.
To ensure the reliability of the study, expert opinions were used to confirm the ability of the metaphors given under the five conceptual categories used in the research to represent these conceptual categories. For this purpose, two lists; (a) a list of 26 sample metaphorical images arranged in alphabetical order, and (b) a list containing the names and properties of 5 conceptual categories were given to a faculty member working in the same program. By using these two lists, it is requested from this faculty member to match the metaphor images in the first list with the 5 conceptual categories in the second list (not leaving any metaphor out). To ensure reliability, Miles and Huberman's (1994) formula was applied [Reliability = Number of Agreements / (Number of Agreements + Number of Disagreements) * 100]. In qualitative researches, if the harmony between the evaluations of expert and the researcher is 90% and above, the desired level of reliability is ensured (Saban, 2008a). For this research, the reliability was calculated as 24 / (24 + 2) * 100 = 92.31%.
(5) The Phase of Transferring Data to the Computer Environment: After determining 26 valid metaphors and the developing 5 conceptual categories of these metaphors, all data were transferred to the computer environment. After this process, the number of participants was calculated as (f) and percentage was calculated as (%), representing 26 metaphors and 5 conceptual categories. Finally, these data are presented in tables.
4. FINDINGS AND COMMENTS
Page 240
4.1. General findings about the metaphors that students have about the concept of map.
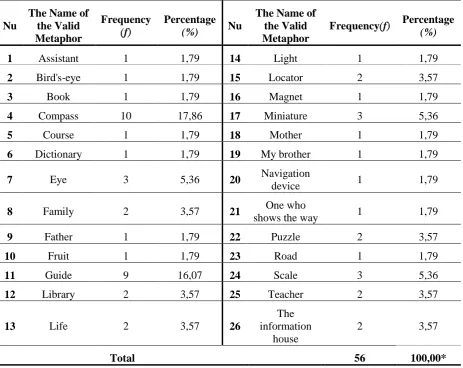
Table 2. Metaphors developed by secondary school students in relation to the concept of "map", number and percentage of students representing them (in alphabetical order)
Nu
The Name of the Valid Metaphor
Frequency
(f)
Percentage
(%) Nu
The Name of the Valid Metaphor
Frequency(f) Percentage (%)
1 Assistant 1 1,79 14 Light 1 1,79
2 Bird's-eye 1 1,79 15 Locator 2 3,57
3 Book 1 1,79 16 Magnet 1 1,79
4 Compass 10 17,86 17 Miniature 3 5,36
5 Course 1 1,79 18 Mother 1 1,79
6 Dictionary 1 1,79 19 My brother 1 1,79
7 Eye 3 5,36 20 Navigation
device 1 1,79
8 Family 2 3,57 21 One who
shows the way 1 1,79
9 Father 1 1,79 22 Puzzle 2 3,57
10 Fruit 1 1,79 23 Road 1 1,79
11 Guide 9 16,07 24 Scale 3 5,36
12 Library 2 3,57 25 Teacher 2 3,57
13 Life 2 3,57 26
The information
house
2 3,57
Total 56 100,00*
* Figures on the table may not be the same as the total due to rounding the numbers up.
Page 241
4.2. Conceptual categories created according to metaphors that students have about concept of map.
Metaphors that secondary school students have about the concept of map have been gathered in five categories. These are; “map as a guide”, “map as a protective”, “map as a reduced”, “map as a puzzle” and “map as informative” (Table 3).
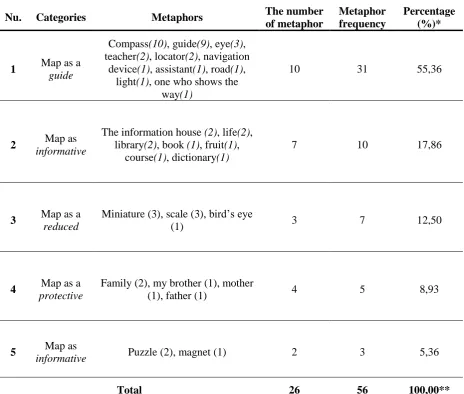
Table 3. Conceptual categories of metaphorical images that secondary school students have related to the concept of "map"
Nu. Categories Metaphors The number
of metaphor
Metaphor frequency
Percentage (%)*
1 Map as a guide
Compass(10), guide(9), eye(3), teacher(2), locator(2), navigation
device(1), assistant(1), road(1), light(1), one who shows the
way(1)
10 31 55,36
2 Map as informative
The information house (2), life(2), library(2), book (1), fruit(1),
course(1), dictionary(1)
7 10 17,86
3 Map as a reduced
Miniature (3), scale (3), bird’s eye
(1) 3 7 12,50
4 Map as a protective
Family (2), my brother (1), mother
(1), father (1) 4 5 8,93
5 Map as
informative Puzzle (2), magnet (1) 2 3 5,36
Total 26 56 100,00**
* Percentage (%) is found by the ratio of the metaphor frequency of a category to the total number of frequencies.
** Figures on the table may not be the same as the total due to rounding the numbers up.
4.2.1. Category 1: Map as a guide
This category presents the metaphor that makes up the category and the percentage and percentage of students who develop each metaphor. According to Table 3, this category is represented by 31 students (55.36%) and 10 metaphors (38.46%) in total. This category is the most preferred by secondary students, with the largest number of students in the categories.
Page 242
assistant, road, light, one who shows the way). Examples of expressions written by students for this category are as follows:
“Map is like a compass. Because it leads us when we lose our way like a compass.” “The map is like a guide. Because it shows us the way.”
“Map is like a teacher. Because it teaches us everything about the place it shows and let us go on the right way.”
“The map is like an assistant. Because in the recognition of the world - in determining where you are - it is the one who helps.”
“The map is like an eye. Because it allows us to find places we want to see and even see them without going there.”
“The map is like a road. The roads allow us to reach the places we want. Maps also allow us to reach places we want.”
4.2.2. Category 2: Map as Instructive
This conceptual category is represented by 10 students (%17,86) and 7 metaphors (%26.92).
In this category, secondary students produced metaphors by taking into account the issues about maps that are mostly related to information sources, which provide information about any field and subject (information house, life, library, book, fruit, course, dictionary). Below are examples of the metaphors that make up this category, which are defined by the students:
“Map is like an information house. Because whenever you look at the map as a house full of information, you get new information, a new experience.”
“The map is like a fruit. Because the flavours, shapes and growing patterns of the fruits are different as the maps have different shapes according to their usage purposes.”
“The map is like a library. Because we try to find things in libraries and we look for in a map how we are looking for a book.”
4.2.3. Category 3: Map as Reduced
This conceptual category is represented by 7 students (%12.50) and 3 metaphors (%11.54).
The prominent feature of metaphors in this category is that the map is associated with the drawing the earth or a part of the earth similarly by reducing it at a certain rate. Below are some sample sentences of this category in which the metaphors of miniature, scale, bird's eye are found.
“The map is like a bird's eye view. Because it is to look down from a high place in general.”
“The map is like a miniature. Because a very large place in reality is shown on a small piece of paper.”
4.2.4. Category 4: Map as protective
This category is represented by 5 students (%8,93) and 4 metaphors (%15,38).
The prominent feature of the metaphors in this category is that the map is in a position that helps us find our way, like a protective, foster family (family, my brother, mother, father). Below are some examples of the metaphors that make up this category.
“Map is like a family. Because my family protects and backs me up in my hard times. Map also supports me when I lose my way.”
“Map is like a mother. Because mothers know everything, guide and help.”
4.2.5. Category 5: Map as a Puzzle
Page 243
according to usage purposes and scale (puzzle, magnet). Below are examples of the metaphors that make up this category, which are defined by the students.
“The map is like a magnet. Because the magnet pulls certain substances. Maps also attract the attention of the people with some features.”
“The map is like a puzzle. Because it is necessary to examine and solve different maps as trying to solve various kinds of puzzles.”
5. RESULT, DISCUSSION AND SUGGESTIONS
When the data of this research conducted for the purpose of revealing the mental images of the secondary school students about the map concept are analysed, the following results are attracting attention. The students produced 26 valid metaphors (compass, guide, eye, fruit, dictionary, etc.) for the concept of map. This suggests that it is not possible to explain the concept of the map as a whole with only one metaphor. 14 metaphors from the 26 valid metaphors were produced by only one student. The number of students representing the remaining metaphors ranges from 2 to 10. When the mental images produced by the secondary school students related to the map concept are examined, it is seen that the most preferred metaphors are compass (f = 10), guide (f = 9), eye (f = 3), scale (f = 3) and miniature (f = 3).
The metaphors produced by secondary students on the concept of the map have been grouped under five different conceptual categories when examined in terms of their common characteristics (map as a guide, map as instructive, map as reduced, map as a protective, map as a puzzle). According to the results of the research, more than half of the students perceive the map as a thing that shows the way (f = 31; 55.36%) and an important quintile perceives it as informative (f=10; %17,86). The remaining three categories are [map as reduced (f=7; %12,50), map as protective (f=5; %8,93) and map as a puzzle (f=3; %5,36)] and these categories are represented by a student group of %26.79 in total.
Since there is no previous study to determine the mental images of the concept of map through metaphors, the results of the study were compared with other metaphor studies of different concepts or phenomena. There is a similar situation in metaphor studies of other concepts or phenomena as -it is impossible for any concept to be explained as a whole with a single metaphor-. For example, metaphorical studies on the concepts of Saban's (2002) research, "primary school"; Coşkun’s research (2010), "climate"; Aydın’s (2010), and Aydin & Eser Ünaldı’s research (2010), "geography"; again Aydın's research (2011), “environment” shows that a large number of metaphors have been produced by the participants in the study group on the related concepts or phenomena. Some of the concepts involved in map subjects are abstract and difficult to understand. When we look at the metaphors in which students refer to concept of the map, it is generally seen that the map is suitable for its purpose of use. It is also observed that there are similes that cannot express the map exactly. In the metaphors that students produce, it is noteworthy that when looking at expressions such as guide, family, library, it is generally true that the there is a correct perception about the point what map serves in general. It is also observed that there are also students who are trying to explain the map concept with metaphors that have no interest, and these metaphors are not classified. According to the data, it was observed that students couldn’t explain the metaphors that were not classified in their statements. Although CBS (Geographical Information Systems) is emphasized in curriculum, it is noteworthy that students have not expressed anything about this topic. In addition, it is seen that it is not expressed anything on the subject of which information will be obtained by using the maps.
In conclusion, the data of this study clearly show that; metaphors can be used as a powerful tool in understanding, revealing, and explaining the perceptions that secondary school students have about the concept of map.
Page 244
• Maps need to be rescued from student’s seeing them as a tool that is for finding space only which is the result of rote-learning based education system. In this context, it seems that students need to take practical courses on maps.
• It is necessary for the students to be informed about what information can be reached through the maps.
REFERENCES
Aydın, F. (2010). Secondary School Students’ Metaphors about the Geography Concept. Educational Sciences: Theory & Practice, 10 (3), 1313-1322.
Aydın, F. (2011). The Metaphoric Perceptions of University Students towards “Environment” Concept. Eastern Geographical Review, 16 (26), 25-44.
Aydın, F. & Eser Ünaldı, Ü. (2010). The Analysis of Geography Teacher Candidates’ Perceptions towards “Geography” Concept with the Help of Metaphors. .International Online Journal of Educational Sciences, 2 (2), 600-622.
Aydın, İ. S. & Pehlivan, A. (2010). The Metaphors That Turkish Student Teachers Use Concerning "Teacher" and "Student" Concepts. Turkish Studies, 5 (2), 818-842.
Coşkun, M. (2010). The Mental Images (Metaphors) of High School Students about “Climate” Concept. Turkish Studies, 5 (3), 919-940.
Demir, İ. (2007). Identity constructions of youth: A qualitative study on diverse localities, doctoral thesis, Istanbul University Institute of Social Sciences, İstanbul.
Demiralp, N. (2009). Geography Education through Maps. Journal of Turkish Educational Sciences, 7 (4), 955-973.
Forceville, C. (1994). Pictorial Metaphor in Advertisements. Metaphor and Symbolic Activity, 9(1), 1-29.
Forceville, C. (2002). The identification of target and source in pictorial metaphors. Journal of Pragmatics, 34(1), 1-14.
Kartal, F. & Koç, H. (2017). Examination of Map Literacy Levels Of Secondary Levels Students (9th Grade) in Terms of Certain Variables. Eastern Geographical Review, 22 (37), 179-198.
Kızılçaoğlu, A. (2007). Harita Becerilerine Pedagojik Bir Bakış. Selçuk Üniversitesi Sosyal Bilimler Enstitüsü Dergisi, 18, 341-358.
Marton, F. (2005). Phenomenography: A Research Approach to Investigating Different Understandings of Reality. (Editor: Robert R. Sherman ve Rodman B. Webb). Qualitative Research in Education: Focus and Methods. London/New York: RoutledgeFalmer.
Miles, M. B. ve Huberman, A. M. (1994). Qualitative Data Analysis: An Expanded Sourcebook (Second Edition) Thousand Oaks, California/ London /New Delhi: SAGE Publishing.
Özgüç, N. & Tümertekin, E. (2000). Coğrafya: Geçmiş, Kavramlar, Coğrafyacılar. İstanbul: Çantay Publishing.
Presmeg, N. (1998). Metaphoric and metonymic signification in mathematica. Journal of Mathematical Behavior, 17 (1), 25-32.
Saban, A. (2002). Prospective Classroom Teachers’ Most Remembered and Most Preferred Metaphors About Elementary Schooling. Educational Sciences and Practice, 1 (2), 211-223.
Page 245
Saban, A. (2008a). Metaphors about School. Educational Administration: Theory and Practice, (55), 459-496.
Saban, A. (2008b). Primary School Teachers’ and Their Students’ Mental Images about the Concept of Knowledge. Elementary Education Online, 7 (2), 421-455.
Saban, A.; Koçbeker-Eid, N. & Saban, A. (2014). Racing in the Marathon or Traveling to a Mysterious Place: Prospective Primary Teachers’ Conceptions of Experienced and Ideal Learning. Educational Sciences: Theory & Practice, 14 (3), 995-1030.
Turkish Language Association (TDK). (2017). Contemporary Turkish Dictionary. <http://www.tdk.gov.tr/index.php?option=com_gts&arama=gts&guid=TDK.GTS.58f4a127a1db40.93 196474> (viewed 19/07/2017).