https://doi.org/10.5194/esd-8-639-2017
© Author(s) 2017. This work is distributed under the Creative Commons Attribution 3.0 License.
A wind proxy based on migrating dunes at the Baltic
coast: statistical analysis of the link between wind
conditions and sand movement
Svenja E. Bierstedt1, Birgit Hünicke1, Eduardo Zorita1, and Juliane Ludwig2 1Institute of Coastal Research, Helmholtz-Zentrum Geesthacht, Geesthacht, Germany
2Institute for Geology, University of Hamburg, Hamburg, Germany Correspondence to:Svenja E. Bierstedt ([email protected])
Received: 14 December 2016 – Discussion started: 16 December 2016 Revised: 21 April 2017 – Accepted: 5 June 2017 – Published: 17 July 2017
Abstract. We statistically analyse the relationship between the structure of migrating dunes in the southern Baltic and the driving wind conditions over the past 26 years, with the long-term aim of using migrating dunes as a proxy for past wind conditions at an interannual resolution.
The present analysis is based on the dune record derived from geo-radar measurements by Ludwig et al. (2017). The dune system is located at the Baltic Sea coast of Poland and is migrating from west to east along the coast. The dunes present layers with different thicknesses that can be assigned to absolute dates at interannual timescales and put in relation to seasonal wind conditions. To statistically analyse this record and calibrate it as a wind proxy, we used a gridded regional meteorological reanalysis data set (coastDat2) covering recent decades. The identified link between the dune annual layers and wind conditions was additionally supported by the co-variability between dune layers and observed sea level variations in the southern Baltic Sea.
We include precipitation and temperature into our analysis, in addition to wind, to learn more about the de-pendency between these three atmospheric factors and their common influence on the dune system. We set up a statistical linear model based on the correlation between the frequency of days with specific wind conditions in a given season and dune migration velocities derived for that season. To some extent, the dune records can be seen as analogous to tree-ring width records, and hence we use a proxy validation method usually applied in dendrochronology, cross-validation with the leave-one-out method, when the observational record is short. The revealed correlations between the wind record from the reanalysis and the wind record derived from the dune structure is in the range between 0.28 and 0.63, yielding similar statistical validation skill as dendroclimatologi-cal records.
1 Introduction
Climate change may induce changes in wind conditions at all timescales, ranging from multi-decadal trends to changes in the daily and seasonal variability including wind extremes (see Christensen et al., 2015). For the Baltic Sea region, wind is the natural hazard with the highest damage potential to cause economic and human losses. Furthermore it can lead to storm surges and high Baltic Sea levels, which can increase the damage potential (Rutgersson et al., 2015; Hünicke et al., 2015). To estimate future wind changes, it is essential to
un-derstand what and how wind conditions in the past were in-fluenced (Feser et al., 2015; Rutgersson et al., 2015).
records (Franzén, 1991; Chaverot et al., 2008), which are likely not totally consistent due to instrumental changes or relocations. Other studies have used meteorological reanaly-sis, which should in principle be less strongly affected by the potential inhomogeneity problem of pure observations (e.g. Gulev et al., 2001; Wang et al., 2006). These studies have come to different conclusions about past wind changes; de-pending on the analysed time span, they report negative or positive trends in storm activity. To verify model results or to cover a longer time span than available with observations, proxy data may be a reasonable alternative. Proxy-based re-constructions of wind conditions may offer the advantage of better temporal homogeneity over long periods compared to observational records, for which changes in the location of the measuring device may result in very large abrupt artifi-cial changes in the mean wind and wind variability (Krueger, 2014). There are already wind analyses using pressure mea-surements as a wind proxy to take advantage of the more homogeneous properties of pressure readings over time (e.g. Alexandersson et al., 2000; Krueger et al., 2013). Other stud-ies try to infer information for past wind events from docu-mented damage to dykes (De Kraker, 1999) or forests (Nils-son et al., 2004). In addition, dune-based records may help to fill spatial gaps in observational data sets, which might be of special interest for analyses of a changing wind climate.
In contrast to other meteorological parameters like temper-ature or precipitation, there is a dearth of wind proxy records capable of reflecting changes in past wind regimes. Any new proxies, however imperfect, can be very useful in this regard. Coastal dunes are affected by several meteorological pa-rameters, including wind, temperature, and precipitation, and therefore their structure may contain information about changes in these atmospheric parameters (Lancaster, 1994). Recently, Ludwig (2017) presented a new proxy for annual wind field variations based on a composite barcode of a dune system along the shore of the Polish Baltic Sea close to Łeba. This barcode reflects the width of different dune layers that are annually formed. These dunes migrate through wind action, and in the processes of migration alternating layers with varying sediment and grain size properties are formed. These layers therefore contain information about how the dune structure responded to past wind conditions. Since wind conditions present an annual cycle, the dune layers can be annually dated. These varying sediment properties can be seen as analogous to tree-ring width records, which may also include information about changing climate conditions (Gi-rardi, 2005). Comparable dune systems can also be found at other coasts, e.g. at the Curonian spit (Lithuania) where the alternating dune structure was also interpreted as a result of the winnowing of lighter quartz grains due to higher wind speeds (see Sect. 2.1.2; Buynevich et al., 2007).
The potential of dunes to provide information about storminess has already been demonstrated (Clemmensen et al., 2014; Costas, 2013), but existing studies have used the connection between dune structure and wind only at a
decadal or millennial temporal resolution. The reconstruc-tion by Ludwig (2017) is the first attempt to use dunes as wind proxies at a seasonal to annual resolution.
This present study statistically analyses the link between this new proxy record and wind conditions in more detail in order to evaluate and calibrate the potential to reconstruct past wind conditions by comparing the new proxy record with meteorological reanalysis data. Meteorological reanaly-sis is a data product constructed by combining weather in-formation (e.g. surface weather stations and satellites) for past weather observations and a meteorological forecast model. These simulations assimilate the available observa-tional records to produce a gridded, spatially and temporally complete model data set of many atmospheric and oceanic variables with a temporal resolution of a few hours (Dee et al., 2015). Due to their use of observations, the time span covered by reanalysis is also limited. On the other hand, the connection to observations may be advantageous because meteorological reanalysis data aim to track real observational data, in contrast to free-running model simulations that do not include data assimilation. However, extracting reliable trends from long-term reanalysis data, e.g. 20CR (Compo et al., 2011), is complicated (Krueger et al., 2013) due to the different number of assimilated stations over time that are continuously included through the simulation period. Dune records may therefore pose a good opportunity to obtain ho-mogeneous wind records spanning longer periods.
Here, we study the statistical relationship at interannual timescales between mean seasonal wind conditions and the annual dune layers, and assess the relationships between the reconstructed and actual wind characteristics derived from the reanalysis with a focus on wind direction and speed. We include precipitation and temperature into our analysis to learn more about the dependencies of these three atmospheric factors and their influence on the dune system. Unfortunately, the period covered by this dune system is rather short, from 1987 to 2012. We consider this analysis relevant for the pa-leoclimate community as a proof of concept to derive wind proxies once longer dune records with annual resolution be-come available. Hence, this analysis could be applied to other dune systems which are bigger and/or move more slowly, e.g. at the Curonian spit.
This paper is structured as follows: Sect. 2 describes the analysed reanalysis data and the Łeba dunes. Section 3 ex-plains the statistical methods. Section 4 presents the results. A discussion of the results and a conclusion closes the paper.
2 Data and area
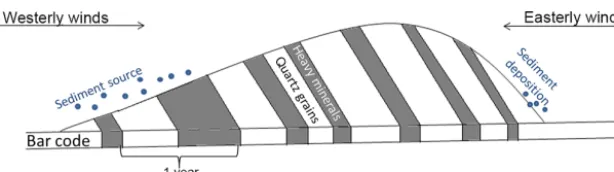
Figure 1.Schematic representation of the Łeba dune structure (adapted from Ludwig et al., 2017).
2.1 Łeba dunes
The active dune system in Łeba (Poland) covers an area of 5.5 km2 and is situated on top of a barrier that separates Łebsko Lake from the Baltic Sea. To the north, pine trees and foredunes prevent sediment supply from the beach from reaching the proper dune system; hence, the material that forms the dune is self-contained with little contamination from outside the system. Public entry has been prohibited since 1967.
The barchanoid dunes are up to 600 m long and 27 m high. The sands are fine grained (with a diameter of 0.2 to 0.3 mm; Ludwig et al., 2017) and well sorted and the dunes attain an average migration velocity of around 10 m yr−1. This dune system has been analysed before by Borówka (1979, 1980, 1995) and Borówka and Rotnicki (1995). These authors have also mentioned the climatological characteristics of this area, which will be briefly recapped and compared to our own re-sults in the following subsection. Additionally, an overview of their results and the results from Ludwig et al. (2017) re-garding the relation of wind and this dune structure will fol-low.
2.1.1 Climatological characteristics
Due to its west–east alignment, the dune migration is strongly connected to westerly winds (Borówka, 1980), which are most frequent and strongest during winter and au-tumn. Westerly winds transport the sand from the luff side (west) of the dune to the lee side (east) of the dune and con-tribute to the eastward movement of the dune (Fig. 1). Hence, the stronger or more frequent the westerly winds are, the more sand is transported to the lee side of the dunes, which also results in a higher dune migration velocity.
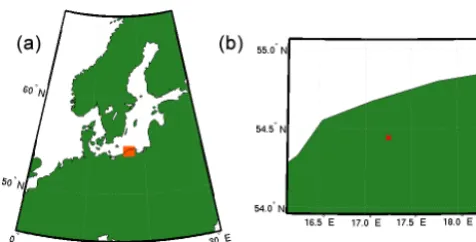
In addition to wind, temperature and precipitation have an influence on the Łeba dune migration; e.g. frost and precipi-tation might stabilise the dune and hinder the sand transport. Borówka (1980) reported the mean annual total precipitation in the research area to be about 700 mm with a maximum oc-curring in summer and autumn. Furthermore, he stated that the area undergoes only small annual temperature variations. From coastDat2 within the period 1948–2012, we calculated a mean annual precipitation amount of about 630 mm and the seasonal mean (standard deviation) temperatures: win-ter−1.6◦C (1.7◦C), spring 5.4◦C (0.9◦C), summer 15.7◦C
(0.7◦C), and autumn 7.9◦C (1.2◦C). These are averaged over the area and shown in the right panel of Fig. 2. The Baltic Sea area shows a predominance of westerly and south-westerly winds for all seasons with a secondary maximum for north-easterly winds during spring for mean and extreme wind speeds (Bierstedt, 2015). Similar main features of the local wind climate were obtained by Ludwig (2017) and Ludwig et al. (2017) with observational data from one station located close to the dunes.
2.1.2 Coastal dunes as an archive of seasonal wind intensity
The dune sands are characterised by alternating changes in the sediment composition. The dune structure shows lay-ers dominated by light quartz grains and laylay-ers with inter-spersed deposits of heavy minerals. This structure is caused by seasonally changing wind conditions (Borówka, 1980). The quartz layer consists predominately of quartz grains with dispersed heavy minerals. Quartz grains and heavy miner-als are mobilised along the luff side of the dune and trans-ported to the east by westerly winds, which are stronger and occur more frequently during autumn and winter. In con-trast, winds from the east winnow quartz grains, as revealed by Borowka’s observations of the Łeba dunes, leaving en-riched heavy minerals behind. This gives rise to an alternat-ing structure of layers that can be investigated with the help of ground-penetrating radar (GPR).
Ludwig et al. (2017) showed that a quartz-dominated layer and a layer enriched in heavy minerals represent a whole year. This alternating pattern is termed a sedimentary bar-code (Fig. 1). The thickness of the individual bars varies from year to year. The link between layer thickness and wind is not linear, as grain mobilisation requires wind speed to surpass a certain threshold. Ludwig et al. (2017) estimated this thresh-old to be 4.4 m s−1for the finest dry sands and 10 m s−1for
Figure 2.Location of the investigation area.(a)The red box marks the analysed gridded wind information from coastDat2 (1987– 2012).(b)The analysed area with the dune location (red x) close to Łeba, Poland.
field. Two dendrochronological methods were applied: repli-cation and cross-dating.
Annual variations in the barcode thickness, and hence in the migration rates, correlate with changing west wind inten-sities. A comparison between a wind record from a station lo-cated near the sample site and the barcode thickness showed that during years with strong west winds the net dune progra-dation to the east is faster than during years with weaker west wind intensities. The barcode record covers a time period of 26 years from 1987 to 2012.
In this study, we provide a more detailed statistical analy-sis of the link between the dune structure and wind conditions by investigating the seasons and wind directions for which the dune structure can be considered more representative of the wind conditions. We also estimate optimal wind thresh-olds from the data, provide a quantification of wind variance that can be derived from the dune records, and provide uncer-tainty ranges when the dune records were used to reconstruct past wind variability.
2.2 Meteorological data
For the main investigation, wind data from the regional mete-orological reanalysis data set coastDat2 (Geyer, 2014) were used. The data set covers the period from 1948 onwards, and thus spans a period with an almost stable number of observa-tions. Hence, it can be considered largely homogeneous.
CoastDat2 is a result of a regional climate simulation with the non-hydrostatic operational weather prediction model COSMO-CLM in CLimate Mode (Rockel and Hense, 2008) driven by meteorological initial and boundary conditions from the global low-resolution NCEP/NCAR Reanalysis 1 data (1948–present; T62, 1.875◦≈210 km, 28 levels; Kalnay et al., 1996; Kistler et al., 2001). The regional simu-lation covers Europe and was conducted by applying spectral nudging (after von Storch et al., 2000). It has a spatial resolu-tion of 0.22◦and the output is available hourly. However, the information derived from the dunes cannot provide such high
temporal resolutions; hence, we decided that daily averaged data are sufficient.
Weidemann (2014) compared the measured wind condi-tions at three German coastal stacondi-tions (Kiel, Warnemünde, Cape Arkona) with the COSMO-CLM model output. He reported a slight systematic overestimation of wind speed, but good agreement regarding daily mean wind speeds and generally acceptable results regarding the daily wind speed variability. However, high wind speeds tend to be underes-timated. He stated that some discrepancies might be intro-duced by the COSMO-CLM model, but other differences be-tween the model and the observations might be due to in situ measurement errors. Other errors may occur due to the im-perfect forcing data set NCEP and its coarse spatial resolu-tion.
Although meteorological reanalyses track observations, it can be argued that they are still a model product. Unfor-tunately, the joint analysis of the dune layers and observed winds is hampered by the lack of direct nearby observations in this area. Although there is a weather station close to the analysed dunes, this station is located in the woods, which compromises information, especially about north-western winds (Ludwig et al., 2017). To verify our reanalysis-based results with real observations, we resort to other observations that are known to be related to seasonal wind conditions in the Baltic Sea and compared the observed coastal sea level data from various stations across the Baltic Sea with dune layer thickness. Variations in the sea level of the Baltic Sea are strongly driven by surface winds (Hünicke et al., 2015), especially in autumn and winter, and hence can also be seen as a good proxy regarding wind in this region.
The relationship between wind properties and sand mi-gration may additionally be dependent on other atmospheric parameters, like precipitation and temperature. We used the daily mean 2 m temperature from coastDat2 and the daily sum of total precipitation from coastDat2, which includes convective and large-scale precipitation as well as snow. The results were also confirmed with precipitation data provided by the Climate Research Unit (CRU; Mitchell and Jones, 2005). This latter gridded data set is the result of a spatial interpolation of station data. The obtained results were found to be similar (not shown).
3 Statistical methods
un-known, so different thresholds have been considered as a free parameter to find an optimal relationship between wind con-ditions and the dune barcode. We also use eight wind direc-tion subdivisions (north, N; north-east, NE; east, E; south-east, SE; south, S; south-west, SW; west, W; north-west, NW) of 45◦each to derive conclusions on the dune-driving wind directions. A finer division is not advisable due to the limited length of the records and to avoid an insufficient sam-ple size.
We set up a linear regression model in which the indepen-dent variable is the migration velocity of the white, black, and combined layers derived from the layer thickness. The dependent variable is the number of days with daily wind means from a certain direction and above a predefined wind speed threshold. In this way we identified the leading rela-tionships between the white and black bars (predictory) and the different combinations of wind direction and wind speed (predictandey). This model is tested and statistically validated with the help of cross-validation, namely the leave-one-out method (Michaelsen, 1987; Birks, 1995). This statistical val-idation technique is commonly used for dendrochronological analysis to investigate the linear relation between tree-ring width and temperature when the temperature record is short. The leave-one-out method addresses the problem of a too-short record of observations that does not leave enough un-used independent data for statistical validation once all data have been used to calibrate the statistical model. In this study, all observations except one are used to estimate the free sta-tistical parameters. The calibrated stasta-tistical model is then used to estimate the value of the predictand for the left-out observation, which is then compared to that of the real ob-servation. A complete loop over all observations is then con-ducted in which only one observation is not included at each step in the calibration of the statistical model. In the end, a measure of the statistical skill is obtained as an average of the mismatch between the estimated and observed values of the predictand at each “left-out” time step. In our case, this means that 1 of the available 26 predictor values (bar thick-ness) is successively left out and the remaining 25 values are used to “predict” the corresponding days per wind direction over a predefined wind speed threshold (predictand). In the end we have 26 predicted wind condition values (ey), which can be compared to the actual values (act(y)) derived from coastDat2. We assess the statistical skill with the help of both the root mean square error (RMSE; Eq. 2), which can be used to determine the explained variance (RMSE2), and the corre-lation coefficient between the predictand and the actual val-ues.
Due to the described winnowing effect of easterly winds (see Sect. 2.1.2), we additionally investigated the idea of an optimal ratio between the number of westerly and easterly winds which promotes the thickness of black layers. The idea is that a smaller or a larger ratio would produce thinner or thicker black layers. For this, we need to identify a non-linear link between this ratio and the layer thickness. We use a
lo-cal regression (loess regression), where lolo-cal means that the regression is based only on a set of observational data points (x, y) that lie within a certain limited region in anx–y plot. The value of the parameters for the statistical model thus de-pends on the value of the predictor and predictandx, y. The statistical models used in this analysis are weighted linear least squares and a second-degree polynomial model. This local regression is equivalent to finding a local and second-degree polynomial that better fit the (x–y) data points. The width of the loess window is optimised with the lowest root mean square error after the leave-one-out method:
eyi=p1i∗yi+p2i, (1)
RMSE=1
n v u u t n X
i=1
(acti(y)−eyi)
2. (2)
4 Results
Before we applied the linear regression model to identify a relationship between dune migration and wind conditions, we analysed the connection between the dune movement and other atmospheric parameters. The following section is de-voted to the correlation between the migration velocities of the white and black layers and temperature, precipitation, and wind. Later, we explain the results concerning the linear re-gression model between the migration velocity and wind for a specified direction and speed threshold.
4.1 Dune migration velocity and meteorological forcing
Quartz-dominated layers (white) have a mean thickness of 6.37 m. The layers characterised by heavy minerals (black) show an average thickness of 6.15 m. The succession of white and black layers corresponds to the annual cycle in the meteorological characteristics, and this allows for the dating of each pair of layers. In the study area, the time period cov-ered by the layers formed in the dunes is 1987–2012.
temperature also shows relations with the dune layer thick-ness. Autumn is the only season showing a non-negligible, albeit not significant, correlation for black layers (r=0.33;
p=0.09). Hence, in autumn, sand movement has a slight tendency to be faster with higher temperatures. The other seasons reveal no correlation between temperature and bar thickness.
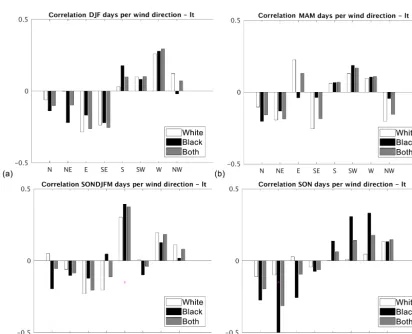
The joint impact of temperature and precipitation might play a role, especially during the winter season. It is as-sumed that low temperatures, below zero, together with pre-cipitation stabilise the dunes and thus hinder the sand trans-port. To consider this effect, we analysed the correlation be-tween wind conditions (number of days per wind direction) and sand movement by excluding or including days with frost and precipitation. The biggest differences can be seen in winter (compare Figs. 4a and 3a), with some differences in spring (compare Figs. 4b and 3b) and none in summer and autumn (not shown). Winter and spring show the same correlation sign with and without frost days, but some cor-relations are higher for days without frost and precipitation. In spring, higher correlations can be seen for northern and eastern winds, but changes are still quite small. For win-ter, the correlation coefficients are lower (higher) without frost and precipitation, especially for white (black) bars and E (SE) winds. Autumn still has the highest correlations be-tween wind properties and bar thickness. Conditional on the shortness of the record, temperature and precipitation may therefore have a small additional effect on the link between wind and the dune barcode.
Wind
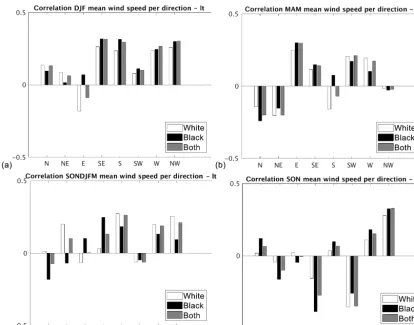
The analysis of the relationship between wind conditions and layers is based on wind intensity per wind direction. The lat-ter is divided into eight subdivisions (N, NE, E, SE, S, SW, W, and NW). The wind condition is defined by applying two measures: (1) the mean wind speed for each direction (cal-culated only in the days with mean wind from that particular direction) and (2) the number of days with a specific wind direction. The correlations between white, black, and com-bined bar thicknesses and these two wind condition measures are shown in Figs. 4 and 5. Comparing the results for both measures for the windy season SONDJFM (see Figs. 4c and 5c) showed no strong correlations, except for S winds with the number of days.
Because one goal of our analysis was to statistically val-idate the proxy on a seasonal timescale, the following re-sults are focused on the four seasons defined above. The correlation coefficients reveal summer as the least effective season for sand transport regardless of the definition of the wind condition. For the other seasons, there are some differ-ences depending on the definition of wind conditions used. In spring we only see noticeable correlations for E winds for the black layer using the mean wind speed definition (r≈0.3). The mean wind speed from E apparently has an influence on
the thickness of the black layer. The number of days from a particular wind direction seems to be less effective in spring than the mean wind speed. This is an interesting result, as it is an indication of the winnowing of white and black grains as already mentioned by Borówka (1979). In winter, the link between dune layers and wind clearly depends on the defini-tion of the wind condidefini-tion. The layer thickness is positively correlated with mean wind speed for almost all wind direc-tions and layers. However, the sign of the correlation coef-ficient between the layer thickness and the number of days with winds from particular directions varies, with the east-ern and northeast-ern wind directions showing negative correla-tions and the western and southern wind direccorrela-tions showing positive correlations. The alternating sign of the relevant cor-relation coefficient can also be seen for autumn, especially for the black layer. Hence, in autumn and winter the strong winds prevent the winnowing effect described in the intro-duction. In these seasons the wind speed of easterly winds seems to be high enough to erode not only the lighter white material but also the black heavy minerals. Autumn is the season with the highest correlations for both measures and both bars, pointing to this season as the most important for sand transport.
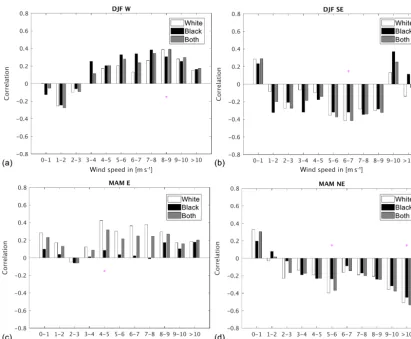
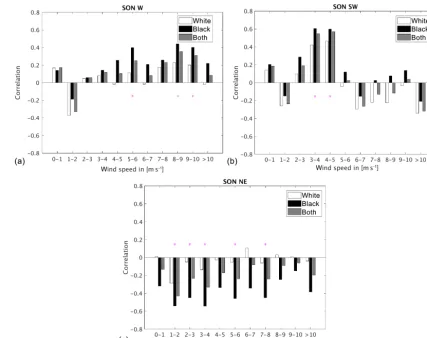
As a next step, we analyse the number of days with a spe-cific wind direction which show mean wind speeds over a predefined wind speed threshold to connect the two mea-sures. The wind speed is binned into 10 groups ranging from 0 to>10 m s−1(0–1, 1–2, ...,>10 m s−1). The wind direc-tions with non-negligible correlation coefficients (abs(r)>
0.4) are E and NE during spring (Fig. 6c and d), W and SE during winter (Fig. 6a and b), and W, SW, and NE during au-tumn (Fig. 7). The correlation coefficients in summer and in the other wind directions are predominantly low (not shown). In spring (winter) there are positive correlation coefficients for E (W) winds and negative coefficients for NE (SE) winds. Concerning the variations in the wind speed threshold, both winter and spring show higher correlations for wind speeds above 4 m s−1. In autumn the correlations are highest for a threshold of 8 m s−1 for NE winds for the black layer with a negative sign. There are high positive correlations for a threshold between 3 and 5 m s−1for SW winds and for a threshold of 5 m s−1for W winds.
4.2 Linear regression
ve-Figure 3.Correlation coefficients between the number of days per wind direction without frost and precipitation days, and the dune thickness (lt-layer thickness) of the white layer (white), black layer (black), and both together (grey). The correlations are shown for the seasons winter (DJF) and spring (MAM) and for the eight wind directions.
Figure 5.Correlation coefficients between the mean wind speed and the dune thickness (lt-layer thickness) of the white layer (white), black layer (black), and both together (grey). The correlations are shown for winter (DJF), spring (MAM), the windy season (SONDJFM), autumn (SON), and the eight wind directions.
Table 1.Correlation, root mean square error, and explained variance values (obtained with leave-one-out validation) used to compare pre-dicted and actual number of days per wind direction. The prediction is based on dune layer thickness, which is identified to have a linear relation with SW winds between 3 and 5 m s−1. The correlations marked with∗are significant at the 95 % level. The last two columns show the slope and intersect of the linear regression between SW winds and layer thickness if no LOOM is applied.
Correlation RMSE Exp. variance Slope Intersect
SW White 0.28 1.93 8.07 % 0.37 4.22
Black 0.63* 1.56 39.21 % 0.86 1.26
Both 0.52* 1.70 27.16 % 0.33 2.44
locity (predictor) and its linear relation to the number of days with SW wind with the above-mentioned wind speed (pre-dictand). The leave-one-out method allows for the statistical validation of this relation by comparing the predictand with the actual number of days per wind direction. Table 1 shows the correlation coefficients between the predicted and actual values, the root mean square error, and the explained variance of this analysis.
The highest correlation values are obtained for SW winds, which is likely due to the wind speed threshold being more strictly defined, e.g. compared to W winds (>5 m s−1). With
these threshold values, the correlation between migration ve-locity and number of days per wind direction is higher (com-pare Fig. 7a and b). However, one has to keep in mind that a higher wind speed threshold (3–5 m s−1) excludes many ob-servations. This validation of the regression model to predict SW winds from the dune layers shows results that are similar to accepted validation values in dendrochronological analy-ses.
Figure 6.Correlation coefficients between the number of days per wind direction in a specified range of wind speeds and the dune thickness of the white layer (white), black layer (black), and both together (grey). The correlations are shown for winter (DJF;aandb) and spring (MAM;candd) for the W(a), SE(b), E(c), and NE(d)wind directions. The correlations marked with∗are significant at the 95 % level.
black sands are transported together eastward by westerly winds, and this explains the positive correlation between the thickness of the black layers and the number of days with W and SW winds. On days with easterly winds, which are usu-ally weaker than westerly winds, only the white lighter par-ticles are transported to the back of the dune, enriching the black layer. This explains the negative correlation between the number of days with E and NE winds and the thickness of the black layer.
This idea of winnowing was already explained by Borówka (1979) for the Łeba dunes. Easterly winds winnow only the lighter white grains and transport them backwards to the west; hence a black layer forms. This effect suggests that there might be an optimal ratio of days with west and east winds per year that results in a thicker black layer. The presence of such an optimal ratio implies a non-linear re-lationship between this ratio and the thickness of the black layer.
To test this hypothesis we use a scatterplot between the dif-ference in the number of days with west (W, SW, and NW) and east (E, SE, and NE) winds during all seasons and the
black layer thickness per year (see Fig. 8). The data points are smoothed with a loess filter (red line in Fig. 8). If an opti-mal ratio between east and west existed, the smoothed curve would show a clear maximum. Our result does not show this maximum, and therefore no clear optimal ratio can be de-rived. Nevertheless, there seems to be a minimum value of this ratio (≈4500) under which the black layer tends to be small.
4.3 Baltic Sea level and dune layers
Our results so far are based on wind data from reanalysis data. These are derived data produced by a combination of a numerical model and observations (see Sect. 2.2). The rea-son for not using the wind data from the neighbouring station for the calibration and verification of our analysis is the men-tioned potential inhomogeneities of such data sets. In particu-lar, the closest meteorological station in this region is located close to a forest.
Figure 7.Correlation coefficients between the number of days per wind direction in a specified range of wind speeds and the dune thickness of the white layer (white), black layer (black), and both together (grey). The correlations are shown for autumn (SON) for the W(a), SW (b), and NE(c)wind directions. The correlations marked with * are significant at the 95 % level.
Figure 8.Scatterplot of the difference between the number of west-erly (W, SW, and NW) and eastwest-erly (E, SE, and NE) winds and the black layer thickness. The red line shows the smoothing with a loess filtering (see Sect. 3).
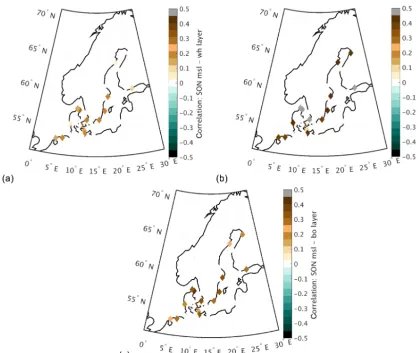
Figure 9.Spatial maps of correlation coefficients between the mean sea level data from Baltic coastal stations and the dune layer thickness during autumn (SON) for(a)the white layer,(b)the black layer, and(c)both layers combined.
movement, the sea level time series have first been detrended. Positive correlations between the autumn (SON) Baltic Sea level and dune layer thickness are found for most tide gauges. The sign of this correlation is also consistent with the idea that strong westerly winds generally cause thicker dune lay-ers. In addition, the correlation patterns display higher corre-lations at tide gauges that are located closer to the dune site and lower correlations for tide gauges located further apart. The only plausible explanation for this spatial pattern of cor-relations between coastal sea level variations and the thick-ness of dune layers is that both variables, sea level and dune thickness, are partially driven by the common wind forcing described above. Therefore, this strengthens our results de-rived from the reanalysis data set coastDat2.
5 Discussion and conclusion
Our analysis provides more quantitative support for the mi-grating coastal dunes identified by the geological analysis of Ludwig et al. (2017) as a wind proxy at interannual timescales. To statistically validate this wind proxy against
wind observations, we chose to use a reanalysis data set in-stead of data from a meteorological station. There are two main reasons for this choice. One is that the main applica-tion of our study is the reconstrucapplica-tion of wind condiapplica-tions that may have a wider spatial representativity than station data. Climate reconstructions will eventually be compared with climate model simulations, which have a spatial resolution similar to reanalysis, and therefore it is more convenient for this purpose to ensure the statistical link between the proxy record and regional, as opposed to pointwise, wind data. This allows for a larger-scale reconstruction than the observational data from one station used by Ludwig et al. (2017) to identify the wind proxy. A second reason is that data from only one station can be affected by inhomogeneities in time and also by local conditions, like the presence of forest, and hence may not be representative of the wind conditions forming the dunes. Ludwig et al. (2017) also state that some wind direc-tions seem to be under-represented in the station data due to the station position behind trees.
between observed Baltic Sea level data and dune layer thick-ness during autumn (SON). Hünicke et al. (2008) stated that wind is the main driver of interannual Baltic Sea level vari-ations; hence there should be a direct link between the two parameters. The Baltic Sea level can therefore be seen as a good proxy for wind variability in the Baltic Sea region. The derived correlation coefficients showed a clear positive link between dune layer thickness and Baltic Sea level across the whole Baltic region and thus a clear positive link to wind as well. On the one hand, this positive link to sea level can be very useful as sea level data go further back in time than reanalysis data. On the other hand, it confirms the relation-ship between wind and dunes identified in our study derived with the reanalysis coastDat2, which makes the results more robust.
The analysed dunes at the Polish Baltic Sea coast are char-acterised by alternating white and black bars representing light quartz grains and heavy minerals. These bars might be regarded as analogous to tree-ring width records. The anal-ysis of the composite dune records was conducted similarly to dendrochronological methods. Hence, the chosen statisti-cal validation technique is also a common tool to verify the relation between tree-ring width and temperature when the instrumental records are too short.
We investigated the relationship between bar thickness and the atmospheric parameters precipitation, temperature, and wind. The focus lies on the relation to wind conditions be-cause wind is assumed to actually transport the sand grains. However, precipitation and temperature also have an influ-ence on dune migration.
Regarding precipitation, the results showed positive corre-lations between the amount of precipitation and dune layer thicknesses for winter (DJF) and spring (MAM). Borówka (1980) stated that some rain might positively influence the transport due to turbulence, which makes more sand grains available. We argue that the influence of precipitation on sand transport, and hence on the dune processes, depends on the seasonal wind conditions. For example it might be possible that precipitation and wind co-vary, which is especially likely during winter and spring when stronger cyclones come into the Baltic Sea region. Ludwig et al. (2017) describe a sec-ondary dune on top of the primary dune consisting of the white and black layer. These secondary dunes seem to be af-fected by precipitation due to erosion. This idea is supported by our results and shows that in wetter seasons the secondary dunes might be eroded into the primary dune, hence resulting in thicker dune layers.
Due to its west–east alignment the dune is most sensitive to westerly (W, SW) and easterly (E, NE) winds. This re-lationship with wind depends on season and direction. Dur-ing winter and autumn, westerly winds correlate positively with dune layer thickness, whereas the easterly winds cor-relate negatively, more or less independently of wind speed. In spring there are positive correlations for the eastern wind direction for the white layer.
After analysing the influence of meteorological parame-ters on dune migration, we focused on the linear relation-ship of the migration velocity and the frequency of days with SW winds surpassing a specific wind speed threshold. The derived linear relationships were validated with the leave-one-out method due to the limited length of the observa-tional record. This linear model allowed us to hindcast the wind speed from the migration of the dunes over the past decades. The correlations between the observed and recon-structed wind speeds are between 0.28 and 0.63 and are similar to the correlations typically obtained for other cli-matic proxies, e.g. tree rings. As an example, Bräuning and Mantwill (2004) derived correlation values with leave-one-out validation of 0.41 to 0.78. These results lead us to the conclusion that alternating dune structures can be used as wind proxies on annual timescales.
Dunes as wind proxies had already been used before (e.g. Clemmensen et al., 2014), but only at a decadal or millen-nial temporal resolution. Our study therefore statistically val-idates the interpretation by Ludwig et al. (2017) of the dune layers and dune migration velocities as indicators of annual and even seasonal wind conditions. Although the dune sys-tem analysed here covers only a period of 26 years, we sug-gest that the analysis is of relevance for paleoclimate studies since it can be applied to other dune systems covering longer time periods.
Data availability. The coastDat2 reanalysis data are available at https://doi.org/10.1594/WDCC/coastDat-2_COSMO-CLM. The analysed dune data are the result of the study by Ludwig et al. (2017) and are not publicly accessible.
Competing interests. The authors declare that they have no con-flict of interest.
Acknowledgements. This work is a contribution to the Helmholtz Climate Initiative REKLIM (Regional Climate Change), a joint research project of the Helmholtz Association of German Research Centres (HGF). The authors would like to thank Sebastian Lindhorst for explaining dune mechanisms.
The article processing charges for this open-access publication were covered by a Research
Centre of the Helmholtz Association.
Edited by: Anna Rutgersson
Reviewed by: Tarmo Soomere and one anonymous referee
References
Andersson, H. C.: Influence of long-term regional and large-scale atmospheric circulation on the Baltic sea level, Tellus A, 54, 76– 88, 2002.
Bierstedt, S. E., Hünicke, B., and Zorita, E.: Variability of wind direction statistics of mean and extreme wind events over the Baltic Sea region, Tellus A, 67, 29073, https://doi.org/10.3402/tellusa.v67.29073, 2015.
Birks, H. J. B.: Quantitative palaeoenvironmental reconstructions. in: Statistical Modeling of Quaternary Science Data, edited by: Maddy, D., and Brew, J. S., Technical Guide, Quaternary Re-search Association, Cambridge, vol. 5, 161–254, 1995. Borówka, R. K.: Accumulation and redeposition of eolian sands on
the lee slope of dunes and their influence on formation of sedi-mentary structures, Quaestiones Geographicae, 5, 5–22, 1979. Borówka, R. K.: Present day dune processes and dune morphology
on the Łeba barrier, polish coast of the baltic, Geograf. Ann. A, Phys. Geogr., 62, 75–82, 1980.
Borówka, R. K.: Dunes on the Łeba barrier – their history and dynamics of present-day aeolian processes, J. Coastal Res., 22, 247–251, 1995.
Borówka, R. K. and Rotnicki, K.: Balance of the aeolian sand trans-port on the beach and the problem of sand nourishment of the ac-tive dune field on the Łeba barrier, J. Coastal Res., 22, 257–265, 1995.
Bristow, C., P. J. and Goodal, T.: Internal structure of aeolian dunes in Abu Dhabi determined using ground-penetrating radar, Sedi-mentology, 43, 995–1003, 1996.
Bräuning, A. and Mantwill, B.: Summer temperature and sum-mer monsoon history on the Tibetan Plateau during the last 400 years recorded by tree rings, Geophys. Res. Lett., 31, L24205, https://doi.org/10.1029/2004GL020793, 2004.
Buynevich, I. V., Bitinas, A., and Pupienis, D.: Lithological anoma-lies in a relict coastal dune: Geophysical and Paleoenvironmental markers, Geophys. Res. Lett., 34, 1–5, 2007.
Chaverot, S., Hequette, A., and Cohen, O.: Changes in storminess and shoreline evolution along the northern coast of France during the second half of the 20(th) century, Z. Geomorphol., 52, 1–20, 2008.
Christensen, O. B.; Kjellström, E., and Zorita, E.: Projected change – atmosphere, in: Second Assessment of Climate Change for the Baltic Sea Basin, edited by: The BACC II Author Team, Springer International Publishing, Berlin, 217–233, 2015.
Clemmensen, L. B., Andreasen, F., and Nielsen, S. T., and Sten, E.: The late holocene coastal dunefield at Vejers, Denmark: Charac-teristics, sand budget and depositional dynamics, Geomorphol-ogy, 17, 79–98, 1996.
Clemmensen, L. B., Hansen, K. W. T., and Kroon, A.: Storminess variation at Skagen, northern Denmark since ad 1860: Relations to climate change and implications for coastal dunes, Aeolian Research, 15, 101–112, 2014.
Compo, G. P., Whitaker, J. S., Sardeshmukh, P. D., Mat-sui, N., Allan, R. J., Yin, X., Gleason, B. E., Vose, R. S., Rutledge, G., Bessemoulin, P., Brönnimann, S., Brunet, M., Crouthamel, R. I., Grant, A. N., Groisman, P. Y., Jones, P. D., Kruk, M., Kruger, A. C., Marshall, G. J., Maugeri, M., Mok, H. Y., Nordli, O., Ross, T. F., Trigo, R. M., Wang, X. L., Woodruff, S. D., and Worley, S. J.: The Twentieth Century Re-analysis Project, Q. J. Roy. Meteor. Soc., 137, 1–28, 2011.
Costas, I.: Climate Archive Dune, PhD Thesis, Hamburg University, Hamburg, 2013.
De Kraker, A. M. J.: A method to assess the impact of high tides, storms and storm surges as vital elements in climatic history. the case of stormy weather and dikes in the northern part of Flanders, 1488 to 1609, Clim. Change, 43, 287–302, 1999.
Dee, D., Fasullo, J., Shea, D., Walsh, J., and the National Cen-ter for Atmospheric Research Staff (eds.): The climate data guide: Atmospheric reanalysis: Overview & comparison tables, available at: https://climatedataguide.ucar.edu/climate-data/ atmospheric-reanalysis-overview-comparison-tables,(last access: 15 July 2017) 2015.
Ekman, M.: A secular change in storm activity over the Baltic Sea detected through analysis of sea level data, Small Publ. Hist. Geophys., 16, 2007.
Feser, F., Barcikowska, M., Krueger, O., Schenk, F., Weisse, R., and Xia, L.: Storminess over the North Atlantic and northwestern Eu-rope – a review, Q. J. Roy. Meteor. Soc., 141, 350–382, 2015. Franzén, L. G.: The changing frequency of gales on the swedish
west coast and its possible relation to the increased damage to coniferous forests of southern Sweden, Int. J. Climatol., 11, 769– 793, 1991.
Geyer, B.: High-resolution atmospheric reconstruction for Eu-rope 1948–2012: coastDat2, Earth Syst. Sci. Data, 6, 147–164, https://doi.org/10.5194/essd-6-147-2014, 2014.
Girardi, J. D.: A GPR and mapping study of the evolution of an active parabolic dune system, Ms Thesis, Napeague, New York, Stony Brook University, Dept. of Geosciences, 2005.
Gulev, S. K., Zolina, O., and Grigoriev, S.: Extratropical cy-clone variability in the northern hemisphere winter from the NCEP/NCAR reanalysis data, Clim. Dynam., 17, 795–809, 2001.
Hünicke, B., and Zorita, E.: Trends in the amplitude of Baltic Sea level annual cycle, Tellus A, 60, 154–164, 2008.
Hünicke, B., Zorita, E., Soomere, T., Madsen, K. S., Johansson, M., and Suursaar, Ü.: Recent change – sea level and wind waves, in: Second Assessment of Climate Change for the Baltic Sea Basin, Springer International Publishing, Berlin, 155–185, 2015. Jaagus, J. and Kull, A.: Changes in surface wind directions in
Es-tonia during 1966–2008 and their relationships with large-scale atmospheric circulation, Est. J. Earth Sci., 60, 220–231, 2011. Kalnay, E., Kanamitsu, M., Kistler, R., Collins, W., Deaven, D.,
Gandin, L., Iredell, M., Saha, S., White, G., Woollen, J., Zhu, Y., Leetmaa, A., Reynolds, R., Chelliah, M., Ebisuzaki, W., Hig-gins, W., Janowiak, J., Mo, K. C., Ropelewski, C., Wang, J., Jenne, R., and Joseph, D.: The NCEP/NCAR 40-year reanalysis project, B. Am. Meteorol. Soc., 77, 437–471, 1996.
Kistler, R., Kalnay, E., Collins, W., Saha, S., White, G., Woolen, J., Chelliah, M., Ebiszusaki, W., Kanamitsu, M., Kousky, V., van den Dool, H., Jenne, R., and Fiorino, M.: The NCEP/NCAR 50-year reanalysis: Monthly means CD-rom and documentation, B. Am. Meteor. Soc., 82, 247–267, 2001.
Krueger, O., Schenk, F., Feser, F., and Weisse, R.: Inconsistencies between long-term trends in storminess derived from the 20CR reanalysis and observations, J. Climate, 26, 868–874, 2013. Krueger, O.:The Informational Value of Pressure-Based Proxies
Lancaster, N.: Controls on aeolian activity: some new perspectives from the Kelso dunes, Mojave desert, California, J. Arid Envi-ron., 27, 113–125, 1994.
Lehmann, A., Getzlaff, K., and Harla, J.: Detailed assessment of climate variability of the Baltic sea area for the period 1958– 2009, Clim. Res., 46, 185–196, 2011.
Ludwig, J.: Climate Signals in Coastal Deposits, Dissertation, Universität Hamburg, Fachbereich Geowissenschaften, available at: http://ediss.sub.uni-hamburg.de/volltexte/2017/8258/pdf/ Dissertation.pdf, (last access: last access: 15 July 2017), 2017. Ludwig, J., Lindhorst, S., Betzler, C., Bierstedt, S. E.,
and Borówka, R. K.: Sedimentary rhythms in coastal dunes as a record of intra-annual changes in wind cli-mate (Łeba, Poland), Aeolian Research, 27, 67–77, https://doi.org/10.1016/j.aeolia.2017.06.003, 2017.
Matulla, C., Schöner, W., Alexandersson, H., von Storch, H., and Wang, X. L.: European storminess: late nineteenth century to present, Clim. Dynam., 31, 125–130, 2007.
Michaelsen, J.: Cross-validation in statistical climate forecast mod-els, J. Clim. Appl. Meteorol., 26, 1589–1600, 1987.
Mitchell, T. D. and Jones, P. D.: An improved method of construct-ing a database of monthly climate observations and associated high-resolution grids, Int. J. Climatol., 25, 693–712, 2005. Nilsson, C., Stjernquist, I., Bärring, L., Schlyter, P., Jänsson, A. M.,
and Samuelsson, H.: Recorded storm damage in swedish forests 1901–2000, Forest Ecol. Manag., 199, 165–173, 2004.
Reimann, T., Tsukamoto, S., Harff, J., Osadczuk, K., and Frechen, M.: Reconstruction of holocene coastal foredune progradation using luminescence dating – an example from the Swina Barrier (southern Baltic sea, NW Poland), Geomorphol-ogy, 132, 1–16, 2011.
Rockel, B. W. and Hense, A.: The regional climate model COSMO-CLM (CCOSMO-CLM), Meteorol. Z., 12, 347–348, 2008.
Rutgersson, A., Jaagus, J., Schenk, F., Stendel, M., Bärring, L., Briede, A., Claremar, B., Hanssen-Bauer, I., Holopainen, J., Moberg, A., Nordli, O., Rimkus, E., and Wibig, J.: Recent Change – Atmosphere, in: Second Assessment of Climate Change for the Baltic Sea Basin, edited by: The BACC II Author Team, Springer International Publishing, Berlin, 69–97, 2015. von Storch, H., Langenberg, H., and Feser, F.: A spectral nudging
technique for dynamical downscaling purposes, Mon. Weather Rev., 128, 3664–3673, 2000.
Wang, X. L., Swail, V. R., and Zwiers, F. W.: Climatology and changes of extratropical cyclone activity: Comparison of era-40 with NCEP-NCAR reanalysis for 1958—2001, J. Climate, 19, 3145–3166, 2006.