Baghdad Science Journal
Vol.16(1)Supplement 2019
DOI: http://dx.doi.org/10.21123/bsj.2019.16.1(Suppl.).0263
A Study on the Accuracy of Prediction in Recommendation System Based on
Similarity Measures
Nadia Fadhil AL-Bakri
1*Soukaena Hassan Hashim
2Received 24/4/2018, Accepted 16/10/2018, Published 17/3/2019
This work is licensed under a Creative Commons Attribution 4.0 International License.
Abstract:
Recommender Systems are tools to understand the huge amount of data available in the internet world. Collaborative filtering (CF) is one of the most knowledge discovery methods used positively in recommendation system. Memory collaborative filtering emphasizes on using facts about present users to predict new things for the target user. Similarity measures are the core operations in collaborative filtering and the prediction accuracy is mostly dependent on similarity calculations. In this study, a combination of weighted parameters and traditional similarity measures are conducted to calculate relationship among users over Movie Lens data set rating matrix. The advantages and disadvantages of each measure are spotted. From the study, a new measure is proposed from the combination of measures to cope with the global meaning of data set ratings. After conducting the experimental results, it is shown that the proposed measure achieves major objectives that maximize the accuracy Predictions.
Key words: Collaborative Filtering, Inverse User Frequency, Prediction, Recommender System, Similarity Measure.
Introduction:
Recommender systems are tools that utilize the beliefs of a group of users to assist entities in that group to effectively explore new things of interest from a possibly tremendous set of choices. Collaborative Filtering (CF) is being developed for generating recommendations. CF can be categorized into two main algorithms: memory-based and model-based. Memory-based algorithms use the whole user-item database to generate predictions. Similarity measures are employed to find user's neighborhood.
Memory collaborative filtering can be classified mainly into user to user based and item to item based filtering. User-based exploits the relationship between the target user and all other users. Item-based makes use of the similarity between two items. Similarity measure computation depends mostly on user's explicit ratings (users scan items and rate them on a rating scale values). Although explicit rating captures user favorites to items perfectly, its main drawback is sparsity problem due to the vast amount of information in the world (1).
1 Department of Computer Science, AL Nahrain
University, Baghdad, Iraq.
2 Department of Computer Science, University of
Technology, Baghdad, Iraq.
* Corresponding author: [email protected]
In this paper, a study is presented to analyze the results of prediction values with the use of different similarity measures.
In section 2, challenges of collaborative filtering techniques are presented. In section 3, the Related Works on this field are subjected. In section 4, most similarity measures used in CF are presented in a table form. In section 5, the Experimental Results are conducted. The last section is the conclusion of this study.
Challenges
of
Collaborative
Filtering
Techniques
A brief introduction to the challenges that are considered important for the development of the research on recommender systems is introduced:
1- Cold-start problem: This refers to a situation where a recommender does not have adequate information about a user or an item in order to make relevant predictions. This is one of the major problems that reduce the performance of recommendation system.(2)
successful neighbors and, finally, the generation of weak recommendations.(2)
3- Scalability: This is a problem associated with recommendation algorithms because computation normally grows linearly with the number of users and items. It is crucial to apply recommendation techniques which are capable of scaling up in a successful manner as the number of dataset in a database increases.(2)
4- Synonymy: Synonymy is the tendency of very similar items to have different names or entries. Most recommender systems find it difficult to make distinction between closely related items.(2)
5- Gray Sheep: This refers to the users whose opinions do not consistently agree or disagree with any group of people and thus do not benefit from collaborative filtering.(3)
6- Shilling Attacks: It is the case where anyone can provide recommendations; people may give tons of positive recommendations for their own
materials and negative recommendations for their competitors.(3)
7- The Long Tail problem: It is composed of a small number of popular items, the well-known hits, and the rest are located in the heavy tail, those do not sell that well. The Long Tail offers the possibility to explore and discover—using automatic tools; such as (recommenders or personalized filters) vast amounts of data.(4)
8- Diversity: In the recommendation process, the user should be presented with a range of options and not with a homogeneous set of alternatives.(4)
Related Work
In what follows, some of the previous research literatures related to the techniques used in user-based collaborative filtering is presented with employing different data sets. The related works are shown in Table (1).
Table 1. Different Collaborative Filtering Approaches Used in Previous Works with their References
Ref. No.
Authors & Publication Year
Approach Used
Methods And Tools Used
Dataset Used
Problem To Solve
(1)
Abdelwahab, A Et Al.
2009
User-Based And Item-Based Collaborative
Filtering
User-Based And Item-Based Collaborative Filtering +Spectral
Clustering
MovieLens 100 K Book-Crossing
Sparsity
(5)
KG, S., & Sadasivam,G.S.
2017
Memory Based Collaborative Filtering
Modified Similarity Model Jaccard Measure +PSS (Proximity-Significance-Singularity)+Bhattacharya
News Jester Datasets
Sparsity
(6)
Huang, B. H., & Dai B. R.,
2015
Collaborative Filtering Weighted Distance Model(WD)& Jacaard Measure
MovieLens 100K MovieLlens
1M
Prediction Accuracy
(7) Wu, Z.,
Et Al. 2014 Collaborative Filtering
Modified Similarity and Fuzzy Clustering
MovieLens 100K
Sparsity Real-Time
Response Speed
(8)
Katukuri, J., Et Al.
2014
Similarity Measure Clustering Using Hadoop Map
Reduce Ebay.Com
Site
Scalability
(9)
Mao, J., Et Al.
2013
Memory Based Collaborative Filtering
Modified Pearson Correlation Measure By Similarity Impact
Factor.
MovieLens
100k Sparsity
(10)
Anad D. & Bharadwaj K.
2011
Collaborative Filtering & Evolutionary
Automatic Learning Of Weights By Genetic Used In Sparsity Measures
MovieLens Jester Datasets
Sparsity
(11)
Lee, H.C Et Al.
2007
Collaborative Filtering and Content-Based
Filtering
Neighborhood Based Collaborative Filtering Algorithm (NBCFA).
Correspondence Mean Algorithm(CMA)
MovieLens 100k Movielens
1M
Prediction Accuracy
(12)
Lee, S, Et AI. 2004
Collaborative Filtering Discovery Hidden Similarity(DHS) MovieLlens 100k
Sparsity Scalability
Collaborative Filtering Algorithm
The recommender system can be abstracted as a black box to generate suggestions for users. It is constructed from the following steps: (13)
1- Representation of raw data
data set is represented in the form of the User-Movie rating matrix to be further processed.
2- Similarity Computation
It is the most essential stage in the recommendation system because the accuracy of the prediction
process is dependent on this stage. It determines the K-nearest users to the active user. The K users form the neighborhood for the target user. Different similarity measures are depicted in Tables (2, 3).
Table 2. different similarity measures with their specification and disadvantages (5) (14) (15)
Eq.no Similarity
Measure Similarity Measure Formula Specification Disadvantage
1
Cosine (COS)
𝑺𝑰𝑴(𝒖, 𝒗)𝒄𝒐𝒔
= 𝒄𝒐𝒔𝒊𝒏𝒆(𝑹̅̅̅̅ 𝑹𝒖,̅̅̅̅)𝒗
=‖𝑹𝑹̅̅̅̅ ∙ 𝑹𝒖 ̅̅̅̅𝒗
𝒖‖‖𝑹𝒗‖
= ∑ 𝑹𝒖,𝒊× 𝑹𝒗,𝒊
𝑵 𝒊=𝟏
√∑ (𝑹𝒖,𝒊) 𝟐
𝑵
𝒊=𝟏 √∑ (𝑹𝒗,𝒊) 𝟐
𝑵
𝒊=𝟏
Measures the angle between u and v vectors.
If angle equals 0 then cosine Simi- larity =1 and they
are similar. if equals 90 then cosine similarity =0 and they are not
similar.
Cosine similarity does not account for the preference of the user’s
rating.
2
Pearson correlation coefficient (PCC)
𝑺𝑰𝑴( 𝒖, 𝒗)𝒑𝒄𝒄
= ∑ (𝑹𝒊∈𝑰 𝒖,𝒊− 𝑹̅̅̅̅)(𝑹𝒖 𝒗,𝒊 − 𝑹̅̅̅̅)𝑽 √∑ 𝒊∈𝑰 ( 𝑹𝒖,𝒊− 𝑹̅̅̅̅)𝒖 𝟐 √∑ 𝒊∈𝑰( 𝑹𝒗,𝒊− 𝑹̅̅̅̅)𝑽 𝟐
The Pearson correlation coefficient takes values from +1 (strong positive correlation) to −1 (strong
negative correlation). The Pearson algorithm
makes use of negative correlations as well as positive correlations to make predictions.
The Pearson correlation measurement not consider the fact of finding similar users for common items have
less influence in recommendation process than finding
similar users on un common items.
3
Constrained Pearson correlation coefficient (CPCC)
𝑺𝑰𝑴(𝒖, 𝒗)𝒄𝒑𝒄𝒄
= ∑ 𝒊∈𝑰( 𝑹𝒖,𝒊− 𝑹𝑴𝒆𝒅)( 𝑹𝒗,𝒊− 𝑹𝑴𝒆𝒅) √∑ 𝒊∈𝑰( 𝑹𝒖,𝒊− 𝑹𝑴𝒆𝒅)𝟐 √∑ ( 𝒊∈𝑰 𝑹𝒗,𝒊− 𝑹𝑴𝒆𝒅)𝟐
Does not make use of negative "correlations" as the Pearson algorithm
does. It uses median value instead of average
rating.
Does not take into account the number of
common rating.
4 Jaccard Distance
𝑺𝑰𝑴 (𝒖, 𝒗)𝒋𝒂𝒄𝒄𝒂𝒓𝒅 = |𝑰𝑼| ∩| 𝑰𝑽|
|𝑰𝑼|∪|𝑰𝑽|
Where |𝐼𝑈| | 𝐼𝑉| is the total number of items rated by
u and v respectively. Jaccard distance=1-Sim( u,v)jaccard
The concept behind this measure is that users are more similar if they have more common ratings.
Jaccard coefficient does not consider the
absolute ratings.
5
Inverse User Frequency
(IUF)
𝑰𝑼𝑭𝒊= 𝒇𝒊= 𝐥𝐨𝐠
𝑵 𝐧𝐢
𝐼𝑈𝐹𝑖 is the significance of the item i in the similarity
computation i is for specific item
N is no. of users
ni is the no. of co-rated users for item i
Formula decreases the weight on common items, because these items are less beneficial
in recommendation process to target users.
Does not take into account the number of
common rating.
Table 3. Additional Similarity Measures from Previously Mentioned Measures [source: "own elaboration"]
Eq.no Similarity
Measure Similarity Measure Formula Specification Disadvantage
6
Constrainted pearson correlation
with IUF
𝑺𝑰𝑴(𝒖, 𝒗)𝒄𝒑𝒄𝒄&𝐼𝑈𝐹
= ∑ 𝒇𝒊
𝟐 𝑵
𝒊=𝟏 (𝑹𝒖,𝒊− 𝑹𝑴𝒆𝒅)(𝑹𝒗,𝒊− 𝑹𝑴𝒆𝒅)
√∑𝑵𝒊=𝟏𝒇𝒊𝟐(𝑹𝒖,𝒊− 𝑹𝑴𝒆𝒅)𝟐 √∑𝑵𝒊=𝟏𝒇𝒊𝟐(𝑹𝒗,𝒊− 𝑹𝑴𝒆𝒅)𝟐
Take the effect of positive and negative similarity values and give weight to less
known items.
Does not make use of negative correlations and
number of common rating is
not counted.
7
Constrainted pearson correlation with jaccard
SIM=SIMCPCC*SIMJACCARD
Take the effect of positive and negative similarity values and consider the number of
common rating.
Does not give weight to less known item.
8
Constrained Pearson correlation with IUF & Jaccard
SIMproposed=SIMCPCC&IUF*SIMJACCARD
1-Take the effect of positive and negative
similarity values. 2- Consider the number
of common rating. 3- Give weight to less known items (long tail
problem.
Does not cope with Synonymy
and gray sheep problems.
3- Prediction Computation
After a similarity computation, a group of size K of nearest neighbors for the target user is chosen. Then a prediction for the target user (a) on a target item (i) is generated by aggregating weighted ratings of neighbor users (u's) plus the mean of target users' rating ( 𝑹̅̅̅̅ ). The prediction formula for user-based 𝒂 collaborative filtering is shown below (15):
𝑝𝑟𝑒𝑑𝑖𝑐𝑡(𝑢𝑠𝑒𝑟 𝑎, 𝑖𝑡𝑒𝑚 𝑖) = 𝑅𝑎
̅̅̅̅ +∑𝑢∈𝑈 𝑠𝑖𝑚 (𝑎,𝑢).( 𝑅𝑢,𝑖−𝑟̅̅̅)𝑢
∑𝑢∈𝑈 |𝑠𝑖𝑚 (𝑎,𝑢)| ….. EQ. 9
Where 𝑢 ∈ 𝑈 are target user's neighbors (K highest similarities).
Sim (a,u) similarity between target user (a) and neighbor users (u's).
Ru,i rating of user u to item i.
Results and Discussion:
In this section, the impact of the similarity measures on the prediction formula for user-based collaborative filtering is tested. The task is to assess different similarity measures mentioned in Table (2) and Table (3) by applying them on Movielens data set which contains 943 users,1682 movies and 100,000 ratings (provided by GroupLens Research) (16 . The rating scale of this data set is [1 to 5].
Using MATLAB as a programming language, MovieLens data set is loaded and represented as User-Movie matrix where the rows represent the number of users and the columns are the number of movies. In this study, a sample of the experiments is taken to clear the idea more simply and also do not take a lot of area in the page. Table
(4) shows an adjacency matrix, containing number of co-rated (common) movies between five users.
These values are needed in the prediction formula, which specify the number of movies shared among users Tables from (5 to 12) below their sources are "own elaboration".
Table 4. The number of co-rated movies between users.
User1 User2 User3 User4 User5
User1 262 15 7 4 73
User2 15 52 8 3 3
User3 7 8 44 6 1
User4 4 3 6 14 1
User5 73 3 1 1 165
Similarity measures formulas mentioned in Table (2) and Table (3) are applied on User-Movie matrix, the obtained adjacency similarity matrices are shown in Tables (5 to 11) for five users.
Table 5. Pearson Similarity Measure
User1 User2 User3 User4 User5 User1 1.0000 0.9545 0.8555 0.9318 0.9285 User2 0.9545 1.0000 0.9522 0.9918 0.9829 User3 0.8555 0.9522 1.0000 0.9484 1.0000 User4 0.9318 0.9918 0.9484 1.0000 1.0000 User5 0.9285 0.9829 1.0000 1.0000 1.0000
Table 6. Cosine Similarity Measure
Table 7. Constraint Similarity Measure
User1 User2 User3 User4 User5 User1 1.000 0.632 -0.105 0.309 0.465
User2 0.632 1.000 -0.674 0.816 0.866
User3 -0.105 -0.674 1.000 -0.195 1.000
User4 0.309 0.816 -0.195 1.000 NaN User5 0.465 0.866 1.000 NaN 1.000
Table 8. Jaccard Similarity Measure
User1 User2 User3 User4 User5 User1 0 0.9498 0.9766 0.9853 0.7938 User2 0.9498 0 0.9091 0.9524 0.9860 User3 0.9766 0.9091 0 0.8846 0.9952 User4 0.9853 0.9524 0.8846 0 0.9944 User5 0.7938 0.9860 0.9952 0.9944 0
Table (9) Constrained Pearson Correlation with Jaccard
User1 User2 User3 User4 User5 User1 0 0.600 -0.10 0.304 0.369 User2 0.600 0 -0.61 0.777 0.853 User3 -0.10 -0.61 0 -0.17 0.995 User4 0.304 0.777 -0.17 0 NaN User5 0.369 0.853 0.995 NaN 0
Table 10. Constrained Pearson Correlation with IUF
User1 User2 User3 User4 User5 User1 1.000 0.805 -0.46 0.702 0.490 User2 0.805 1.000 -0.84 0.963 0.929 User3 -0.46 -0.84 1.000 0.371 1.000 User4 0.702 0.963 0.371 1.000 NaN User5 0.490 0.929 1.000 NaN 1.000
Table 11. Constrained Pearson Correlation with IUF & Jaccard Similarity Measure
User1 User2 User3 User4 User5 User1 0.000 0.765 -0.453 0.692 0.390 User2 0.765 0.000 -0.766 0.918 0.916 User3 -0.453 -0.766 0.000 0.329 0.995 User4 0.692 0.918 0.329 0.000 NaN User5 0.390 0.916 0.995 NaN 0.000
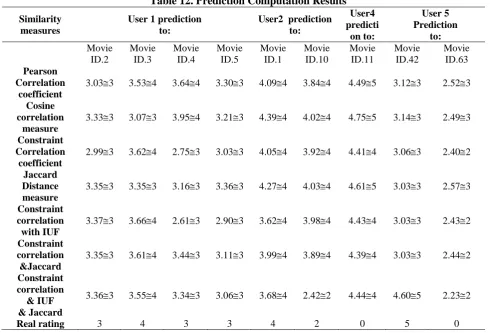
Then the prediction formula (EQ.9) is applied, using the resultant similarity matrices on selected users; to generate predictions for their rated and unrated movies. Prediction for rated movies is used to see how accurate the generated results to the real rating. Prediction results are shown in Table (12) for User 1, User 2, User 4 and User 5.
Table 12. Prediction Computation Results
Similarity measures
User 1 prediction to:
User2 prediction to:
User4 predicti on to:
User 5 Prediction
to:
Movie ID.2
Movie ID.3
Movie ID.4
Movie ID.5
Movie ID.1
Movie ID.10
Movie ID.11
Movie ID.42
Movie ID.63
Pearson Correlation
coefficient
3.033 3.534 3.644 3.303 4.094 3.844 4.495 3.123 2.523
Cosine correlation
measure
3.333 3.073 3.954 3.213 4.394 4.024 4.755 3.143 2.493
Constraint Correlation
coefficient
2.993 3.624 2.753 3.033 4.054 3.924 4.414 3.063 2.402
Jaccard Distance measure
3.353 3.353 3.163 3.363 4.274 4.034 4.615 3.033 2.573
Constraint correlation with IUF
3.373 3.664 2.613 2.903 3.624 3.984 4.434 3.033 2.432
Constraint correlation &Jaccard
3.353 3.614 3.443 3.113 3.994 3.894 4.394 3.033 2.442
Constraint correlation
& IUF & Jaccard
3.363 3.554 3.343 3.063 3.684 2.422 4.444 4.605 2.232
Real rating 3 4 3 3 4 2 0 5 0
The discussion of the prediction computation results from Table (12) is presented below:
User 1 rated (3) to movie2 because all the prediction values according to different similarity
measures approach (3) which is the same as the real rating (3) in MovieLens data set.
MovieLens data set and rated (3) using cosine and Jaccard measure.
User 1 rated (3) to movie4 using 5 similarity measures which is the same as the real rating (3) and rated (4) using Pearson correlation and cosine measures.
User 1 rated (3) to movie5 using all similarity measures which is the same values as in the real rating (3).
User 2 rated (4) for movie1which is the same as in real rating (4)
User 2 rated (2) for movie10 using the proposed similarity measure Constrained Correlation with IUF and Jaccard only which is the same real rating (2) in movielens data set.
User 4 rated (4) for movie11 which is not rated by the user in the real Movielens data set.
User 5 rated 5 for movie42 when using the proposed similarity measure Constrained Correlation with IUF and Jaccard only which is rated 5 in real rating.
User 5 rated(2) for movie63 which is not rated by the user 5 in the real MovieLens data set.
Conclusion:
This study shows the explicit rating significance rather than just calculating distances among users using similarity measures. The aim is to focus on the global meanings of rating values in real data set rather than local meanings. Moreover less known movies are focused on by using the parameter (IUF) and treated effectively and as a result, the diversity is achieved and long tail problem can be partially solved. Many similarity measures are conducted, it is concluded that it is not possible to relate between users effectively, since it provides a relatively equivalent similarity values. But in the proposed similarity measure (Constrained Correlation with IUF and Jaccard); a relatively accurate prediction results are obtained because each user in the data set became distinguished as a dependable user since it provides different similarity values for each pair of users. It is concluded from this study that the explicit rating of users can be dependable in the prediction process for target users. Better results are obtained from a combination of similarity measures because the weakness of each of measure is strengthened by another measure.
Conflicts of Interest: None.
Reference:
1. Abdelwahab A, Sekiya H, Matsuba I, Horiuchi Y, Kuroiwa S .Collaborative filtering based on an iterative prediction method to alleviate the sparsity problem. ACM, Proceedings of the 11th International
Conference on Information Integration and Web-based Applications & Services [internet].2009
December; pp: 375-379.
DOI:10.1145/1806338.1806406.
2. Isinkaye F, Folajimi Y, Ojokoh B .Recommendation systems: Principles, methods and evaluation. Egyptian Informatics Journal [internet]. 2015
November; 16(3):261-273.
DOI:10.1016/j.eij.2015.06.005.
3. Su X, Khoshgoftaar T .A survey of collaborative filters techniques. Advances in artificial intelligence [internet].2009August.DOI:10.1155/2009/421425. 4. Celma O .Music recommendation: In Music
recommendation and discovery. Springer [internet]. 2010; 194 p. Berlin Heidelberg.DOI: 10.1007/978-3-642-13287-2.
5. KG S, Sadasivam G S .Modified Heuristic Similarity Measure for Personalization using Collaborative Filtering Technique. Appl. Math. Inf. Sci. [internet].2017 November; 11(1):307-15.DOI:10.18576/amis/110137.
6. Huang B H, Dai B R .A Weighted Distance Similarity Model to Improve the Accuracy of Collaborative Recommender System. 16th IEEE International Conference on Mobile Data Management [internet].2015 September; pp: 104-109. DOI:10.1109/MDM.2015.43.
7. Wu Z, Chen Y, Li T .Personalized recommendation based on the improved similarity and fuzzy clustering. Information Science, Electronics and Electrical Engineering (ISEEE) International Conference [internet].2014 April; Vol. 2, pp: 1353-1357.DOI:10.1109/InfoSEEE.2014.6947895. 8. Katukuri J, Könik T, Kolay S, Mukherjee R
.Recommending similar items in large-scale online marketplaces. IEEE International Conference on Big Data [internet].2014; pp: 868-876. DOI: 10.1109/BigData.2014.7004317.
9. Mao J, Cui Z, Zhao P, Li X .An improved similarity measure method in collaborative filtering recommendation algorithm. IEEE, Cloud Computing and Big Data (CloudCom-Asia) International Conference [internet].2013 Dec.; pp: 297-. DOI:10.1109/CLOUDCOM-ASIA.2013.39.
10.Anand D, Bharadwaj K K .Utilizing various sparsity measures for enhancing accuracy of collaborative recommender systems based on local and global similarities. ALSEVIER, Expert systems with applications [internet].2011; 38(5):5101-5109. DOI: 10.1016/j.eswa.2010.09.141.
11.Lee H C, Lee S J, Chung Y J .A study on the improved collaborative filtering algorithm for recommender system. IEEE, Software Engineering Research, Management & Applications 5th ACIS International Conference [internet].2007 Aug.; pp: 297-304. DOI:10.1109/SERA.2007.33.
13.Verma A, Bhamidipati K .A survey of memory based methods for collaborative filtering based techniques for online Recommender systems. (IJCET) [Internet].2013; 4(2):366-372.
14.AL Bakri N F, Hashim S H .A modified similarity measure for improving accuracy of user-based collaborative filtering. Iraqi Journal of Science [internet].2018; 59(2B):934-945.
DOI:10.24996/ijs.2018.59.2B.15.
15.Adomavicius G, Tuzhilin A .Toward the next generation of recommender systems: a survey of the state-of-the-art and possible extensions. IEEE Transaction, Knowledge Data Eng. [internet].2005; 17(6):734–749.DOI: 10.1109/TKDE.2005.99. 16.MovieLens data set. Available from:
https://grouplens.org/datasets/movielens/.
هباشتلا سيياقم ساسأ ىلع ةيصوتلا ماظن يف ؤبنتلا ةقد لوح ةسارد
يركبلا لضاف هيدان
1مشاه نسح هنيكس
2
1
,تابساحلا مولع مسق هعماج
,نيرهنلا قارعلا,دادغب
2
,تابساحلا مولع مسق ,هيجولونكتلا هعماجلا
قارعلا,دادغب
:هصلاخلا
تاينقت رثكأ نم ةدحاو يه ةينواعتلا ةيفصتلا .تنرتنلإا ملاع يف ةحاتملا تانايبلا نم لئاهلا مكلا مهفل تاودأ يه ةيصوتلا مظنلوح قئاقحلا مادختسا ىلع ةركاذلا ىلع ةمئاقلا ةينواعتلا ةيفصتلا زكرت .تايصوتلا ماظن يف يباجيإ لكشب ةمدختسملا ةفرعملا فاشتكا ئاقلا نيمدختسملا ةينواعتلا ةيفصتلا يف ةيساسلأا تايلمعلا نم يه هباشتلا سيياقم .فدهتسملا مدختسملل ةديدج ءايشأب ؤبنتلل ,نيرفوتملاو نيم
ا تلاماعملا عم ةيديلقتلا هباشتلا سيياقم نم ةعومجم مادختسا مت , ةساردلا هذه يف .هباشتلا تاباسح ىلع بلاغلا يف دمتعت ؤبنتلا ةقدو هحجرمل
علا باسحل تانايب ةعومجمل نيمختلا ةفوفصم ربع نيمدختسملا نيب ةقلا
MovieLens) , ةساردلا نم .سايقم لك بويعو ايازم فاشتكا مت .)
ةيبيرجتلا جئاتنلا ءارجإ دعب .تانايبلا ةعومجم نيمختل لماشلا ىنعملا عم لماعتلل سيياقملا نم ةعومجم نم نوكم ديدج سايقم حارتقا مت نيبت ,
ا سايقملا نأ .تاؤبنتلا ةقد نم ديزت يتلا فادهلأا نم ديدعلا ققح حرتقمل
:ةيحاتفملا تاملكلا
ةينواعتلا ةيفصتلا ,
سوكعم مدختسملا ددرت ,


![Table 3. Additional Similarity Measures from Previously Mentioned Measures [source: "own elaboration"]](https://thumb-us.123doks.com/thumbv2/123dok_us/186929.1512231/4.595.50.548.81.306/table-additional-similarity-measures-previously-mentioned-measures-elaboration.webp)