Atmos. Meas. Tech., 6, 1903–1918, 2013 www.atmos-meas-tech.net/6/1903/2013/ doi:10.5194/amt-6-1903-2013
© Author(s) 2013. CC Attribution 3.0 License.
EGU Journal Logos (RGB)
Advances in
Geosciences
Open Access
Natural Hazards
and Earth System
Sciences
Open AccessAnnales
Geophysicae
Open AccessNonlinear Processes
in Geophysics
Open AccessAtmospheric
Chemistry
and Physics
Open AccessAtmospheric
Chemistry
and Physics
Open Access DiscussionsAtmospheric
Measurement
Techniques
Open AccessAtmospheric
Measurement
Techniques
Open Access DiscussionsBiogeosciences
Open Access Open Access
Biogeosciences
DiscussionsClimate
of the Past
Open Access Open Access
Climate
of the Past
Discussions
Earth System
Dynamics
Open Access Open Access
Earth System
Dynamics
DiscussionsGeoscientific
Instrumentation
Methods and
Data Systems
Open Access
Geoscientific
Instrumentation
Methods and
Data Systems
Open Access DiscussionsGeoscientific
Model Development
Open Access Open Access
Geoscientific
Model Development
DiscussionsHydrology and
Earth System
Sciences
Open AccessHydrology and
Earth System
Sciences
Open Access DiscussionsOcean Science
Open Access Open Access
Ocean Science
DiscussionsSolid Earth
Open Access Open Access
Solid Earth
DiscussionsThe Cryosphere
Open Access Open Access
The Cryosphere
DiscussionsNatural Hazards
and Earth System
Sciences
Open Access
Discussions
Detection of convective initiation using Meteosat SEVIRI:
implementation in and verification with the tracking and nowcasting
algorithm Cb-TRAM
D. Merk1,*and T. Zinner1
1Meteorologisches Institut, Ludwig-Maximilians-Universit¨at, Theresienstr. 37, 80333 Munich, Germany *now at: Leibniz-Institut f¨ur Troposph¨arenforschung, Permoserstr. 15, 04318 Leipzig, Germany
Correspondence to: D. Merk ([email protected])
Received: 23 December 2012 – Published in Atmos. Meas. Tech. Discuss.: 14 February 2013 Revised: 24 June 2013 – Accepted: 27 June 2013 – Published: 6 August 2013
Abstract. In this paper a new detection scheme for convec-tive initiation (CI) under day and night conditions is pre-sented. The new algorithm combines the strengths of two existing methods for detecting CI with geostationary satel-lite data. It uses the channels of the Spinning Enhanced Visi-ble and Infrared Imager (SEVIRI) onboard Meteosat Second Generation (MSG). For the new algorithm five infrared (IR) criteria from the Satellite Convection Analysis and Track-ing algorithm (SATCAST) and one high-resolution visible channel (HRV) criteria from Cb-TRAM were adapted. This set of criteria aims to identify the typical development of quickly developing convective cells in an early stage. The different criteria include time trends of the 10.8 IR chan-nel, and IR channel differences, as well as their time trends. To provide the trend fields an optical-flow-based method is used: the pyramidal matching algorithm, which is part of TRAM. The new detection scheme is implemented in Cb-TRAM, and is verified for seven days which comprise dif-ferent weather situations in central Europe. Contrasted with the original early-stage detection scheme of Cb-TRAM, skill scores are provided. From the comparison against detections of later thunderstorm stages, which are also provided by Cb-TRAM, a decrease in false prior warnings (false alarm ratio) from 91 to 81 % is presented, an increase of the critical suc-cess index from 7.4 to 12.7 %, and a decrease of the BIAS from 320 to 146 % for normal scan mode. Similar trends are found for rapid scan mode. Most obvious is the decline of false alarms found for the synoptic class “cold air” masses.
1 Introduction
Due to their hazardous impact, such as strong winds, hail or lightning thunderstorms remain a great threat to econ-omy and society. Especially for the aviation industry the phenomenon carries a high financial risk; Mecikalski et al. (2007) and Murray (2002) stated that their annual costs related to thunderstorms exceed tens of millions of dol-lars. Therefore interest is high to predict thunderstorms as early and precisely as possible. Although today’s numeri-cal weather prediction (NWP) models are able to predict the likelihood for thunderstorms occurrence in a specified area reliably, it is difficult to forecast the exact time and place and path of individual thunderstorms with NWP models alone.
difference between convective initiation (CI) and no occur-rence of convection.
As a result, nowcasting, i.e. the extrapolation of existing developments based on observational data, is used to pre-dict the development and path of individual thunderstorms. Nowcasting is made possible by means of remote sensing data with good spatial and temporal coverage. Useful data are provided by radar, satellites, or lightning networks. Outside Europe and North America radar data typically lack cover-age and are affected by ground echoes especially in moun-tainous areas. For the detection of convective cells in a very early stage – the CI – radar data is not very useful as pre-cipitation echoes are not observable at that stage. Although additional methods exist for the detection of earlier devel-opment using radar, like the detection of convergence lines using Bragg scattering effects due to thermodynamical gradi-ents or Rayleigh scattering due to small insects (Weckwerth and Parsons, 2006; Wilson and Mueller, 1993), satellite data are better suited for this task. Mecikalski et al. (2010) found that lead times of up to 75 min for thunderstorms are possi-ble when a set of different channel criteria for geostationary satellite data is applied. An advantage of the geostationary perspective is the continuous spatial and temporal coverage of wide regions. Twelve different channels are available for the Meteosat Spinning Enhanced Visible and InfraRed Im-ager (SEVIRI). Image refresh rates are 15min for normal scan mode (NS), and 5min for rapid scan mode (RS).
Different nowcasting tools have been developed in re-cent years. While some conre-centrate on tracking of ma-ture thunderstorms such as the Rapid Developing Thunder-storms (RDT) algorithm (Morel and S´en´esi, 2002) or the MAximum Spatial COrellation Tracking TEchnique (MAS-COTTE) (Carvalho and Jones, 2001), others use radar data only, e.g. the convection evolution in radar products algo-rithm (KONvektionsentwicklung in RADarprodukten, KON-RAD) (Lang, 2001) or the Radar Tracking and Monitoring (RadTRAM) algorithm (Kober and Taffener, 2009). There also exist nowcasting algorithms for the detection of CI, e.g. SATellite Convection AnalySis and Tracking (SAT-CAST) (Mecikalski and Bedka, 2006). In addition to the detection of later development stages, a daytime detection of convection at an early or CI stage is part of Cb-TRAM (Thunderstorm (Cb) Tracking and Monitoring; Zinner et al., 2008; Zinner et al., 2013). Reinhardt and Dotzek (2010) in-vestigated the quality of CI detections for both SATCAST and Cb-TRAM. They found rather high false alarm ratios (see Sect. 3.1). These can be explained by the physical char-acteristics of convection. In the following study, a combina-tion of SATCAST and Cb-TRAM is conducted to merge the strengths of both methods to detect CI within Cb-TRAM.
Through the work described in this manuscript, Cb-TRAM is provided with a day- and nighttime detection of early con-vection stages. An estimate of the CI detection skill is ob-tained with a verification setup utilizing the detection of later stages within Cb-TRAM for NS and RS Meteosat data. The
tools on which the new detection scheme is based are de-scribed in Sect. 2. The development of the new detection and verification schemes, as well as a detailed description, are presented in Sect. 3. The verification including a comparison of the existing Cb-TRAM CI detection and the new algo-rithm, as well as the comparison of the NS and RS data, is presented in Sect. 4. Afterwards a summary of the method and results, and a discussion of the remaining sources of un-certainty is given in Sect. 5.
2 Tools for the detection of convective initiation
The new detection scheme builds on two existing algorithms for the detection of convective clouds based on geostation-ary satellite data. The Cb-TRAM algorithm is introduced in Zinner et al. (2008). Changes to the detection schemes are presented in Zinner et al. (2013). The SATCAST algorithm is described by Mecikalski and Bedka (2006). Further changes to this algorithm, referred to as SATCASTv2, are described by Walker et al. (2012). In the following a short overview of these two algorithms is given.
2.1 Cb-TRAM
Cb-TRAM is an algorithm for the detection, tracking, and nowcasting of intense convective cells, using the data from Meteosat SEVIRI. Cb-TRAM contains three core compo-nents: (1) the derivation of a motion vector field based on the pyramidal matching algorithm, (2) the detection of con-vective cells at different stages of their life cycle, and (3) the tracking and nowcasting up to 60 min using the motion vector field. It is used in the European Union projects “RiskAware” (2004–2006) and “FLYSAFE” (2006–2009, Tafferner et al., 2008), and ongoing DLR (Deutsches Luft- und Raum-fahrtzentrum, i.e. German Aerospace Center) project “Wet-ter und Fliegen” (Weather and Flying) (Fors“Wet-ter and Tafferner, 2009, 2012).
image at timet from a warped version of the image att−1. As the disparity vector fields do not only include cloud mo-tion, but also the changes in cloud amount, it is necessary to use slightly different timesteps or other channels to obtain an advection corrected result (see Zinner et al., 2008).
Cb-TRAM discriminates convective clouds at three dif-ferent development stages. Stage 1 is called “early devel-opment” or “CI” and covers only cloud elements showing strong vertical and/or horizontal growth. These clouds are characterized by fast cloud top cooling in IR channels and in-creased reflectivity in the visible channels. To this end the lo-cal trend of cloud pixels in the IR10.8 and the high-resolution visible (HRV) channels are investigated. That means, the convective cell has not necessarily reached a precipitation stage to be classified as “CI”.
Stage 2 uses the cooling trend in the WV6.2 channel to de-tect convective cells displaying “rapid development” in the upper-tropospheric region. “Mature thunderstorm” consti-tutes the third stage. Mature convective cells typically show a cirrus anvil and a cloud top close to the top of the troposphere (or lower-level inversions). They can even “overshoot” over these levels. Stage 3 is mainly detected by a calculation of the difference field between the WV6.2 and the IR10.8 chan-nels. An additional criterion used therein that improves the limitation of the detection to active convective cores is the HRV channels texture (WV6.2 channel texture at nighttime). Texture is quantified by a normalized local standard devia-tion field.
The tracking of Cb-TRAM provides a log file containing the life cycle of individual cell objects. The tracking is based on overlap of detected cells in consecutive images. Existing cell objects at timet−1 are extrapolated using the disparity vector. Afterwards, the overlap with cells of timet is anal-ysed. If no overlap is detected, the cell object of timet is considered a new cell object. If more than one cell object overlaps with exactly one cell object at the current timestep, a maximum overlap decision is made. Only the cell objects’ life cycle that shows the maximum area overlap is continued. Other cell objects’ life cycles end. If one cell object from t−1 overlaps with more than one object of time t, again maximum overlap provides the continuation of one cell life cycle and several new cell objects.
2.2 SATCAST
SATCAST was initially developed for the GOES 11 and 12 data, but also first efforts have been made to use Meteosat SEVIRI. The algorithm aims at providing early warnings of thunderstorms. To this end it combines three main com-ponents to detect CI. The first is a convective cloud mask interpolated to 1 km resolution. The second component de-rives mesoscale atmospheric motion vectors (AMVs), and the third investigates actual brightness temperatures and mul-tispectral time trends. CI in SATCAST is defined as the first detection of radar reflectivities≥35 dBZ equivalent to heavy
precipitation produced by convective clouds. In their study Mecikalski and Bedka (2006) investigate the precursor sig-nals for CI, and therefore the applied criteria can be directly compared to Cb-TRAM’s first stage detection.
The convective cloud mask (Berendes et al., 2008) splits the satellite scene into four different cloud types: (1) imma-ture cumulus defined as warm clouds (>−20◦C) with pro-nounced texture (standard deviation of brightness counts); (2) thick stratus or thin cirrus that shows both little texture and warm cloud top temperatures, (3) thick cirrus, i.e. cold clouds (<−20◦C) with little texture; and (4) cumulonim-bus (Cb) which typically shows cold cloud top temperatures and high texture in their active centre. This classification is achieved through a series of analyses considering the typical characteristics of convective clouds in the visible channels, which are high brightness values and distinct cloud edges, the different appearance of new cumulus clouds and Cb/thick cirrus in the IR10.8 channel and WV6.5-IR10.8 channel dif-ference, the different appearance of stratus and Cb in terms of texture.
AMVs are calculated to derive cloud top cooling trends considering the cloud advection. The algorithm that is de-scribed in Velden et al. (1997) and Velden et al. (1998) serves as a base. The algorithm derives motion vectors on synoptic scales important for assimilation of NWP mod-els. To this end, SATCAST investigates the satellite image for distinct cloud features that could be tracked over a de-fined time sequence and applies a cross-correlation tech-nique (Merrill et al., 1991) for matching these features. This method depends on high time repeat frequencies of satel-lite images. Changes to this algorithm were applied in or-der to provide motion vectors including both synoptic scale and mesoscale vectors – the latter being associated with cu-mulus cloud ageostrophic motions. Quality checks applied within the Velden et al. (1997) algorithm result in a loss of mesoscale, ageostrophic motion vectors. The quality checks compare the satellite-derived motion vectors with a NWP model first guess and check the spatial connection of neigh-boured motion vectors. Therefore motion information on smaller scales is lost. To deal with this issue the follow-ing relaxations to the original Velden et al. (1997) algorithm were applied in order to yield a denser mesoscale AMV field (Bedka and Mecikalski, 2005): reduction of the NWP first-guess constraint as subgrid motions can not be resolved re-liable by the model; changes of feature selection and vector editing schemes so that horizontal resolution of feature box size and vertical resolution are increased. By this relaxation a 20 times greater number of vectors is achieved. But also erroneous vectors are included that can result in unreliable cooling or warming trends.
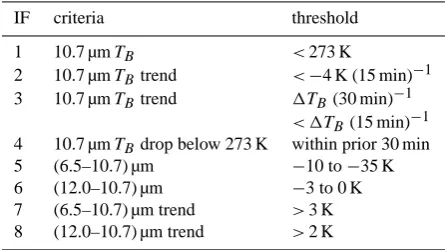
Table 1. SATCAST GOES-11 IFs for the detection of CI.
IF criteria threshold
1 10.7 µmTB <273 K
2 10.7 µmTBtrend <−4 K (15 min)−1 3 10.7 µmTBtrend 1TB(30 min)−1
< 1TB(15 min)−1 4 10.7 µmTBdrop below 273 K within prior 30 min
5 (6.5–10.7) µm −10 to−35 K
6 (12.0–10.7) µm −3 to 0 K
7 (6.5–10.7) µm trend >3 K 8 (12.0–10.7) µm trend >2 K
With IF (1) and IF (4) the special importance of the freez-ing level is considered. IF (2) refers to the vertical cloud growth which results in cloud top cooling. IF (3) tests for persistence of cloud growth to assure that the observed cool-ing is not only a random pattern. IF (5) gives information about the cloud top height relative to the troposphere, or a very dry layer in the mid- to upper troposphere. IF (7) investi-gates the time trend of the channel difference in IF (5). IF (6) and IF (8) are used to highlight cloud pixels that are likely to develop into a precipitating cloud (see Table 1, Bedka and Mecikalski, 2005; Mecikalski et al., 2008, 2010; Roberts and Rutledge, 2003; Mueller et al., 2003). As in Mecikalski and Bedka (2006), in order to have confidence that CI will occur, 7 out of 8 criteria per pixel have to be met.
Mecikalski et al. (2010) also investigated the use of the ad-ditional channels provided by Meteosat SEVIRI and found 21 out of 67 initially defined IR channel differences and time trends to have the least amount of redundance for the investi-gation of cloud depth, updraft strength and cloud-top glacia-tion. As only preliminary thresholds for 123 cases are used in this study and further testing with a larger data set would be required for these IFs, the Mecikalski et al. (2010) study is not used here. Only the eight original criteria listed above are considered in the following.
3 Development of an improved detection scheme for convective initiation
The aim of the development of this new detection scheme for CI is the combination of the strengths of existing detection algorithms in a way that the advance warning of strong con-vective cells is improved. To achieve this aim, an analysis of strengths and weaknesses is necessary first. Time trends are used for many detection criteria within SATCAST and Cb-TRAM. As the derivation of such trends is highly dependent on the accuracy of the calculated motion fields, the quality of these vector fields is of great importance.
The AMVs in SATCAST require the existence of features that can be tracked reliably throughout a sequence of satel-lite images. The extension of the original AMV algorithm,
which keeps track of mesoscale motion, may result in erro-neous vectors which could, accordingly, lead to unreasonable cooling trends. Especially for strong vertical wind shear con-ditions the accuracy of AMVs seems to drop, as outlined by Mecikalski et al. (2008).
The motion vector field in Cb-TRAM is derived on a pixel basis. It is independent of trackable features. The disparity vector field in Cb-TRAM, of course, still comprises some weaknesses. The field not only includes the pure advection, but also local development. This has to be considered cor-rectly. Nonetheless, the matching algorithm in Cb-TRAM provides pixel-by-pixel motion fields for all clouds moving in a satellite scene derived in a physically meaningful, scale-dependent way.
On the other hand, the Cb-TRAM CI detection is limited to one combination of criteria including the HRV. For this reason only daytime detection is possible. While the skill of the mature-thunderstorm detection has been evaluated using lightning data (Zinner et al., 2013), a systematic evaluation of this first stage detection is pending. Contrary to this, SAT-CAST uses a set of IFs with several channels’ information. Compared to Cb-TRAM this approach reduces the high sen-sitivity and uncertainty of a decision that depends on a single field. In addition, the importance of individual IFs for CI de-tection in SATCAST was already investigated by Mecikalski et al. (2008). This provides a starting point for the further implementation of selected IFs into a new method.
Following from these considerations, we decided to in-clude parts of the SATCAST-based systematic set of criteria and thresholds into Cb-TRAM as new stage 1 “CI/early de-velopment” detection scheme. This way, we aim to improve the efficiency of SATCAST criteria through the use of the Cb-TRAM disparity vector fields for an improved derivation of time trends. An additional objective of the following work is the provision of a day- and nighttime CI detection scheme for Cb-TRAM.
3.1 Verification method
In order to evaluate the skill of the detection for development stage 1 (CI/early development) in Cb-TRAM a suitable veri-fication method has to be defined.
Cb-TRAM provides an estimate of the development of CI events into more developed thunderstorms itself. It gener-ates a connection between the stages CI/early development and rapid development or mature thunderstorms via its track-ing capability. We decided to use this feature for verifica-tion in the following. Although collected by the same sensor, these are at least partially independent data, as the detection schemes of stage 2 and stage 3 are providing information on later stages of development using different channel com-binations. Cb-TRAM’s skill to detect mature-thunderstorm clouds is evaluated in Zinner et al. (2013): the probability of detecting a mature intense convective cell is about 77 %, at least during the day. At the same time only about 16 % of all stage 3 detections do not show any convective activ-ity in terms of lightning. Similar to the verification in Zinner et al. (2013) an object-based verification method is applied here, using the cell objects generated by Cb-TRAM and the related life cycle log data for each cell. If the Cb-TRAM’s CI detections are perceived as forecasts of further develop-ment into thunderstorms, and stages 2 and 3 for the related Cb-TRAM object as proof of convective development, then one can define the following categorical variables regarding the development of each individual cell object:
– A hitH is a cell object at stage 1 that shows further development into stage 2 or 3 within 60 min.
– A false alarmF is a cell object at stage 1 that does not show further development within 60 min.
– A missM is a cell object at stage 2 or 3 without any stage 1 detection during the previous 60 min.
This definition is rather ambitious as the evaluation is done on an individual cell basis instead of an evaluation of the general affinity of a wide tolerance region to display further thunderstorm development. This has to be taken into account when comparing our values to less strictly defined verifica-tions (e.g. Reinhardt and Dotzek, 2010; Mecikalski et al., 2008). Nonetheless, this definition complies with common sense and thus provides appreciable result values. It is well suited to compare the two CI algorithms within Cb-TRAM, and the results can be directly provided by the Cb-TRAM algorithm.
Different verification statistics can be calculated Roebber (2009) with these categorical variables. In this paper the fol-lowing are used: POD (probability of detection), FAR (false alarm ratio), CSI (critical success index), BIAS.
The ideal value is 100 % for the POD, CSI, and BIAS. It is 0 % for the FAR. POD and FAR should be considered as a pair. It is possible to improve the POD by just ran-domly increasing the number of forecast objects, but this would normally result in an synchronous increase of the FAR. The POD provides the fraction of correctly detected early developments when a thunderstorm followed the detec-tion, while the FAR provides the fraction of detections which
are not followed by thunderstorms. The CSI combines both, the number of hits and the number of false alarms. Typically the CSI shows small values for rare events, like CI or thun-derstorms in general, as the number of hits is low. The BIAS simply gives the ratio of forecasted to observed number of events. Values of the BIAS above 100 % constitute over-forecasting, and below 100 % under-forecasting. Nonetheless the BIAS does not judge how well observations and forecasts correspond.
A Cb-TRAM cell object can represent several consecutive cell life cycles of a multi-cell thunderstorm. This is because the tracking algorithm will allocate a new development, close enough to the expected track, to an already existing cell in a decaying stage. As a result more than one CI classification per cell object is possible. Consider the following example object history: 0 min – stage 3 detection (mature); 15 min – stage 3; 30 min – stage 3; 45 min – stage 1 (CI); 60 min – stage 2 (rapid development); and 75 min – stage 3. This means that the cell life cycle starts with a missed CI develop-ment, but nonetheless shows a hit at 45 min.
3.2 Convective cloud IF mask
The first step of the new detection scheme is the limitation to an IF mask for convective clouds within a full satellite scene. Similar to SATCAST’s convective cloud mask only pixels within this IF mask are evaluated further. This step aims at the reduction of false alarms that can be found in ar-eas where the likelihood for convective clouds in the satellite image scence is minimal. The IF mask is derived using three different tests:
– 253 K<IR10.8<278 K
– HRV reflectivity>0.5 (can be used only under daytime conditions)
– Local standard deviation at WV7.3 and IR10.8 larger than defined threshold.
The first test investigates the cloud top temperature in the IR10.8 channel. Clouds with top temperatures<253 K typi-cally have reached higher altitudes so that it is likely for those clouds to be either Cb or thick cirrus. It is very unlikely for CI to show top temperatures below this threshold value. The same threshold is used within SATCAST to separate mature from initial convective clouds. Cloud top temperatures above 278 K refer to very low clouds, such as cumulus or stratus. SATCAST uses 273 K as one typical criterion for CI. This value is relaxed here to account for a wider range of convec-tive developments.
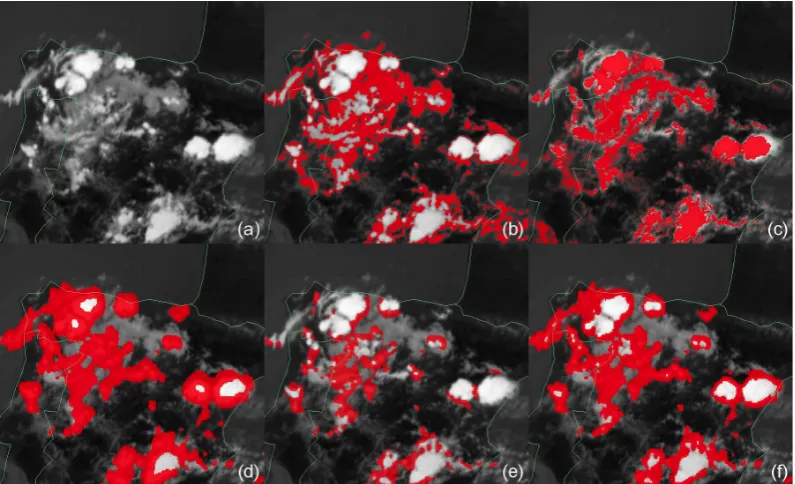
Fig. 1. Limitation to IF: (a) IR10.8 cloud scene over Iberian Peninsula with various (convective) cloud types. Different tests for the convective cloud IF masks: (b) 253 K<IR10.8<278 K, (c) HRV>0.5, (d) local standard deviation at WV7.3 and IR10.8, (e) IF mask at daytime, (f) and nighttime condition (without HRV). Positive test results for each pixel are plotted in red.
A distinct signal of cumulus clouds that is taken into ac-count for the third test is their lumpy appearance. The con-vective process does not produce a smooth cloud top struc-ture, which is more likely for, e.g., cirrus and stratus. Al-though the HRV channel would provide the best horizontal resolution to detect such variability, the IR10.8 and WV7.3 are used here to provide a method applicable day and night. While the IR10.8 channel gives the possibility of detecting all clouds in the lower troposphere (if no overlaying clouds in the upper layer exists), the WV7.3 is used to guarantee that clouds have reached a significant altitude at a lower mid-troposphere level (approx. 3000 m). The localized standard deviation (cf. Zinner et al., 2008) is calculated for a local area around each pixel using a Gaussian kernel. Threshold values are derived by mean values of the detected CI ob-jects within the existing Cb-TRAM version. Separate masks of these three tests are presented in Fig. 1 for a case over the Iberian Peninsula together with the resulting IF for both day-and nighttime conditions.
3.3 Scoring system
As for SATCAST a scoring system is adopted for a set of criteria for CI detection with a final decision based on the number of met criteria. A basic set of six criteria is selected from SATCAST by means of a statistical analysis and some general considerations. For MSG SEVIRI, channel IR10.8 is used instead of IR10.7 onboard GOES, and WV6.2 in-stead of WV6.5. Criteria with proven values for CI detection
are prefered (i.e. the eight SATCAST GOES criteria). For these criteria tested threshold values exist and can be used immediately. An additional criterion is the processing time requirement as a nowcasting tool, of course, should provide results quickly. Thus the number of utilized channels and subsequently detection criteria is limited to a minimum while preserving the best possible result. Beforehand some of the SATCAST IF thresholds have been modified. For IF 2 the IR10.8 cooling rate is set to−6 K within 15 min (compare Tables 1 and 2). Reasonable cooling rates for CI detection following Roberts and Rutledge (2003) are between−4 and −8 K within 15 min for weak and strong growth rates, re-spectively. The time frame in IF 3 for which the temperature dropped below the freezing point is set to 15 min. Roberts and Rutledge (2003) found out that 15 min after this criteria is fulfilled, first convective radar echoes can be observed.
Fig. 2. Different masks for the six separate criteria listed in Table 3 for the same scene as in Fig. 1. Pixels plotted in red meet the individual thresholds for the defined criterion. (a) Criterion #1: 15 min IR10.8; (b) #2: 30 min IR10.8; (c) #3: freezing level IR10.8; (d) #4: WV6.2-IR10.8; (e) #5: 15 min WV6.2-WV6.2-IR10.8; (f) #6: HRV×IR10.8.
Table 2. Grouped set of criteria for CI detection.
Criteria Critical value
Group 1 (IR10.8 cooling trend)
10.8 µmTBtrend <−6 K (15 min)−1
10.8 µmTBtrend 1TB(30 min)−1< 1TB(15 min)−1 TBin 10.8 µm
drop below 273 K within last 30 min
Group 2 (relative height within troposphere and growth)
(6.2–10.8) µm −10 to−35 K (6.2–10.8) µm trend >3 K
Group 3 (split window channel test)
(12.0–10.8) µm −3 to 0 K (12.0–10.8) µm trend >2 K
Group 4 (Cb-TRAM CI detection)
HRV×10.8 µm Cb-TRAM threshold
analysis is described in detail in Sect. 3.1. Similar to the study of Mecikalski et al. (2008), 15 possible combinations of the four groups were investigated. The best trade-off concerning CSI and FAR was yielded by the combination of group 1, group 2 and group 4. The criteria in group 3 aim to detect clouds that are already glaciated and therefore are in a very final phase of CI. We decided to omit these criteria for our
purposes. This is due to the slightly different emphasis on early development and, consequently, the fact that such de-velopment is already covered by the stage 2 detection within Cb-TRAM, and the result of the combinations. Finally the set of six different criteria from groups 1, 2 and 4 as listed in Table 3 is used to further investigate the pixels in the previ-ously derived IF mask. An example of the individual criteria is given in Fig. 2.
At daytime conditions, five of six criteria have to be met at a given time for a given pixel to consider this pixel to show CI. At nighttime the five remaining IR criteria have to be met (without the criterion 6). Further a minimum object size is required. Only CI pixels which have at least two neighbour-ing pixels are kept. This is analogous to the other Cb-TRAM detection schemes and is mainly used to avoid false alarms related to very small short-lived objects.
4 Skill of CI detection: verification within Cb-TRAM
Table 3. Set of six criteria used for the new CI detection algorithm together with the individual thresholds for NS and RS.
# Criteria Critical value (NS) Critical value (RS)
1 10.8 µmTBtime trend <−6 K (15 min)−1 <−2 K (5 min)−1
2 10.8 µmTBtime trend 1TB(30 min)−1< 1TB(15 min)−1 1TB(15 min)−1< 1TB(10 min)−1< 1TB(5 min)−1 3 10.8 µmTBdrop below 273 K within last 15 min within last 15 min
4 (6.2–10.8) µm −10 to−30 K −10 to−30 K
5 (6.2–10.8) µm time trend >3 K >1 K
6 HRV×10.8 µm Cb-TRAM NS threshold Cb-TRAM RS threshold
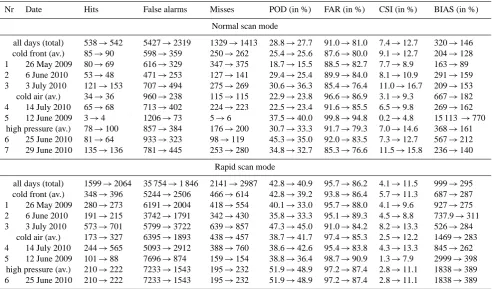
Fig. 3. High-resolution visible (HRV) Meteosat images representative for the synoptic classes (a) “cold front” on 26 May 2009, (b) “cold air” on 12 June 2009, (c) “high pressure” on 25 June 2010, 12:00 UTC.
4.1 Test cases and conditions
The verification is carried out for seven different test days over the area of central Europe. These days can be classified into three different, typical synoptic weather conditions for thunderstorm development:
– class “cold front”: convection connected with a cold-front passage. The typical pattern is an upper-level trough over the west coast of the Atlantic, passing over the area of interest during the observation period. Convection is triggered directly at the frontal region and in the prefrontal moist and destabilized air mass. Prefrontal high convective available potential energy (CAPE) values can be observed, and also deep layer shear is present. 26 May 2009 (day 1), 6 June 2010 (day 2), 3 July 2010 (day 3).
– class “cold air”: advection of cold air masses together with an active upper-level low and presence of sur-face heating leads to instability and triggering of many convective cells. Both thunderstorm and non-electric rain showers occur in a typical honeycombed structure. 14 July 2010 (day 4) and 12 June 2009 (day 5). – class “high pressure”: convection connected with
weak-forcing conditions. A typical pattern is an upper-level ridge stretching over central Europe, connected to a low-level high-pressure area, generally suppressing
Fig. 4. Example of the test domain and Cb-TRAM for 14 July 2014. Yellow structures are CI objects detected by the new algorithm; blue structures are objects detected by the previous algorithm. Red and orange are the rapid-development and mature Cb objects, respectively.
4.2 Verification results
4.2.1 Normal scan mode
The results for daytime conditions in NS mode are investi-gated as total values over all seven test days, as sub-totals for the three synoptic conditions, and for each test day individ-ually. This is done to get an overall impression of the new detection algorithm compared to the existing one, and to ex-plore the behaviour under different synoptic weather condi-tions. The total values as listed in Table 4 show an increase in hits by 4 using the new algorithm instead of the existing one, a decrease in false alarms by 3108, and an increase in misses by 84. This manifests an improvement, but has to be put into perspective. POD, FAR, CSI and BIAS, also shown in Fig. 5, all reflect this improvement.
The striking charcteristic of both CI detections, as well as CI detection skill in general, is obviously a large FAR around 90 % (and relatedly a large BIAS) while the POD is 45 % at best. At this point, it must be emphasized that this is, on the one hand, owed to the choice of rather conservative verifi-cation definitions (Sect. 3.1); on the other hand, it is inher-ent to the involved physics. Usually a single thunderstorm’s strong updraft is preceded by a number of early less con-fined convective developments. Our verification method al-lows only an allocation of one CI object, which consists of
neighbouring pixels, to one thunderstorm object. From the whole area that shows signs of early development, usually only one object in the near surrounding is selected by very localized characteristics. The preferred CI object will soon dominate all other CI objects in the surrounding, as low-level convergence and upper-level divergence suppress other up-drafts. Consequently a large number of false alarms has to be expected. The mediocre POD is in part simply owed to the multi-cell nature of most storms in the analysis. Early devel-opment of a secondary cell is often masked by the preceding older cell’s later life cycle stages.
Fig. 5. POD, FAR, CSI and BIAS for the test days: green, red, blue and black lines, respectively. Dashed lines mark the original CI detection algorithm results, while the bold lines mark the new CI detection results; dotted lines in the left figure mark the new nighttime detection mode applied to the daytime data (using the five IR criteria only).
The CSI, combining F,H and M, increases from 7 to 13 %, a significant near doubling of CSI. This improvement in the overall forecasting behaviour also is reflected in the de-crease of the over-forecasting tendency from 320 to 146 %. Therefore, although still noisy, a clearer signal of potentially dangerous convective developments is provided by the new algorithm.
In the day-by-day analysis in Fig. 5 it can be seen that best day’s FAR is around 76 % and POD around 45 %, with worst day’s FAR at 95 % and POD at 15 %. BIAS does show a peak value at 12 June 2009 for both the new and previous detection scheme, while it does not vary much for the rest of the days. The newer method shows a higher or equal number of hits on 4 out of 7 days compared to the original CI detection, and a lower number of false alarms for all seven days. This results in a better FAR and CSI for all days and increased POD on 3 days. In order to take a closer look at the individual synoptic conditions, we have calculated total values for each synoptic class. In the following the individual day results are summarized first; afterwards a closer look at characteristics influences on the individual days is taken.
– A visual inspection (not shown) gives following typ-ical cloud structures: for the class of cold-front days there is a high amount of clouds visible, both convec-tive (especially Cb) and non-convecconvec-tive (cirrus or stra-tus). Therefore the satellite perspective on CI along the front is limited (e.g. due to prevailing cirrus shields of
mature Cb). Typical for the class of cold-air days is a honeycombed structure of many convective cells. Geo-stationary satellites provide a good view on CI that is very widespread under these unstable atmospheric con-ditions. For the class of high-pressure days fewer clouds are visible compared to the other two classes. Convec-tion mainly depends on the time of day.
Table 4. Categorical variables and statistics under daytime (07:00–17:00 UTC) conditions for the old and the new algorithm (old→new). Listed are the results for NS and RS mode for each of the test days as well as the results for the three synoptic classes. Hits, misses and false alarms are given as absolute numbers; POD, FAR, CSI and BIAS are expressed as a percentage. For each of the synoptic classes the average (av.) values are given.
Nr Date Hits False alarms Misses POD (in %) FAR (in %) CSI (in %) BIAS (in %)
Normal scan mode
all days (total) 538→542 5427→2319 1329→1413 28.8→27.7 91.0→81.0 7.4→12.7 320→146 cold front (av.) 85→90 598→359 250→262 25.4→25.6 87.6→80.0 9.1→12.7 204→128 1 26 May 2009 80→69 616→329 347→375 18.7→15.5 88.5→82.7 7.7→8.9 163→89 2 6 June 2010 53→48 471→253 127→141 29.4→25.4 89.9→84.0 8.1→10.9 291→159 3 3 July 2010 121→153 707→494 275→269 30.6→36.3 85.4→76.4 11.0→16.7 209→153 cold air (av.) 34→36 960→238 115→115 22.9→23.8 96.6→86.9 3.1→9.3 667→182 4 14 July 2010 65→68 713→402 224→223 22.5→23.4 91.6→85.5 6.5→9.8 269→162 5 12 June 2009 3→4 1206→73 5→6 37.5→40.0 99.8→94.8 0.2→4.8 15 113 →770
high pressure (av.) 78→100 857→384 176→200 30.7→33.3 91.7→79.3 7.0→14.6 368→161 6 25 June 2010 81→64 933→323 98→119 45.3→35.0 92.0→83.5 7.3→12.7 567→212 7 29 June 2010 135→136 781→445 253→280 34.8→32.7 85.3→76.6 11.5→15.8 236→140
Rapid scan mode
all days (total) 1599→2064 35 754→1 846 2141→2987 42.8→40.9 95.7→86.2 4.1→11.5 999→295 cold front (av.) 348→396 5244→2506 466→614 42.8→39.2 93.8→86.4 5.7→11.3 687→287 1 26 May 2009 280→273 6191→2004 418→554 40.1→33.0 95.7→88.0 4.1→9.6 927→275 2 6 June 2010 191→215 3742→1791 342→430 35.8→33.3 95.1→89.3 4.5→8.8 737.9→311 3 3 July 2010 573→701 5799→3722 639→857 47.3→45.0 91.0→84.2 8.2→13.3 526→284
cold air (av.) 173→327 6395→1893 438→457 38.7→41.7 97.4→85.3 2.5→12.2 1469→283 4 14 July 2010 244→565 5093→2912 388→760 38.6→42.6 95.4→83.8 4.3→13.3 845→262 5 12 June 2009 101→88 7696→874 159→154 38.8→36.4 98.7→90.9 1.3→7.9 2999→398
high pressure (av.) 210→222 7233→1543 195→232 51.9→48.9 97.2→87.4 2.8→11.1 1838→389 6 25 June 2010 210→222 7233→1543 195→232 51.9→48.9 97.2→87.4 2.8→11.1 1838→389
– A closer look at the 12 June 2009 case shows convec-tive cells over large parts of central Europe as a result of instability due to advection of cold air masses and sur-face heating, with the typical honeycomb structure of convective cells, but nearly no further development to stage 2 or 3 occurred during the whole day. The origi-nal Cb-TRAM CI detection generates many false alarms and only three hits. The latter are connected with some scattered cells in Spain. The new detection algorithm detects one more hit, but it shows a drastic 16-fold de-crease in false alarms. In this case it is obvious that the small number of hits distorts the significance of POD and FAR on this day. Although the number of false alarms decreases by 1133, i.e. decisively, the FAR only decreases by 5 %.
– The other day in this test sample which is worth con-sidering more closely is 3 July 2010. This day pro-vides a rather untypical increase in hits, compared to the other cold front and even all days evaluated. A vi-sual inspection shows CI primarily at a convergence line ahead of the front and a lot of CI objects over the Alps. An unobstructed satellite view on these developments together with the sustained lifting mechanism leads to
many successful CI detections.The main difference to the original detection scheme seems to be the improved detection of orographically induced CI. This results in an increased number of hits, but also a reduction of false alarms.
– Although the synoptic classes are arranged by their dominant similarities, some special features can occur on individual days. The reduction of false alarms is es-pecially high on the cold-air day of 12 June 2009 and the two high-pressure days, with the false alarms reduced to the third on 25 June 2010. A visual inspection shows that the eastern part of the domain on the latter day is also influenced by a cold-core low.
Summarizing for cases with cold air masses, the criteria of the new CI detection algorithm result in a drastically reduced number of false alarms. But false alarms also decreased on the other test days by a significant amount.
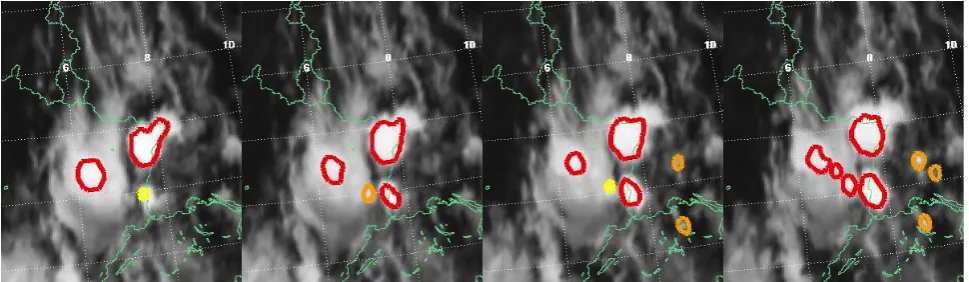
Fig. 6. Development of new thunderstorm cells in an orographic environment over the Black Forest and Jura Mountains in the night of 3 July 2010 between 22:30 and 23:15 UTC. The plots show the cell objects as polygons in the same colours as in Cb-TRAM (yellow: CI; orange: rapid development; red: mature thunderstorm) on top of the IR10.8 satellite images.
data; i.e. only the the five IR criteria are used. As can be seen in Fig. 5, there is only a slight difference between day- and nighttime detection for FAR, CSI and BIAS compared to the improvements achieved by the new method. The main dif-ference lies in a reduction in POD (excluding day 5), as ex-pected due to the missing HRV information, but at the same time the FAR is slightly reduced also.
At nighttime over land a general decrease of convective ac-tivity is observed (as in this investigation). Missing radiation and a stable boundary layer result in unfavourable conditions for the formation of convection. Due to the lower activity at nighttime the values of POD, FAR and CSI show poorer values compared to daytime as early developments (CI) tend to “die out” over night. Newly forming convective cells are interrupted in their development cycle at nightfall if no dy-namic trigger is active. This results in increased number of false alarms.
The total results over all test nights (00:00–07:00 UTC and 17–00:00 UTC) show a POD of 13 %, a FAR of 90 % and a CSI of 6 %. The POD, CSI and FAR values for most days are very similar, except day 5. This day shows a very high FAR and a low POD. This can be explained by the very small num-ber of cases in these values. Nearly no convective activity oc-curs during this night due to missing forcing. Consequently the number of false alarms is the smallest of all nights, too. In the high-pressure cases a visual inspection provides the trend of decreasing CI activity after sunset. Although this is the case, referring to the best POD and FAR values for high-pressure situations, these seem to give the best possibility of detecting remaining cells. Considering the longer time frame for night (14 h), and that activity at the onset of night may be still higher than later at night, the tendency of decreasing activity at nighttime can still be seen by the smaller num-ber of hits and misses (representing the total active cells). In our set of test days also some days with nighttime forcing are present. An example of a cell development at nighttime observed with the new detection algorithm in Cb-TRAM is
given in Fig. 6. New convective cells over the Black Forest and the Jura Mountains develop after sunset. In general, the CI detection at nighttime is most promising when synoptic dynamic or orographic triggers are present.
4.2.2 Rapid scan mode
In SEVIRI RS mode, the repeat cycle for new satellite im-ages is 5 min instead of 15 min. Therefore a three times bet-ter temporal coverage is reached compared to NS. It seems obvious that this should improve the possibility of detect-ing and trackdetect-ing especially rapidly changdetect-ing cloud processes such as CI. This should therefore manifest in a higher num-ber of detected hits. In the following a comparison of the results of the RS detections of CI using the original and the new detection scheme is presented first. The basis is six of the seven test days presented for the NS analysis before. Data for 29 June 2010 shows too many gaps and is therefore omitted. The eventual benefits of RS versus NS are explored afterwards.
Table 5. Categorical variables and statistics under nighttime (00:00–07:00 UTC, 17:00–00:00 UTC) conditions for the new algorithm. Hits, misses and false alarms are given as absolute numbers; POD, FAR, CSI and BIAS are expressed as a percentage. For each of the synoptic classes the average (av.) values are given.
Normal scan mode
Nr Date Hits False alarms Misses POD (in %) FAR (in %) CSI (in %) BIAS (in %)
– all days 164 1543 1076 13.2 90.4 5.9 138
– cold front (av.) 31 295 198 13.5 90.5 5.9 142
1 26 May 2009 20 195 190 9.5 90.7 5.0 102
2 6 June 2010 39 369 202 16.2 90.4 6.4 169
3 3 July 2010 34 322 202 14.4 90.5 6.1 151
– cold air (av.) 11 171 89 11.0 94.0 4.1 182
4 14 July 2010 21 295 150 12.3 93.4 4.5 185
5 12 June 2009 1 47 27 3.6 98.0 1.3 171
– high pressure (av.) 25 158 153 14.0 86.3 7.4 103
6 25 June 2010 27 161 164 14.1 85.6 7.7 98
7 29 June 2010 22 154 141 13.5 87.5 6.9 108
Rapid scan mode
– all days (total) 1275 10968 2795 31.3 89.6 8.5 301
– cold front (av.) 266 2375 589 31.1 89.9 8.2 309
1 26 May 2009 96 1786 542 15.0 94.9 4.0 295
2 6 June 2010 383 2755 692 35.6 87.8 10.0 292
3 3 July 2012 319 2585 533 37.4 89.0 9.3 341
– cold air (av.) 173 1405 372 31.7 89.0 8.9 290
4 14 July 2010 256 1948 482 34.7 88.4 9.5 299
5 12 June 2009 89 862 259 25.6 90.6 7.4 273
– high pressure (av.) 141 1032 285 33.1 88.0 9.7 275
6 25 June 2010 141 1032 285 33.1 88.0 9.7 275
increases due to the larger number of timesteps investigated, and more short-living convective storms can be observed.
Under daytime conditions the sum for all six RS test days shows an increase of hits by 465, a decrease of false alarms by 22 908 (relative decrease of more than 60 %) and an in-crease of misses, comparing original and new algorithm. The increase of misses is a technical side effect which results from an increased number of stage 2 and 3 cell objects. Al-though the detection of stage 2 and 3 itself is not modified, changes of stage 1 detection influence the stage 2 and 3 ob-jects. Each object includes all neighbouring pixels with all earlier detection stages. Missing stage 1 pixels formerly con-necting stage 2 and 3 pixels lead to a breaking up of these stage 2 and 3 objects into more individual objects. This re-sults in a higher amount of misses. This issue is more pro-nounced in RS mode, but also is observed in NS mode. This effect leads to the slight decrease of POD on 4 of 6 days al-though the number of hits increases on 5 days. FAR decreases from 96 to 86 %, CSI increases from 4 to 11.5 %, BIAS de-creases from 999 to 295 %. The number of hits inde-creases for 4 out of the 6 days, while it shows a decrease on 2 days. False alarm numbers are improved for all 6 days. On 12 June 2009 only about 10 % of the original false alarms remain. Best values of POD (around 50 % for RS) were found for the
previous and new algorithm under high-pressure conditions. With almost a doubling of hits, the biggest increase in POD is yielded for cold-air cases here. Applying the new detec-tion method, a decrease of POD for the two other classes is observed. This is due to the discussed technical issue result-ing in more misses. Best FAR values for the previous algo-rithm are found for cold-front cases. Applying the new al-gorithm, best FAR values are found for the cold-air cases. The improvement of FAR for the cold-air cases is the best of all three classes, comparing the old and new algorithm. The same is true for CSI values. This supports the NS results, where the FAR improved mainly for the cold air mass condi-tions as well. In Fig. 5 it is obvious that the overall behaviour of FAR, POD, CSI and BIAS does not show any major dif-ferences between day and night.
increase of detectable cells in RS mode, we achieved a lower BIAS compared to the previous algorithm in NS mode. A forecaster using the new algorithm will get a clearer picture of the situation updated every 5 min. For the new algorithm compared between NS and RS, BIAS is a factor of 2 higher in RS mode. This is due to the higher number of hits and the higher chance of providing false alarms. We observe higher POD values for all three synoptic classes in RS compared to NS mode. FAR and CSI are only better for the cold-air class. With the drastically decreasing number of false alarms and the related reduction of tracking processes for these cells, we also obtain an improvement in processing time. This is an important point for a nowcasting tool providing real-time warnings.
5 Conclusions
By combination of the strengths of two existing detection al-gorithms (Cb-TRAM by Zinner et al., 2008, and SATCAST by Mecikalski and Bedka, 2006) for geostationary satellite data, a new detection scheme for CI has been developed and implemented in Cb-TRAM. A set of criteria from the SAT-CAST CI detection, using thermal IR channel measurements for one point in time as well as a derived time trend, has been combined with detailed cloud motion and deformation fields from the Cb-TRAM pyramidal matching algorithm. In the latter an optical-flow-based method is of special impor-tance for the derivation of detailed cloud top cooling trends. A pixel-by-pixel analysis of six different CI tests using the channels WV6.2 and IR10.8, and during daytime includ-ing the HRV became possible this way. In order to reduce the number of false detections decisively, an additional pre-selection of convective clouds with an IF mask excludes all areas with non-convective clouds.
The convective cloud IF mask is limited to clouds which are cold, bright, and show enough small-scale texture (in IR10.8, in HRV, and in WV7.3 and IR10.8, respectively). On this IF mask, the set of six CI criteria aims to assess the typ-ical signatures of quickly developing convective cells at an early stage, such as strong updrafts resulting in strong cloud top cooling and increasing cloud top height.
Two criteria use IR10.8 time trends over different peri-ods of time. The drop of temperature below freezing level is analysed, as well as the value of the difference between WV6.2 and IR10.8 and their time trend. Finally the original Cb-TRAM criterion for CI is included which requires simul-taneous brightening in the HRV and cooling in the IR10.8. A scoring system connects different criteria: pixels are con-sidered to display CI in a satellite scene if five out of six possible criteria are met during daytime; at nighttime all five IR criteria have to be met.
For the analysis of the skill of the original and the newly developed methods, a verification of the CI detections against later stages of the convective life cycle has been used. For
that purpose the further development to the subsequent life cycle stages “rapid cooling” and “mature thunderstorm” within Cb-TRAM has been investigated. Cb-TRAM cell ob-jects which show further development after CI detection within 60 min are considered a hit, missing further develop-ment a false alarm, and a missing CI detection within 60 min before further development a miss. By means of POD, FAR, CSI, and BIAS seven test days and nights are analysed for NS and six for RS METEOSAT SEVIRI data.
The main results are as follows:
– FAR for NS mode under daytime conditions decreases from 91 to 81 %, and CSI increases from 7.4 to 12.7 %, while BIAS is reduced from 320 to 146 %, using the new detection algorithm instead of the original Cb-TRAM method. Thus an improvement for all these sta-tistical verification values is reached. POD decreases slightly although the number of detected hits are in-creasing. This is due to a technical side effect concern-ing detection of misses in Cb-TRAM.
– Considering each day individually FAR and CSI show improvement for each day, POD for three out of seven days.
– The CI detection newly implemented in Cb-TRAM shows a reduction of false alarms for all test days, both for NS (15 min data) and RS (5 min), when compared to the original detection.
– The decline in false alarms is most prominent for synop-tic conditions within cold-core lows that produce a lot of convective cells in NS and RS mode.
conditions for convection, could stop the development at any time of the cell life cycle.
Together with the choice of the verification method, this all sets narrow boundaries for the quality values possible. Since the verification is done by investigating the further de-velopment of each CI object against the detections for rapid-development and mature-thunderstorm objects within Cb-TRAM, the results also depend on the quality of these detec-tions. For 77 % of all mature-thunderstorm objects, an over-lap with lightning was found in Zinner et al. (2013). Some CI cell objects within an area of rapidly growing cumulus clouds may be classified as false alarms in a conservative verification setup. Here we track each object’s development history individually. It could be equally legitimate to clas-sify a whole area of multiple CI objects as hits if only one single strong thunderstorm develops out of the area. Walker et al. (2012) implemented an object-tracking method based on Zinner et al. (2008) and verified the cell objects against radar data. Taking into account all of the cell objects, he re-ceived a POD value of 32 % comparable to our outcome. The FAR of 55 % is lower than in our study but has to be put into perspective. Walker et al. (2012) use a manual search in the surrounding area which is less strict than our automated tracking.
While the number of hits did increase only slightly for some of the days, the decline of false alarms is the clear-est improvement as far as the comparison to the original CI detection within Cb-TRAM is concerned. As shown, this de-crease is more pronounced for days classified as cold air. These days strongly influence the total values for all days. The omission of tracking false alarm cells also results in an improvement of calculation time. The calculated statistical values of POD, FAR and CSI and BIAS depend on the num-bers of hits, misses and false alarms. Especially for a low total number of observed objects these skill values tend to be very sensitive to small changes of the latter categorial variables.
Calculations for different synoptic groups depend on the possibility of distinguishing synoptic patterns for the whole domain. Although this was possible for most of the days used here, mixed situations occur (e.g. 14 July 2010). Longer time series would be desirable to corroborate the results found in this study.
The detection of CI in general is highly dependent on cloud top cooling trends. These, on the other hand, rely on the disparity vector field. Advection of optically thin cirrus clouds over cumulus clouds can lead to apparent cloud top cooling values which are not an effect of rising cloud tops. Although the presented method uses an optical flow method, incorrect vectors within the field can obviously not be ruled out. This may lead to situations where false alarms are diag-nosed which are actually only an effect of erroneous cooling trends and not thunderstorms.
Due to the geostationary position of Meteosat satellites, the best horizontal resolution is available at the equator,
decreasing with higher latitudes. For Europe this results in a reduced horizontal resolution by a factor of about 1.5. The actual resolution for HRV is about 1.5 km×1.5 km and 4 km×6 km for the standard-resolution Meteosat channels for Europe. Therefore few details are visible which are of particular importance for small-scale developments like CI.
The oblique viewing angle around 50◦ also affects the observation of cloud tops. More and more cloud side in-formation influences the measured signal and the derived cloud top temperatures. Therefore the thresholds suggested by Mecikalski and Bedka (2006) may be slightly shifted for higher latitudes. Using strict thresholds does also not account for developments just below these given limits. Thus some hits can be missed.
Considering the difficulties arising when detecting and verifying CI, this leads to the question of how these could be further improved. Investigating microphysical properties for convective clouds at/near the cloud top using satellite data as done by Mecikalski et al. (2011) could improve the under-standing of in-cloud processes during convection and there-fore help to find typical patterns that can be used for CI de-tection. Application of stability data fields provided by satel-lites or NWP model outputs may help to reduce the amount of false alarms. One can also think of other strategies to com-bine different criteria for CI detection, e.g. using fuzzy logic as in Cb-TRAM. Another approach for verification could be to soften the object cell perspective and verify whole areas where CI takes place.
Acknowledgements. EUMETSAT and DLR Oberpfaffenhofen are acknowledged for providing SEVIRI data. We thank Dennis Stich for the fruitful discussions. We thank two anonymous reviewers for improving this paper. This manuscript is dedicated to the memory of our colleague Hermann Mannstein, who died unexpectedly and much too early on 25 January 2013. He was a scientific innovator behind many cloud remote sensing activities at DLR over nearly three decades. Among other things, he developed the Cb-TRAM core algorithms. He will be deeply missed as expert, advisor and friend.
Edited by: S. Malinowski
References
Bedka, K. M. and Mecikalski, J. R.: Application of Satellite-Derived Atmospheric Motion Vectors for Estimating Mesoscale Flows, J. Appl. Meteorol., 44, 1761–1772, 2005.
Berendes, T. A., Mecikalski, J. R., MacKenzie, W. M., Bedka, K. M., and Nair, U. S.: Convective cloud identification and classification in daytime satellite imagery using standard devia-tion limited adaptive clustering, J. Geophys. Res., 113, D20207, doi:10.1029/2008JD010287, 2008.
Crook, N. A.: Sensitivity of moist convection forced by bound-ary layer processes to low-level thermodynamic fields, Mon. Weather Rev., 124, 1768–1785, 1996.
Done, J., Davis, C. A., and Weisman, M.: The next generation of NWP: explicit forecasts of convection using the weather research and forecasting (WRF) model, Atmos. Sci. Lett., 5, 110–117, doi:10.1002/asl.72, 2004.
Forster, C. and Tafferner, A.: An integrated user-oriented weather forecast system for air traffic using real-time observations and model data, in: Proceedings of the European Air and Space Con-ference (CEAS), 26–29 October 2009, Manchester, UK, 2009. Forster, C. and Tafferner, A.: Nowcasting Thunderstorms for
Mu-nich Airport, DLR-Forschungsbericht, Deutsches Zentrum f¨ur Luft- und Raumfahrt e.V., Bibliotheks- und Informationswesen, K¨oln, 2012.
Kober, K. and Taffener, A.: Tracking and nowcasting of convective cells using remote sensing data from radar and satellite, Meteo-rol. Z., 1, 075–084, 2009.
Lang, P. (Ed.): Cell tracking and warning indicator derived from operational radar products, Proceedings of the 30th International Conference on Radar Meteorology, Munich, Germany, 2001. Mecikalski, J. R. and Bedka, K. M.: Forecasting Convective
Initi-ation by Monitoring the Evolution of Moving Cumulus in Day-time GOES Imagery, Mon. Weather Rev., 134, 49–78, 2006. Mecikalski, J. R., Berendes, T. A., Feltz, W. F., Bedka, K. M.,
Bedka, S. T., Murray, J. J., Wimmers, A. J., Minnis, P., Johnson, D. B., Haggerty, J., Bernstein, B., Pavolonis, M., and Williams, E.: Aviation Applications for Satellite-Based Observations of Cloud Properties, Convection Initiation, In-Flight Icing, Turbu-lence, and Volcanic Ash, B. Am. Meteorol. Soc. 88, 1589–1607, doi:10.1175/BAMS-88-10-1589, 2007.
Mecikalski, J. R., Bedka, K. M., Paech, S. J., and Litten, L. A.: A Statistical Evaluation of GOES Cloud-Top Properties for Now-casting Convective Initiation, Mon. Weather Rev., 136, 4899– 4914, 2008.
Mecikalski, J. R., MacKenzie Jr., W. M., Koenig, M., and Muller, S.: Cloud-Top Properties of Growing Cumulus prior to Convective Initiation as Measured by Meteosat Second Generation, Part I: Infrared Fields, J. Appl. Meteorol. Clim., 49, 521–534, 2010. Mecikalski, J. R., Watts, P. D., and Koenig, M.: Use of Meteosat
Second Generation optimal cloud analysis fields for understand-ing physical attributes of growunderstand-ing cumulus clouds, Atmos. Res., 102, 175–190, 2011.
Merrill, R. T., Menzel, W. P., Baker, W., Lynch, J., and Legg, E.: A report on the recent demonstration of NOAA’s upgraded capa-bility to derive satellite cloud motion winds, B. Am. Meteorol. Soc., 72, 372–376, 1991.
Morel, C. and S´en´esi, S.: A climatology of mesoscale convective systems over Europe using satellite infrared imagery, I: Method-ology, Q. J. Roy. Meteorol. Soc., 128, 1953–1971, 2002. Mueller, C. K., Saxen, T., Roberts, R., Wilson, J., Betancourt, T.,
Dettling, S., Oien, N., and Yee, J.: NCAR Auto-Nowcast system, Weather Forecast., 18, 545–561, 2003.
Murray, J. J.: Aviation weather applications of Earth Science Enter-prise data, Earth Observ. Mag., 11, 27–30, 2002.
Reinhardt, B. and Dotzek, N.: Validation of the MSG Convection Initiation Product (Final Report), Tech. rep., EUMETSAT Con-tract EUM/CO/09/4600000642/MK, available from EUMET-SAT, 2010.
Roberts, R. D. and Rutledge, S.: Nowcasting Storm Initiation and Growth Using GOES-8 and WSR-88D Data, Weather Forecast., 18, 562–584, 2003.
Roebber, P. J.: Visualizing multiple measures of forecast quality, Weather Forecast., 24, 601–608, 2009.
Tafferner, A., Forster, C., Senesi, S., Guillou, Y., Laroche, P., De-lannoy, A., Lunnon, B., Turb, D., Hauf, T., and Markovic, D.: Nowcasting thunderstorm hazards for flight operations: the Cb-WIMS approach in FLYSAFE, in: Proc. 26th Int. Congress of the Aeronautical Sci. (ICAS), 14–19 September 2008, Anchor-age, Alaska, 2008.
Tang, Y., Lean, H. W., and Bornemann, J.: The benefits of the Met Office variable resolution NWP model for forecasting convec-tion, Meteorol. Appl., doi:10.1002/met.1300, in press, 2012. Velden, C. S., Hayden, C. M., Nieman, S. J., Menzel, W. P.,
Wanzong, S., and Goerss, J. S.: Upper-Tropospheric Winds Derived from Geostationary Satellite Water Vapor Observa-tions, B. Am. Meteorol. Soc., 78, 173–195, doi:10.1175/1520-0477(1997)078<0173:UTWDFG>2.0.CO;2, 1997.
Velden, C. S., Olander, T. L., and Wanzong, S.: The Impact of Multi-spectral GOES-8 Wind Information on Atlantic Tropical Cyclone Track Forecasts in 1995, Part I: Dataset Methodology, Descrip-tion, and Case Analysis, Mon. Weather Rev., 126, 1202–1218, doi:10.1175/1520-0493(1998)126<1202:TIOMGW>2.0.CO;2, 1998.
Walker, J. R., MacKenzie, W. M., Mecikalski, J. R., and Jewett, C. P.: An Enhanced Geostationary Satellite-Based Convective Initiation Algorithm for 0–2-h Nowcasting with Object Tracking, J. Appl. Meteorol. Clim., 51, 1931–1949, doi:10.1175/JAMC-D-11-0246.1, 2012.
Weckwerth, T. M. and Parsons, D. B.: A Review of Convection Ini-tiation and Motivation for IHOP2002, Mon. Weather Rev., 134, 5–22, 2006.
Wilson, J. W. and Mueller, C. K.: Nowcasts of Thunderstorm Initi-ation and Evolution, Weather Forecast., 8, 113–131, 1993. Zinner, T., Mannstein, H., and Tafferner, A.: Cb-TRAM: Tracking
and monitoring severe convection from onset over rapid devel-opment to mature phase using multi-channel Meteosat-8 SEVIRI data, Meteorol. Atmos. Phys., 101, 191–210, 2008.