www.atmos-meas-tech.net/9/2291/2016/ doi:10.5194/amt-9-2291-2016
© Author(s) 2016. CC Attribution 3.0 License.
Atmospheric mercury measurements onboard the
CARIBIC passenger aircraft
Franz Slemr1, Andreas Weigelt2,a, Ralf Ebinghaus2, Hans H. Kock2, Jan Bödewadt2, Carl A. M. Brenninkmeijer1, Armin Rauthe-Schöch1, Stefan Weber1,b, Markus Hermann3, Julia Becker4, Andreas Zahn4, and Bengt Martinsson5
1Max-Planck-Institut für Chemie (MPIC), Hahn-Meitner-Weg 1, 55128 Mainz, Germany
2Helmhotz-Zentrum Geesthacht, Institut für Küstenforschung, Max-Planck-Straße 1, 21502 Geesthacht, Germany 3Leibniz-Institut für Troposphärenforschung, Permoserstrasse 15, 04318 Leipzig, Germany
4Institut für Meteorologie und Klimaforschung (IMK-ASF), Karlsruhe Institut für Technologie,
Hermann-von-Helmholtz-Platz 1, 76344 Leopoldshafen, Germany
5University of Lund, Division of Nuclear Physics, P.O. Box 118, 22100, Lund, Sweden
anow at: Bundesamt für Seeschifffahrt und Hydrographie (BSH), Wüstland 2, 22589 Hamburg, Germany
bnow at: Hessisches Landesamt für Umwelt und Geologie (HLUG), Rheingaustrasse 186, 65203 Wiesbaden, Germany
Correspondence to:Franz Slemr (franz.slemr@mpic.de)
Received: 3 December 2015 – Published in Atmos. Meas. Tech. Discuss.: 18 January 2016 Revised: 6 April 2016 – Accepted: 5 May 2016 – Published: 24 May 2016
Abstract. Goal of the project CARIBIC (Civil Aircraft for the Regular Investigation of the atmosphere Based on an In-strumented Container) is to carry out regular and detailed ob-servations of atmospheric composition (particles and gases) at cruising altitudes of passenger aircraft, i.e. at 9–12 km. Mercury has been measured since May 2005 by a mod-ified Tekran instrument (Tekran Model 2537 A analyser, Tekran Inc., Toronto, Canada) during monthly intercontinen-tal flights between Europe and South and North America, Africa, and Asia. Here we describe the instrument modifica-tions, the post-flight processing of the raw instrument signal, and the fractionation experiments.
1 Introduction
The biogeochemical cycle of mercury has attracted much in-terest because of the bioaccumulation of the highly neuro-toxic methyl mercury in the aquatic nutritional chain to con-centrations harmful for humans and animals (e.g. Mergler et al., 2007; Scheuhammer et al., 2007; Lindberg et al., 2007, and references therein). The concern about adverse envi-ronmental impacts of mercury prompted the United Nations Environment Programme (UNEP) to undertake a global as-sessment of mercury and its compounds in the environment,
which resulted in the Minamata Convention on Mercury (www.mercuryconvention.org) in 2013.
small gradients within the hemispheres, suggest that its at-mospheric residence time is of the order of 1 year (Slemr et al., 1985). GEM thus has to be oxidized to GOM and PM for removal from the atmosphere. Three mechanisms to oxidize elemental mercury to Hg2+compounds have been proposed (reactions with O3, OH, and Br), but their relative
contribu-tions are still not well known (Lin et al., 2006; Lindberg et al., 2007, Hynes et al., 2009).
Due to its rather long atmospheric residence time GEM will reach the stratosphere. The information on the behaviour of mercury in the upper troposphere and lower stratosphere (UT–LS) is tenuous because of lack of measurements due to instrumental limitations. Only recently has the progress in measurement techniques enabled extensive but short-term aircraft measurements of mercury distribution in the tropo-sphere and lower stratotropo-sphere (Ebinghaus and Slemr, 2000; Friedli et al., 2003a, b, 2004; Banic et al., 2003; Ebinghaus et al., 2007; Radke et al., 2007; Talbot et al., 2007, 2008; Swartzendruber et al., 2008, 2009a; Slemr et al., 2009, 2014; Lyman and Jaffe, 2012; Brooks et al., 2014; Ambrose et al., 2015; Shah et al., 2016; Weigelt et al., 2016). All observa-tions have so far shown a pronounced decrease of gaseous mercury (GEM+GOM) concentrations in the lower strato-sphere (Ebinghaus et al., 2007; Radke et al., 2007; Talbot et al., 2007; Slemr et al., 2009; Lyman and Jaffe, 2012), which implies a conversion to PM. This implication is supported by observations of high PM concentrations in the lower strato-sphere but not in the upper tropostrato-sphere (Murphy et al., 1998, 2006). However, the mechanism of this conversion and its importance for the atmospheric mercury cycle is not known. Since May 2005 mercury has been measured during monthly CARIBIC (Civil Aircraft for the Regular Investiga-tion of the Atmosphere Based on an Instrumented Container; Brenninkmeijer et al., 2007) flights. The objective of these measurements is to gain information on the worldwide dis-tribution of mercury in the UT–LS (Slemr et al., 2009) and on mercury emissions from biomass burning and other sources (Ebinghaus et al., 2007; Slemr et al., 2014). Here we describe the mercury instrumentation, present a method for post-flight data processing, and discuss the results of several fractiona-tion experiments.
2 The CARIBIC container
Since December 2004 a new CARIBIC container (Bren-ninkmeijer et al., 2007; www.caribic-atmospheric.com) on-board a Lufthansa Airbus A340-600 has been flown monthly on intercontinental flights. The routes of the flights starting in Frankfurt or Munich with destinations in North and South America, Africa, and East and South Asia can be found at www.caribic-atmospheric.com. Typically, a sequence of four individual flights is flown every month. A modified freight container holds automated analysers for gaseous mercury, CO, O3, NO, NOy, CO2, total and gaseous water vapour,
oxygenated organic compounds, and fine particles (three
counters for particles with diameters > 4, > 12, and > 18 nm), as well as one optical particle size spectrometer for particles with diameters > 140 nm (Hermann et al., 2016). In addition, air and aerosol particle samples are taken and analysed after the flight for greenhouse gases, halocarbons, hydrocarbons, and particle elemental composition and morphology (Bren-ninkmeijer et al., 2007). Between the end of 2009 and spring of 2010 several instruments were replaced by improved ones and some new instruments were added. In the context of this paper the most important changes are the replacement of the malfunctioning optical particle size spectrometer (OPSS) and the addition of a whole-air sampler with a capacity of 88 samples. The improved and extended instrumentation has been in use since May 2010. In summer 2014, a single-particle soot photometer (SP2) instrument was added.
The inlet system with four separate inlets for aerosols, trace gases, total water, and gaseous water and the con-tainer plumbing are described in detail by Brenninkmeijer et al. (2007) and Slemr et al. (2009). Briefly, the trace gas probe consists of a 30 mm inner diameter diffuser tube with a forward-facing inlet orifice of 14 mm diameter and outlet orifice of 12 mm, diameter providing an effective ram pres-sure of about 90–170 hPa depending on cruising altitude and speed. This ram pressure forces about 100 L min−1of ambi-ent air through PFA tubing (3 m long, 16 mm ID PFA-lined tube) connecting the inlet and the container and 1.5 m long 16 mm ID PFA tubing within the container to the instrument manifold, all heated to∼40◦C. The air sample for the mer-cury analyser is taken at a flow rate of 0.5 L (STP) min−1 (STP: p=1013.25 hPa, T =273.15 K) from the manifold using the 4 mm ID PFA tubing heated by the energy dissi-pated in the container to about 30◦C. The arrangement is similar to that described by Talbot et al. (2008) and was optimized to transmit highly sticky HNO3(Neuman et al.,
1999). The large flow through the trace gas diffuser tube of more than 2000 L min−1and perpendicular sampling at much smaller flow rates of about 100 L min−1discriminate against particles larger than about 1 µm diameter (50 % aspiration efficiency; Baron and Willeke, 2001). But particles smaller than 0.5 µm will pass into the manifold in the container.
Figure 1.Flow scheme of the modified CARIBIC mercury instru-ment.
3 Mercury instrument and its modifications
The mercury instrument is based on an automated dual-channel, single-amalgamation, cold vapour atomic fluores-cence analyser (Tekran Model 2537 A, Tekran Inc., Toronto, Canada), and its flow scheme is shown in Fig. 1. The instru-ment features two gold cartridges. While one is adsorbing mercury during a sampling period, the other is being ther-mally desorbed using argon as a carrier gas. Mercury is de-tected using cold vapour atomic fluorescence spectroscopy (CVAFS), which responds only to GEM. However, mercury compounds collected by the gold cartridge were found to be converted to elemental mercury probably during the ther-modesorption and will thus be detected as well (Slemr et al., 1978, 1979). The functions of the cartridges are then inter-changed, allowing continuous sampling of the incoming air stream.
After switching on the instrument, the sampling lines are flushed for 240 s with ambient air made mercury free by an activated charcoal filter (carbon filter in Fig. 1). After that the instrument changes to measurement mode. The sample air is directed to the gold cartridges either directly or via a quartz wool trap (15 cm long and 2 cm diameter quartz glass tube packed with ca 5 g cleaned quartz wool). Lyman and Jaffe (2012) showed that a quartz wool trap removes GOM and aerosol particles (i.e. PM) but no GEM. We make a similar assumption for the removal of GOM in our system and, therefore, presume that the CARIBIC mercury analyser can measure only GEM with the trap or GEM+GOM+PM (PM measurement capability will be discussed in Sect. 6) without it. On flights from Germany to a certain destina-tion GEM is measured, and on the return flights total mer-cury (TM=GEM+GOM+PM). A 45 mm diameter PTFE pre-filter (pore size 0.2 µm) protects the sampling cartridges
against contamination by particles which pass through the in-let system. To ensure a proper sample air flow of 0.5 L min−1
(STP) even at a flight level of 12 km (200 hPa), a second di-aphragm pump (Neuberger Model KNF UN89 KTDC) was installed at the inlet of the instrument until May 2011. It was tested for contamination and losses of mercury, and none were found. Since June 2011 this pump has been moved downstream of the original internal Tekran pump as shown in Fig. 1. The pumping speed of both pumps is controlled by the flow meter. A buffer volume between the valve and the flow meter reduces the pump-induced pressure oscillation which might bias the flow meter reading. If the instrument is switched off, the valve between the volume and the pump is closed to ensure that no air is pulled through the mercury analyser to the other CARIBIC instruments. To avoid con-tamination of the instrument and of the tubing connecting the sampling manifold with the instrument during ascents and descents in heavily polluted areas near most of the larger air-ports, the sampling pumps are switched on only at ambient pressure below 500 hPa. Consequently, only measurements above an altitude of about 5 km are available.
With changing flight level the pressure in the aircraft cargo bay and therefore the pressure in the CVAFS detector cell changes. As the response signal of the CVAFS is pressure dependent (Ebinghaus and Slemr, 2000; Talbot et al., 2007), we keep the pressure in the detection cell constant using a pressure controller (Bronkhorst EL-PRESS P-702CV) down-stream of the detection cell. The pressure controller was set to a constant upstream pressure value of 1013 hPa.
A data acquisition computer was added to the Tekran in-strument to control the inin-strument, to record data from the instrument as well as from the additional sensors (pressure, temperature, valve position), and to communicate with the CARIBIC master computer which controls the operation of all instruments in the container. Initially we used a data ac-quisition computer (DAQ; ICP COM 7188) which, unfor-tunately, was too slow to record both the Tekran internally processed data and so-called “raw data dump” output (raw detector signal with 10 Hz resolution). In February 2014 we replaced the computer by a CompactRIO DAQ (National In-struments). Since then the recorded raw data dump signal can be viewed and processed after the monthly flight sequence, as described in Sect. 4.
Including all components the modified instrument has a to-tal weight of 36 kg. The power consumption in measurement mode is 300 W. The instrument meets the DO160-E limits on emitted and conducted electromagnetic radiation which is required for the certification of the instrument for operation onboard passenger aircraft.
To reduce the number of high-pressure cylinders in the container, the instrument was initially operated with a gas mixture of 0.25 % CO2in argon used also as an operating gas
for the CO instrument. As the addition of CO2to argon
Figure 2.Internal default integration of mercury peaks at mercury loads of less than 10 pg. The peak of 0.8 pg load can be integrated offline with an uncertainty of less than 10 %, but it was not detected by the internal default integration. Abscissa in 0.1 s units, ordinate in relative units.
sampling time (corresponding to∼225 km flying distance) until March 2006 and with 10 min until June 2007. Since Au-gust 2007, CO2has been removed from argon by an cartridge
filled with X10 molecular sieve. The corresponding sensitiv-ity gain enabled us to run the instrument with 5 min sampling (corresponding to∼75 km flying distance). To improve the detection limit and the precision of the measurements, we re-turned to 10 min sampling in the flights between August 2011 and January 2014. Since February 2014 the instrument has been run again with 5 min resolution. All mercury concentra-tions are reported here in ng Hg m−3(STP, i.e. 1013.25 hPa and 273.15 K).
The instrument is calibrated after every other monthly flight sequence by comparing its ambient air measurements in the laboratory with simultaneous measurements by a care-fully calibrated reference Tekran instrument. The reference instrument has an internal permeation source whose perme-ation rate is determined by injections of known mercury amounts every year. Calibration during the flight using the internal permeation device was not attempted because un-avoidable power and carrier gas flow interruptions and am-bient pressure changes prevent reaching a stable permeation rate.
4 Post-flight data processing
res-olution of 5 min). The Tekran raw signal is available only from February 2014, but because of missing raw signal data for the calibration before February 2014 only the data from April 2014 onward (i.e. since CARIBIC flight 468) could be processed.
The uncertainty of the offline integration is < 0.1 pg, which can be also considered as a detection limit. Relative to the median sampling volume of 1.7 L (STP) with 5 min sampling time during CARIBIC flights 468–532 (April 2014–January 2016) concentrations of around 0.05 ng m−3can be detected. This is a substantial improvement against the instrument de-fault integration with the detection limit of∼0.5 pg. In more than 6000 offline-processed measurements during flights 468–532 we have not found a single peak which could not be integrated by our offline procedure, despite many mea-surements in the deep stratosphere (i.e. O3> 300 ppb and
po-tential vorticity of up to 11 PVU) during the flights to San Francisco, Tokyo, and Beijing. Even the 0.8 pg peak shown in Fig. 2, which was not detected by the instrument default integration, can be integrated with an uncertainty of < 0.1 pg. Thus zero concentrations occurring occasionally in our old stratospheric data and in reports by others (Talbot et al., 2007) are most likely not real but due to integration prob-lems.
With a median sample volume of 1.7 L (STP) taken within 5 min sampling time and a median mercury concentration of 1.2 ng m−3 during flights 468–492 the median loads are about 2 pg. The typical precision of the offline-processed data is thus∼5 %, i.e.∼0.06 ng m−3. With the precision of ∼3 % of the calibration, the overall precision is∼6 %. The precision of the tropospheric measurements for flights before April 2014 employing the instrument default integration only is∼25 and∼13 % with 5 and 10 min sampling time, respec-tively. The contribution of the calibration precision for these measurements is negligible. As mentioned earlier, the instru-ment was run with Ar+CO2mixture until June 2007, which
reduced the detector sensitivity by∼35 %. The precision of these measurements is thus∼20 and∼13 % with sampling times of 10 and 15 min, respectively. With lower concentra-tions in the stratosphere, the precision becomes worse.
Simultaneous default and offline integration during flights 468–492 allow us to assess the data quality for the earlier flights until 467 (February 2014). Figure 3a displays the ra-tio of offline processed (new) to default integrated (old) con-centrations as a function of the old mercury loads > 0.5 pg for the measurements during flights 468–492. The ratio is almost always larger than 1 and increases with decreasing mercury load. That means that the old measurements are mostly bi-ased low. An alternative plot of the ratio of new to old con-centrations vs. new mercury load (not shown) shows a nearly linear inverse function of the new, i.e. the real mercury load below∼8 pg and a ratio of 1 above∼8 pg. Figure 3b shows the binned data from Fig. 3a and the derived function which we used for the correction of the bias of old loads >1 pg in the database until flight 467, i.e. for all CARIBIC flights
be-Figure 3. Ratio of new (offline processed) to old (internal de-fault integration) concentrations vs. old mercury load:(a)all in-dividual data (more than 3000 measurements) from flights 468–492 (April 2014–January 2015),(b)binned data from diagram(a)and a function used to correct old tropospheric data with old mercury loads > 1 pg.
led to varying low biases between May 2005 and February 2014.
We would like to point out that the problem with inte-gration of sub-optimal sample loads also applies for a large part of GOM and PM measurements reported in the litera-ture. Most of these measurements are made by an automated Tekran method (Tekran 2537/1130/1135 system, e.g. Gay et al., 2013). The system is typically run with 2 h sampling of GOM and PM at a flow rate of 10 L min−1(STP) each, yield-ing sample volumes of 1.2 m3(STP). Average GOM and PM concentrations of ∼2 and ∼4 pg m−3 (Gay et al., 2013), respectively, provide mercury loads of ∼2.4 and ∼4.8 pg, which are well below 10 pg needed for the default bias-free integration of the peaks. To the best of our knowledge, the underestimation of GOM and PM concentrations caused by the integration of the sub-optimal Hg loads has not been con-sidered in recent discussions of the GOM and PM measure-ment accuracy so far (e.g. Gustin et al., 2013, 2015).
5 Aerosol collection and mercury analysis by PIXE
Aerosols sampled through the aerosol inlet are collected by a multi-channel aerosol sampler described in detail by Nguyen et al. (2006). The sampler operates using the impaction tech-nique at a flow rate of 10.4 L min−1 and has 16 sampling channels. Each channel contains two sample types: one is used for quantitative analysis of aerosol element composition using particle-induced X-ray emission (PIXE), and the sec-ond one for single-particle morphology investigation using electron microscopy. The sampler is loaded with sampling substrates to cover both the outbound and the return flights. Fourteen channels are used for sequential sampling, and the remaining two channels are sampling during the entire out-bound or return flight (integral samples). The detection limit of PIXE analyses for mercury is∼0.2 ng m−3.
So far we have not detected any PM above the detection limit of the PIXE analyses, neither in tropospheric nor in stratospheric aerosol samples collected during the CARIBIC flights. This appears to be in contradiction with the obser-vations of Murphy et al. (2006), who report high PM con-centrations in the stratosphere while they could hardly detect any PM in the troposphere. Based on assumptions about the Hg ionization efficiency of their Particle Analysis by Laser Mass Spectrometry (PALMS) instrument, which was not cal-ibrated, they roughly estimate that PM constitutes 5–100 % of all mercury in the LS. There are two possible explanations for this contradiction: (1) the concentrations of PM observed by Murphy et al. (2006) are below the PIXE detection limit or (2) PM compounds are semivolatile and evaporate in the aerosol sampling inlet (Sect. 2), in the tubing connecting the inlet and the aerosol sampler, or during the PIXE analysis in vacuum.
Murphy et al. (2006) could not detect any PM in parti-cles at lower altitudes in the troposphere (∼7 km below the tropopause, i.e.∼5 km above the ground). Consequently, the
free-tropospheric PM concentrations at this altitude repre-sent the lower limit of the PALMS sensitivity. PM vertical profiles were measured only recently (Brooks et al., 2014). Although measurements in July, August, and September are missing, the data show a pronounced seasonal variation with minimum PM concentrations in winter months. Most of the measurements by Murphy et al. (2006) were made in spring and summer, and the corresponding PM concentrations re-ported by Brooks et al. (2014) for the altitude range of 4– 6 km varied between∼20 and 110 pg m−3. With a sample volume of 300 L the concentrations of∼20 pg m−3are prob-ably biased low because of integration problems described in Sect. 4. Thus the PALMS lower detection limit represents ∼2–10 % of total mercury concentration of∼1 ng m−3 at the tropopause, which is consistent with the lower estimate by Murphy et al. (2006) for the PM fraction of the total mer-cury concentration.
Another possibility to assess the PM concentrations mea-sured by Murphy et al. (2006) is the recent measure-ments of oxidized mercury in the UT–LS (Lyman and Jaffe, 2012; Brooks et al., 2014; Shah et al., 2016). Lyman and Jaffe’s (2012) measurements suggest that Hg2+ represents more than∼90 % of total mercury above the tropopause. Brooks et al. (2014) report spring and summer GOM con-centrations of 30–80 pg m−3in the altitude range of 5–7 km above ground, but these measurements might be biased low by a factor of 3 (Gustin et al., 2013, 2015). Shah et al. (2016) report unbiased average Hg2+ concentrations of ∼200 pg m−3 in the altitude range of 6–7 km in summer. Taking the bias in measurements of Brooks et al. (2014) into account, their measurements are consistent with those of Shah et al. (2016). Hg2+compounds are semivolatile and will readily attach to particles at low temperatures near the tropopause and above it. Rutter and Schauer (2007) mea-sured the gas–particle partitioning coefficients for HgCl2as
The above considerations also have implications for the GEM and GOM measurements via the trace gas inlet. The temperature within the container varies between 30 and 40◦C. With GOM–PM equilibria determined by Rutter and Schauer (2007) and Amos et al. (2012), almost all PM will evaporate to GOM during the transport from the trace gas in-let to the Tekran instrument and will be measured as such. Based on the above discussion, our measurements likely in-clude mercury volatilized from the particles that pass through the CARIBIC trace gas inlet, in addition to all gaseous com-pounds. We calculate that particles with diameter < 0.5 µm will pass through the trace gas inlet described by Bren-ninkmeijer et al. (2007), representing ∼70 % of the parti-cle mass in the UT and LS. Hg2+ formed by photochem-ical processes will be attached to particles proportionally to their surface area, which is dominated by smaller parti-cles. Consequently, 70 % of particulate mercury represents the lower limit for the mercury on particles which will be co-determined by our system.
6 Fractionation experiments and their interpretation
One of the reviewers (P. Swartzendruber) of this paper pointed out that the more commonly used term “speciation” is incorrect because no individual GOM compounds (i.e. species) have so far been detected despite some evidence that they exist (Huang et al., 2013). In accordance with IUPAC definitions (http://goldbook.iupac.org) we use here the more appropriate term “fractionation”.
The fractionation experiments onboard the CARIBIC con-tainer are restricted by the certification procedures which allow only small internal instrument modifications without any safety relevance. A dedicated external fractionation unit is thus not an option. Within these limitations we added a GOM scrubber upstream of one of the two gold collec-tors or upstream of both gold colleccollec-tors during the outbound flights as shown in Fig. 1. In the initial experiments we run the instrument alternately in a mode without and with the scrubber (5 min with and 5 min without). The experiments in March–June 2008 were carried out with the commercially available soda lime trap (Tekran part no. 90-13310-06). De-spite the careful cleaning of the soda lime trap before the monthly flight sequence, mercury concentrations measured by the channel with soda lime trap were higher than those measured by the channel without the trap at the beginning of each individual flight. The difference disappeared within about 1–2 flight hours. It seems that soda lime contains traces of mercury which diffuse slowly and continuously from the bulk of the material to its surface and accumulate in the time before the flight sequence and between the individual flights when the trap is not flushed by the sample air. After switching on the pumps, it is slowly flushed away. Because of this sort of mercury bleeding, the soda lime trap was replaced during the flights in March and April 2009 by a trap of the same size filled with quartz sand coated with KCl. Beginning in August
2014 (flight 472) we used a quartz wool trap described by Lyman and Jaffe (2012). The air is directed through the trap during the outward flight and bypasses the trap during the re-turn flight (see Fig. 1 and associated description). All traps were tested for quantitative transmission of elemental mer-cury before inserting them into the instrument.
We are aware of the problems frequently encountered with GOM (and PM) traps such as interference of KCl surface with ozone and humidity (e.g. Lyman et al., 2010; Gustin et al., 2013; Huang et al., 2013; Huang and Gustin, 2015). Quartz wool traps are claimed not to be influenced by ozone (Ambrose et al., 2013, 2015) but can release GOM in humid air. This should not pose a problem in the UT–LS with very low absolute humidity. Because of these problems we discuss the results of the trap experiments mostly only in qualitative terms.
After an initial flushing effect described above, the experi-ments with soda lime trap showed generally smaller mercury concentrations with the trap than without it. The difference between the concentrations without (TGM) and with the trap (GEM if the trap removes GOM quantitatively) tended to be larger in the stratosphere than in the troposphere. These re-sults are consistent with the fractionation measurements of Lyman and Jaffe (2012) and demonstrate qualitatively that at least some GOM is transmitted through the inlet and the tubing into the instrument.
This conclusion is supported by the experiments with the KCl trap. It was deployed in March 2009 during the flight sequence Frankfurt–Cape Town–Frankfurt–Orlando– Frankfurt (CARIBIC flights 262–265) and in April 2009 during the flight sequence Frankfurt–Caracas–Frankfurt– Vancouver–Frankfurt (flights 266–269). Both flight se-quences were of the same duration (∼36 h), but the strato-spheric section of the flights in March (total of∼9 h) was much smaller than in April (total of∼21 h). The KCl trap was analysed for its mercury content after each flight se-quence and 50 pg of mercury was found after the flights in March, with an uncertainty of∼ ±10 pg. The total sampling volume during the flights in March was 500 L (STP), result-ing in an average GOM concentration of∼0.10 ng m−3. A total of 57±10 pg of mercury was found on the KCl trap after the April 2009 flight sequence. With an overall sampling vol-ume of 450 L (STP) it suggests an average GOM concentra-tion of∼0.13 ng m−3. This concentration is somewhat larger in accordance with the longer time spent in the stratosphere although not proportional to it. Mercury found on the KCl traps again shows that GOM is transmitted through the inlet and the tubing to the instrument.
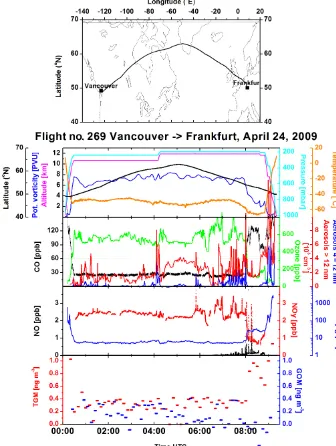
During flight 269 on 24 April 2009 from Vancouver to Frankfurt the aircraft flew almost always in the deep strato-sphere (on average∼7 PVU,∼550 ppb O3, CO below 30
Figure 4.Overview of the parameters measured during flight 269 on 24 April 2009, from Vancouver to Frankfurt. The Hg instrument was run with a resolution of 5 min alternatively with and without a KCl trap. Tentative GOM concentrations are calculated as a difference between concentrations measured without the KCl trap (TGM) and those with the KCl trap (presumably GEM). The mercury data are not corrected (see Sect. 4) because most of the mercury loads were smaller than 1 pg.
constant, while the difference between the channel without and with the KCl trap varied between 0 and 0.3 ng m−3. None
of the simultaneously measured parameters provided a hint as to what this variation might have depended on. But the same concentrations of total gaseous mercury and its com-plete removal by the trap during some sections of the flight suggest that all gaseous mercury was oxidized. In addition, the constant TGM over large parts of this flight with GOM varying from nearly zero concentration to concentrations
comparable to TGM suggests that the GOM transmission by the inlet tubing might be nearly quantitative.
Figure 5.Data from flights 476 and 477 between Munich and San Francisco on 23 and 24 September 2014. The air sample passed the quartz wool trap upstream of the instrument during the forward flight from Munich to San Francisco, and, assuming the quantitative GOM removal, we denote the data as GEM. The return flight was run without the trap and is denoted as TGM. The data are offline-processed.
was bypassed and the sample air was fed directly into the instrument, and these measurements are denoted as TGM. A direct GEM vs. TGM comparison is not possible because of the differences in flight track and flight altitude. In the troposphere at O3< 100 ppb GEM and TGM concentration
tend to be comparable, whereas TGM concentrations tend to be larger than GEM at O3> 200 ppb, i.e. in the stratosphere.
In summary, experiments with all three trap types demon-strate clearly that GOM is at least partly transmitted by the inlet tubing to the instrument. The tendency for higher GOM concentrations in the stratospheric sections of the flights further supports this evidence. The equal concentrations of TGM and GOM during some sections of flight 269 sug-gest that all gaseous mercury was transformed to GOM and that the transmission might be nearly quantitative. We note that GOM transmission through PFA tubing is an unresolved issue with contradictory findings (Temme et al., 2003; Landis and Stevens, 2003; Swartzendruber, 2009; and the comments by both reviewers of this paper), and our results thus cannot be generalized. But they are consistent with those of Temme et al. (2003), who found that GOM is transmitted quantita-tively by PFA tubing at low temperatures and humidity en-countered in Antarctica, conditions similar to those encoun-tered during the CARIBIC flights at cruising altitude. The CARIBIC trace gas inlet is also very similar to that described by Lyman and Jaffe (2012) with demonstrated GOM mission. Despite all evidence for nearly quantitative trans-mission of GOM to the instrument we cannot prove it by measurements. One reason is the lack of devices producing GOM test mixtures (Lyman and Jaffe, 2012). But even with recently developed devices for GOM test mixture generation (Huang et al., 2013; Ambrose et al., 2015) we will not be
able to replicate the sampling conditions during the flight. We have to wait for in-flight comparison with an aircraft with proven GOM measurement capability.
In summary, we believe that the mercury concentrations measured by the instrument in the CARIBIC container rep-resent all gaseous elemental and oxidized mercury, and at least 70 % of particulate mercury depending on its particle size distribution. In the troposphere, where particulate mer-cury constitutes usually less than a few percent of gaseous mercury, our measurement will approximate total mercury.
7 Conclusions
The instrument described here has been onboard the CARIBIC container since May 2005 and provided mercury data for more than 98 % of the flight time. With this data availability it is one of the most reliable instruments in the container. Unfortunately, the Tekran raw signal became avail-able only in April 2014. Using a Matlab script, we demon-strated the necessity of the post-flight offline integration of the raw signal to get bias-free and more precise data. In ad-dition, no zero mercury concentrations have been detected since the implementation of the post-flight integration of the Tekran raw signal. Using simultaneous Tekran default and post-flight integrated data from flights made between April 2014 and January 2015, we derived a function which enabled us to remove the low bias of the old tropospheric data until February 2014. The larger part of the stratospheric data until February 2014, however, is lost. We would like to emphasize that the problem with the biased integration of small mercury loads (<∼10 pg) also applies for a large part of GOM and PM concentrations reported in the literature. To the best of our knowledge, the low bias of GOM and PM concentrations caused by the biased integrations of small mercury amounts has not been discussed so far (e.g. Gustin et al., 2013, 2015). Fractionation experiments demonstrated qualitatively that GOM is transmitted through the inlet system to the instru-ment and will be measured together with GEM. However, due to limitations given by the use of a passenger aircraft the proof of quantitative GOM transmission is feasible only by an in-flight intercomparison using a research aircraft with proven GOM measurement capabilities.
If there is PM on particles which make it through the trace gas inlet into the instrument manifold, it will evaporate dur-ing the transport from the inlet to the instrument and will be measured as GOM. At flight conditions particles with a diam-eter < 0.5 µ m will pass through the trace gas inlet represent-ing∼70 % of the aerosol mass. As GOM will be preferably attached to smaller particles, this is the lower limit of par-ticulate mercury which will be measured together with the gaseous mercury (GEM+GOM). In summary, we believe that the CARIBIC instrument provides mercury data that ap-proximate total mercury content of the sampled air including mercury on particles.
Acknowledgements. We would like to thank Lufthansa, Lufthansa Technik, and all members of the CARIBIC team for their con-tinued effort to keep such a complex project running. We thank especially Dieter Scharffe, Claus Koeppel, Stefan Weber, and Torsten Gehrlein for the day-to-day maintenance and operation of the CARIBIC container. Funding from the European Community within the GMOS (Global Mercury Observation System) project and from Fraport AG is thankfully acknowledged. We also thank Philip Swartzendruber and Anthony Hynes for their valuable comments.
The article processing charges for this open-access publication were covered by the Max Planck Society.
Edited by: R. Volkamer
References
Ambrose, J. L., Lyman, S. N., Huang, J., Gustin, M. S., and Jaffe, D. A.: Fast time resolution oxidized mercury measurements dur-ing the Reno Atmospheric Mercury Intercomparison Experiment (RAMIX), Environ. Sci. Technol., 47, 7285–7294, 2013. Ambrose, J. L., Gratz, L. E., Jaffe, D. A., Campos, T., Flocke, F.
M., Knapp, D. J., Stechman, D. M., Stell, M., Weinheimer, A. J., Cantrell, C. A., and Mauldin III, R. L.: Mercury emission ratios from coal-fired power plants in the southeastern United States during NOMADSS, Environ. Sci. Technol., 49, 10389–10397, 2015.
Amos, H. M., Jacob, D. J., Holmes, C. D., Fisher, J. A., Wang, Q., Yantosca, R. M., Corbitt, E. S., Galarneau, E., Rutter, A. P., Gustin, M. S., Steffen, A., Schauer, J. J., Graydon, J. A., Louis, V. L. St., Talbot, R. W., Edgerton, E. S., Zhang, Y., and Sunder-land, E. M.: Gas-particle partitioning of atmospheric Hg(II) and its effect on global mercury deposition, Atmos. Chem. Phys., 12, 591–603, doi:10.5194/acp-12-591-2012, 2012.
Banic, C. M., Beauchamp, S. T., Tordon, R. J., Schroeder, W. H., Steffen, A., Anlauf, K. A., and Wong, H. K. T.: Vertical distribu-tion of gaseous elemental mercury in Canada, J. Geophys. Res., 108, 4264, doi:10.1029/2002JD002116, 2003.
Baron, P. A. and Willeke K.: Aerosol Measurements: Principles Techniques and Applications, John Wiley and Sons, New York, 1131 pp., 2001.
Brenninkmeijer, C. A. M., Crutzen, P., Boumard, F., Dauer, T., Dix, B., Ebinghaus, R., Filippi, D., Fischer, H., Franke, H., Frieß, U.,
Heintzenberg, J., Helleis, F., Hermann, M., Kock, H. H., Koep-pel, C., Lelieveld, J., Leuenberger, M., Martinsson, B. G., Miem-czyk, S., Moret, H. P., Nguyen, H. N., Nyfeler, P., Oram, D., O’Sullivan, D., Penkett, S., Platt, U., Pupek, M., Ramonet, M., Randa, B., Reichelt, M., Rhee, T. S., Rohwer, J., Rosenfeld, K., Scharffe, D., Schlager, H., Schumann, U., Slemr, F., Sprung, D., Stock, P., Thaler, R., Valentino, F., van Velthoven, P., Waibel, A., Wandel, A., Waschitschek, K., Wiedensohler, A., Xueref-Remy, I., Zahn, A., Zech, U., and Ziereis, H.: Civil Aircraft for the reg-ular investigation of the atmosphere based on an instrumented container: The new CARIBIC system, Atmos. Chem. Phys., 7, 4953–4976, doi:10.5194/acp-7-4953-2007, 2007.
Brooks, S., Ren, X., Cohen, M., Luke, W. T., Kelley, P., Artz, R., Hynes, A., Landing, W., and Martos, B.: Airborne vertical pro-filing of mercury speciation near Tullahoma, TN, USA, Atmo-sphere, 5, 557–574, 2014.
Ebinghaus, R. and Slemr, F.: Aircraft measurements of atmospheric mercury over southern and eastern Germany, Atmos. Environ., 34, 895–903, 2000.
Ebinghaus, R., Slemr, F., Brenninkmeijer, C. A. M., van Velthoven, P., Zahn, A., Hermann, M., O’Sullivan, D. A., and Oram, D. E.: Emissions of gaseous mercury from biomass burning in South America in 2005 observed during CARIBIC flights, Geophys. Res. Lett., 34, L08813, doi:10.1029/2006GL028866, 2007. Friedli, H. R., Radke, L. F., Lu, J. Y., Banic, C. M., Leaitch, W.
R., and MacPherson, J. I.: Mercury emissions from burning of biomass from temperate North American forests: laboratory and airborne measurements, Atmos. Environ., 37, 253–267, 2003a. Friedli, H. R., Radke, L. F., Prescott, R., Hobbs, P. V., and Sinha, P.:
Mercury emissions from the August 2001 wildfires in the Wash-ington State and an agriculture waste fire in Oregon and atmo-spheric mercury budget estimates, Global Biogeochem. Cy., 17, 1039, doi:10.1029/2002GB001972, 2003b.
Friedli, H. R., Radke, L. F., Prescott, R., Li, P., Woo, J.-H., and Carmichael, C. R.: Mercury in the atmosphere around Japan, Ko-rea, and China as observed during the 2001 ACE-Asia field cam-paign: Measurements, distributions, sources, and implications, J. Geophys. Res., 109, D19S25, doi:10.1029/2003JD004244, 2004. Gay, D. A., Schmeltz, D., Prestbo, E., Olson, M., Sharac, T., and Tordon, R.: The Atmospheric Mercury Network: measure-ment and initial examination of an ongoing atmospheric mercury record across North America, Atmos. Chem. Phys., 13, 11339– 11349, doi:10.5194/acp-13-11339-2013, 2013.
Gustin, M. S., Huang, J., Miller, M. B., Peterson, C., Jaffe, D. A., Ambrose, J., Finley, B. D., Lyman, S. N., Call, K., Talbot, R., Feddersen, D., Mao, H., and Lindberg, S. E.: Do we understand what the mercury speciation instruments are actually measur-ing? Results of RAMIX, Environ. Sci. Technol., 47, 7295–7306, 2013.
Gustin, M. S., Amos, H. M., Huang, J., Miller, M. B., and Hei-decorn, K.: Measuring and modeling mercury in the atmo-sphere: a critical review, Atmos. Chem. Phys., 15, 5697–5713, doi:10.5194/acp-15-5697-2015, 2015.
Huang, J. Y., Miller, M. P., Weiss-Penzias, P., and Gustin, M. S.: Comparison of gaseous oxidized Hg measured by KCl coated denuders, and nylon and cation exchange membranes, Environ. Sci. Technol., 47, 7307–7316, 2013.
Huang, J. and Gustin, M. S.: Impacts of relative humidity on GOM measurements, Environ. Sci. Technol., 49, 6102–6108, 2015. Hynes, A. J., Donohue, D. L., Goodsite, M. E., and Hedgecock,
I. M.: Our current understanding of major chemical and physi-cal processes affecting mercury dynamics in the atmosphere and at the air-water/terrestrial interfaces, in: Mercury Fate and Trans-port in the Global Atmosphere, edited by: Pirrone, N. and Mason, R., Springer Dordrecht, 427–457, 2009.
Landis, M. S. and Stevens, R. K.: Comment on “Measurements of atmospheric mercury species at a coastal site in the Antarctic and over the South Atlantic Ocean during polar summer, Environ. Sci. Technol., 37, 3239–3240, 2003.
Lin, C.-J., Pongprueksa, P., Lindberg, S. E., Pehkonen, S. O., Byun, D., and Jang, C.: Scientific uncertainties in atmospheric mercury models: I. Model science evaluation, Atmos. Environ, 40, 2911– 2928, 2006.
Lindberg, S., Bullock, R., Ebinghaus, R., Engstrom, D., Feng, X., Fitzgerald, W., Pirrone, N., Prestbo, E., and Seigneur, C.: A syn-thesis of progress and uncertainties in attributing the sources of mercury in deposition, Ambio, 36, 19–32, 2007.
Lyman, S. N. and Jaffe, D. A.: Formation and fate of oxidized mer-cury in the upper troposphere and lower stratosphere, Nature Geosci., 5, 114–117, 2012.
Lyman, S. N., Jaffe, D. A., and Gustin, M. S.: Release of mer-cury halides from KCl denuders in the presence of ozone, At-mos. Chem. Phys., 10, 8197–8204, doi:10.5194/acp-10-8197-2010, 2010.
Mason, R. P.: Mercury emissions from natural processes and their importance in the global mercury cycle, in: Mercury Fate and Transport in the Global Atmosphere, edited by: Pirrone, N. and Mason, R., Springer Dordrecht, 173–191, 2009.
Mergler, D., Anderson, H. A., Man Chan, L. H., Mahaffey, K. R., Murray, M., Sakamoto, M., and Stern, A. H.: Methylmercury ex-posure and health effects in humans: A worldwide concern, Am-bio, 36, 3–11, 2007.
Murphy, D. M., Thomson, D. S., and Mahoney, M. J.: In situ mea-surements of organics, meteoritic material, mercury, and other elements in aerosols at 5 to 19 kilometers, Science, 282, 1664– 1669, 1998.
Murphy, D. M., Hudson, P. K., Thomson, D. S., Sheridan, P. J., and Wilson, J. C.: Observations of mercury-containing aerosols, Environ. Sci. Technol., 40, 3163–3167, 2006.
Neuman, J. A., Huey, L. G., Ryerson, T. B., and Fahey, D. W.: Study of inlet materials for sampling atmospheric nitric acid, Environ. Sci. Technol., 33, 1133–1136, 1999.
Nguyen, H. N., Gudmundsson, A., and Martinsson, B. G.: Design and calibration of a multichannel aerosol sampler for tropopause region studies from the CARIBIC platform, Aerosol Sci. Tech-nol. 40, 649–655, 2006.
Pirrone, N., Cinnirella, S., Feng, X., Finkelman, R. B., Friedli, H. R., Leaner, J., Mason, R., Mukherjee, A. B., Stracher, G., Streets, D. G., and Telmer, K.: Global mercury emissions to the atmo-sphere from natural and anthropogenic sources, in: Mercury Fate and Transport in the Global Atmosphere, edited by: Pirrone, N. and Mason, R., Springer Dordrecht, 3–49, 2009.
Pirrone, N., Cinnirella, S., Feng, X., Finkelman, R. B., Friedli, H. R., Leaner, J., Mason, R., Mukherjee, A. B., Stracher, G. B., Streets, D. G., and Telmer, K.: Global mercury emissions to the atmosphere from anthropogenic and natural sources, At-mos. Chem. Phys., 10, 5951–5964, doi:10.5194/acp-10-5951-2010, 2010.
Radke, L. F., Friedli, H. R., and Heikes, B. G.: Atmospheric mercury over the NE Pacific during spring 2002: Gradi-ents, residence time, upper troposphere lower stratosphere loss, and long-range transport, J. Geophys. Res., 112, D19305, doi:10.1029/2005JD005828, 2007.
Rutter, A. P. and Schauer, J. J.: The effect of temperature on the gas-particle partitioning of reactive mercury in atmospheric aerosols, Atmos. Environ., 41, 8647–8657, 2007.
Scheuhammer, A. M., Meyer, M. W., Sandheinrich, M. B., and Muray, M. W.: Effects of environmental methylmercury on the health of wild birds, mammals, and fish, Ambio, 36, 12–18, 2007. Shah, V., Jaeglé, L., Gratz, L. E., Ambrose, J. L., Jaffe, D. A., Selin, N. E., Song, S., Campos, T. L., Flocke, F. M., Reeves, M., Stech-man, D., Stell, M., Festa, J., Stutz, J., Weinheimer, A. J., Knapp, D. J., Montzka, D. D., Tyndall, G. S., Apel, E. C., Hornbrook, R. S., Hills, A. J., Riemer, D. D., Blake, N. J., Cantrell, C. A., and Mauldin III, R. L.: Origin of oxidized mercury in the summer-time free troposphere over the southeastern US, Atmos. Chem. Phys., 16, 1511–1530, doi:10.5194/acp-16-1511-2016, 2016. Slemr, F., Seiler, W., and Schuster, G.: Quecksilber in der
Tropo-sphere, Ber. Bunsenges. Phys. Chem., 82, 1142–1146, 1978. Slemr, F., Seiler, W., Eberling, C., and Roggendorf, P.: The
determi-nation of total gaseous mercury in air at background levels, Anal. Chim. Acta, 110, 35–47, 1979.
Slemr, F., Schuster, G., and Seiler, W.: Distribution, speciation and budget of atmospheric mercury, J. Atmos. Chem., 3, 407–434, 1985.
Slemr, F., Ebinghaus, R., Brenninkmeijer, C. A. M., Hermann, M., Kock, H. H., Martinsson, B. G., Schuck, T., Sprung, D., van Velthoven, P., Zahn, A., and Ziereis, H.: Gaseous mercury distri-bution in the upper troposphere and lower stratosphere observed onboard the CARIBIC passenger aircraft, Atmos. Chem. Phys., 9, 1957–1969, doi:10.5194/acp-9-1957-2009, 2009.
Slemr, F., Brunke, E.-G., Ebinghaus, R., and Kuss, J.: Worldwide trend of atmospheric mercury since 1995, Atmos. Chem. Phys., 11, 4779–4787, doi:10.5194/acp-11-4779-2011, 2011.
Slemr, F., Weigelt, A., Ebinghaus, R., Brenninkmeijer, C.A.M., Baker, A., Schuck, T., Rauthe-Schöch, A., Riede, H., Leed-ham, E., Hermann, M., van Velthoven, P., Oram, D., O’Sullivan, D., Dyroff, C., Zahn, A., and Ziereis, H.: Mercury plumes in the global upper troposphere observed during flights with the CARIBIC observatory from May 2005 until June 2013, Atmo-sphere, 5, 342–369, 2014.
Swartzendruber, P. C.: The Distribution and Speciation of Mercury in the Free Troposphere of the Pacific Northwest, PhD Thesis, University of Washington, UMI Number 3356667, 2009. Swartzendruber, P. C., Chand, D., Jaffe, D. A., Smith, J.,
Rei-dmiller, D., Gratz, L., Keeler, J., Strode, S., Jaeglé, L., and Talbot, R.: Vertical distribution of mercury, CO, ozone, and aerosol scattering coefficient in the Pacific Northwest during the spring 2006 INTEX-B campaign, J. Geophys. Res., 113, D10305, doi:10.1029/2007JD009579, 2008.
Swarzendruber, P. C., Jaffe, D. A., and Finley, B.: Development and first results of an aircraft-based, high time resolution technique for gaseous elemental and reactive (oxidized) gaseous mercury, Environ. Sci. Technol., 43, 7484–7489, 2009a.
Swartzendruber, P. C., Jaffe, D. A., and Finley, B.: Improved flu-orescence peak integration in the Tekran 2537 for applications with sub-optimal sample loadings, Atmos. Environ., 43, 3648– 3651, 2009b.
Talbot, R., Mao, H., Scheuer, E., Dibb, J., and Avery, M.: Total de-pletion of Hg0 in the upper troposphere – lower stratosphere, Geophys. Res. Lett., 34, L23804, doi:10.1029/2007GL031366, 2007.
Talbot, R., Mao, H., Scheuer, E., Dibb, J., Avery, M., Browell, E., Sachse, G., Vay, S., Blake, D., Huey, G., and Fuelberg, H.: Fac-tors influencing the large-scale distribution of Hg◦in the Mexico City area and over the North Pacific, Atmos. Chem. Phys., 8, 2103–2114, doi:10.5194/acp-8-2103-2008, 2008.
Temme, C., Einax, J. W., Ebinghaus, R., and Schroeder, W. H.: Measurements of atmospheric mercury species at a coastal site in the Antarctic and over the South Atlantic Ocean during polar summer, Environ. Sci. Technol., 37, 22–31, 2003.