https://doi.org/10.5194/amt-10-4079-2017 © Author(s) 2017. This work is distributed under the Creative Commons Attribution 3.0 License.
Aerosol-type retrieval and uncertainty quantification from
OMI data
Anu Kauppi1,2, Pekka Kolmonen1, Marko Laine1, and Johanna Tamminen1 1Finnish Meteorological Institute, Helsinki, Finland
2Department of Mathematics and Statistics, University of Helsinki, Helsinki, Finland
Correspondence to:Anu Kauppi (anu.kauppi@fmi.fi)
Received: 16 February 2017 – Discussion started: 22 March 2017
Revised: 1 September 2017 – Accepted: 7 September 2017 – Published: 1 November 2017
Abstract.We discuss uncertainty quantification for aerosol-type selection in satellite-based atmospheric aerosol re-trieval. The retrieval procedure uses precalculated aerosol microphysical models stored in look-up tables (LUTs) and top-of-atmosphere (TOA) spectral reflectance measurements to solve the aerosol characteristics. The forward model ap-proximations cause systematic differences between the mod-elled and observed reflectance. Acknowledging this model discrepancy as a source of uncertainty allows us to produce more realistic uncertainty estimates and assists the selection of the most appropriate LUTs for each individual retrieval.
This paper focuses on the aerosol microphysical model se-lection and characterisation of uncertainty in the retrieved aerosol type and aerosol optical depth (AOD). The concept of model evidence is used as a tool for model comparison. The method is based on Bayesian inference approach, in which all uncertainties are described as a posterior probability dis-tribution. When there is no single best-matching aerosol mi-crophysical model, we use a statistical technique based on Bayesian model averaging to combine AOD posterior prob-ability densities of the best-fitting models to obtain an aver-aged AOD estimate. We also determine the shared evidence of the best-matching models of a certain main aerosol type in order to quantify how plausible it is that it represents the underlying atmospheric aerosol conditions.
The developed method is applied to Ozone Monitoring Instrument (OMI) measurements using a multiwavelength approach for retrieving the aerosol type and AOD estimate with uncertainty quantification for cloud-free over-land pix-els. Several larger pixel set areas were studied in order to investigate the robustness of the developed method. We eval-uated the retrieved AOD by comparison with ground-based
measurements at example sites. We found that the uncer-tainty of AOD expressed by posterior probability distribution reflects the difficulty in model selection. The posterior prob-ability distribution can provide a comprehensive characteri-sation of the uncertainty in this kind of problem for aerosol-type selection. As a result, the proposed method can account for the model error and also include the model selection un-certainty in the total unun-certainty budget.
1 Introduction
Orthogonal Polarization (CALIOP; Winker et al., 2009), the SCanning Imaging Absorption spectroMeter for Atmo-spheric CHartographY (SCIAMACHY; Bovensmann et al., 1999), the Polarization and Directionality of the Earth’s Re-flectance (POLDER; Dubovik et al., 2011) and the Spinning Enhanced Visible and Infrared Imager (SEVIRI; Govaerts et al., 2010; Wagner et al., 2010).
There is increasing potential to use and incorporate satellite-based aerosol information as the instruments are get-ting better in resolution and more sophisticated at detect-ing aerosols (Holzer-Popp et al., 2013). In addition, the im-provement of retrieval algorithms and the development of novel methodologies extend opportunities in which to use the data. In particular, one target is to derive information on small aerosol particles (diameter less than 1 µm) from satellite measurements. An important and challenging use of satellite measurements is to assimilate aerosol character-istics into large-scale global aerosol models (Benedetti et al., 2009). Furthermore, the satellite based data can be com-bined with numerical models when estimating aerosol emis-sion fluxes (Huneeus et al., 2012) or spatially constraining the amount of aerosol emissions (Wang et al., 2012; Xu et al., 2013). Data validness as well as identification and quan-tification of uncertainties are acknowledged when data are used.
Uncertainties in satellite-based aerosol retrievals arise from many sources, e.g. cloud contamination, treatment of surface reflectance and instrumental issues. It is typical in the aerosol retrievals that the radiative transfer (i.e. forward model) calculations have been replaced by precalculated look-up tables (LUTs) in order to speed up the necessary computations. However, it can be noted here that research has been carried out in which local aerosol optical properties for a MODIS satellite AOD retrieval algorithm are derived from a chemical transport model (Drury et al., 2008, 2010; Wang et al., 2010). The LUTs are often multidimensional tables containing simulated discrete descriptions of varying aerosol conditions. Aerosols can be classified into categories (i.e. main types) such as clean background, urban pollution, dust, smoke (from biomass burning) and sea salt based on the origins of the aerosol particles. The optical and micro-physical properties of different aerosol types are described in corresponding LUTs. The aerosol properties in the LUTs can be based on observations or combination of observations and climate models (Holzer-Popp et al., 2013). The situa-tion is more complicated for a retrieval algorithm when an aerosol containing air mass is a mixture of different types, e.g. mixture of dust aerosols and biomass burning aerosols. The proper aerosol-type selection from LUTs is a source of uncertainty and affects the accuracy of the retrieval. Povey and Grainger (2015) give an overview of the error analysis and representation of uncertainty in the satellite data. One application they discuss is related to the AOD retrievals in which unquantifiable errors arise from the choice of a for-ward model (i.e. aerosol microphysical properties).
In this paper we discuss characterisation of uncertainty in the aerosol type and AOD retrieval. We utilise the method, described in Määttä et al. (2014), for estimating the uncer-tainty in the retrieved AOD due to the aerosol microphysi-cal model selection and the approximations in forward mod-elling. The method is based on the Bayesian inference ap-proach in which uncertainty estimates are an inherent part of the formulation (MacKay, 1992; Spiegelhalter et al., 2002; Robert, 2007). The uncertainty is given as a posterior den-sity function of the AOD and a point estimate for the AOD is the maximum a posterior (MAP) value. We calculate the model evidence value for each aerosol microphysical model involved in order to compare and select models. The se-lection of single best-fitting aerosol microphysical model is not always clear and this uncertainty has also been ad-dressed in this study. We calculate the averaged posterior probability distribution wherein the individual model pos-terior distributions are weighted by their evidence. This is implemented by the Bayesian model averaging technique (Hoeting et al., 1999). We also perform the shared evidence of the best-matching models within the main aerosol type in order to quantify the plausibility of each main aerosol type. We acknowledge the forward modelling uncertainty, i.e. model discrepancy (Kennedy et al., 2001; Brynjarsdót-tir et al., 2014) which arises from non-modelled systematic differences between the modelled and observed reflectance. The described method is applied to the aerosol retrieval using cloud screened data from the OMI instrument.
The used data and methodology are introduced in Sects. 2 and 3. We have investigated the performance of the method with case studies presented in Sect. 4. Section 5 discusses the features and possibilities of the method.
2 OMI data
The Dutch–Finnish OMI instrument is on board NASA’s Earth Observing System (EOS) Aura platform which was launched in July 2004 (Levelt et al., 2006). The Aura satel-lite is in a polar sun-synchronous orbit crossing the equator approximately at 13:45 local time. OMI measures sunlight backscattered from the Earth in the ultraviolet (UV) and visi-ble (VIS) wavelength bands (270–500 nm). The ground pixel size at nadir is 13×24 km2. The retrieved products include atmospheric trace gases (ozone, NO2, SO2, HCHO, BrO and OClO), surface UV, cloud information and aerosol character-istic.
be-tween 330 and 500 nm providing the AOD, best-matching aerosol model and aerosol characteristics associated with the best model (e.g. single-scattering albedo and aerosol in-dices; Curier et al., 2008). The retrievals of AOD and single-scattering albedo from OMAERUV and OMAERO have been evaluated using airborne sun photometer, ground-based sun/sky radiometer and other satellite measurements (Ahn et al., 2008; Livingston et al., 2009).
The OMI data used in this study have been extracted via Mirador data search tool provided by the NASA God-dard Earth Sciences Data and Information Services Center (GES DISC) data access system (https://urs.earthdata.nasa. gov). We calculated the top-of-atmosphere (TOA) spectral reflectance (referred to as measured or observed reflectance from now on) from the OMI level 1B VIS (Dobber, 2007a) and UV radiances (Dobber, 2007b) and level 1B Solar ir-radiance (Dobber, 2007c) data. We took the effective cloud fraction information from the level 2 OMI O2-O2cloud prod-uct (OMCLDO2, Veefkind, 2006). Then we applied a simple scheme by using 0.34 as an effective cloud fraction thresh-old value to detect and exclude a cloudy pixel. Thus we fol-lowed only one of three tests for cloud screening used by the OMAERO algorithm. The high threshold value of 0.34 was chosen in order to avoid excluding desert dust scenes (OMAERO Readme Document, 2011). To assure measure-ment data quality in the retrieval we used the pixel quality and error flags from the OMI level 1B radiance products. In addition, to ensure the forward model quality, we excluded data with solar zenith angle above 75◦.
We used Ground Pixel Quality flags from the OMI level 1B radiance product to choose the over-land pix-els as this study was concentrated on the aerosol types that are dominant over land areas. We accepted a pixel and specified it as a land pixel if the flag indicated the ground type to be land, shallow inland water, ocean coastline/lake shoreline, ephemeral (intermittent) water or deep inland water (OMI Level 1B Output products and Metadata, 2009). For surface reflectivity, we used the climatological surface reflectance database from the OMI Earth Surface Reflectance Climatology product OMLER (v003) (Kleipool, 2010). The OMLER (v003) product data file (OMI-Aura_L3-OMLER_2005m01-2009m12_v003-2010m0503t063707.he5) was extracted from the GES DISC data service. The OMLER product contains global maps of the monthly climatology of Lambert equivalent reflectance (LER) in a 0.5×0.5◦grid based on 5 years (2005–2009) of OMI data (OMLER Readme Document, 2010).
In our analysis we have used about 1 nm-wide wavelength bands centred at 342.5, 367.0, 376.5, 388.0, 399.5, 406.0, 416.0, 425.5, 436.5, 442.0, 451.5, 463.0 and 483.5 nm. These 13 bands include one wavelength in the UV region and the rest in the VIS region. The O2-O2 absorption wavelength band, centred at 477 nm, provides important information on the cloud height and, for cloud-free scenes, on the aerosol layer height with high enough AOD levels (Veihelmann et
Table 1.Aerosol size distribution parameters and wavelength de-pendent single-scattering albedo (SSA) for aerosol microphysical models stored in LUTs. The third digit (“x”) in the model ID num-ber for BB and DD models has a range of 1–3 and is intended for different vertical distributions. The size distribution is given by log-normal functions. The mean particle radius, rg [micron], and the standard deviation,σ [micron], are given for both modes, m1 and m2. A second mode fraction of the number concentration is given in column n21. The SSA values shown here are for the first and last wavelength bands.
Model rg m1 rg m2 σm1 σm2 n21 SSA
WA1111 0.078 0.497 1.499 2.160 4.36e-4 1–1 WA1112 0.088 0.509 1.499 2.160 4.04e-4 1–1 WA1113 0.137 0.567 1.499 2.160 8.10e-4 1–1 WA1114 0.030 0.240 2.030 2.030 1.53e-2 1–1 WA1211 0.078 0.497 1.499 2.160 4.36e-4 0.96–0.95 WA1212 0.088 0.509 1.499 2.160 4.04e-4 0.97–0.96 WA1213 0.137 0.567 1.499 2.160 8.10e-4 0.97–0.98 WA1311 0.078 0.497 1.499 2.160 4.36e-4 0.91–0.88 WA1312 0.088 0.509 1.499 2.160 4.04e-4 0.91–0.90 WA1313 0.137 0.567 1.499 2.160 8.10e-4 0.92–0.92 BB21x1 0.074 0.511 1.537 2.203 1.70e-4 0.94–0.93 BB21x2 0.087 0.567 1.537 2.203 2.06e-4 0.94–0.93 BB21x3 0.124 0.719 1.537 2.203 2.94e-4 0.93–0.94 BB22x1 0.074 0.511 1.537 2.203 1.70e-4 0.90–0.88 BB22x2 0.087 0.567 1.537 2.203 2.06e-4 0.90–0.89 BB22x3 0.124 0.719 1.537 2.203 2.94e-4 0.89–0.90 BB23x1 0.074 0.511 1.537 2.203 1.70e-4 0.86–0.82 BB23x2 0.087 0.567 1.537 2.203 2.06e-4 0.86–0.84 BB23x3 0.124 0.719 1.537 2.203 2.94e-4 0.84–0.85 DD31x1 0.042 0.670 1.697 1.806 4.35e-3 0.82–0.94 DD31x2 0.052 0.670 1.697 1.806 4.35e-3 0.86–0.95 DD32x1 0.042 0.670 1.697 1.806 4.35e-3 0.74–0.90 DD32x2 0.052 0.670 1.697 1.806 4.35e-3 0.79–0.91
VO4111 0.230 0.230 0.800 0.800 0.5 1–1
al., 2007). However, in our study we omitted the band 477 nm due to experimental purposes and since we did not need aerosol height information.
2.1 Aerosol microphysical models
The aerosol microphysical models stored in the OMI LUTs are produced via the radiative transfer calculations for a range of aerosol physical properties and sun-satellite ge-ometries (Torres et al., 2002, 2007). There are four main aerosol types: weakly absorbing (WA), biomass burning (BB), desert dust (DD) and volcanic (VO) aerosols. The weakly-absorbing-type aerosol models are composed of urban-industrial and natural oceanic aerosols (Torres et al., 2002). (Veihelmann et al., 2007) discuss the capability of the OMI multiwavelength algorithm to distinguish between dif-ferent aerosol types.
(see Table 1). Each model consists of a set of parameters (e.g. AOD, single-scattering albedo, viewing and solar zenith angle, relative azimuth angle, path reflectance, transmission and spherical albedo) with predefined values at node points.
A weakly absorbing aerosol model WA1114 represents sea salt particles having a higher fraction of coarse particles than the other weakly absorbing models (see Table 1). We have classified the model WA1114 as the fifth main aerosol type when reporting results from the case examples (see Sect. 4).
3 Methodology
The proposed method is applied to the retrieval scheme that is similar to the OMAERO algorithm. The unknown aerosol parameter is the AOD at the reference wavelength of 500 nm, for which we will use the symbol τ. The related uncer-tainty is analysed using Bayesian statistical inference. The observations are TOA reflectancesRobs(λ)at a set of wave-lengths λ=(λ1, . . ., λn). The modelled spectral reflectance
Rmod(τ, λ)depends onτ within the specific aerosol micro-physical model in LUT. The AOD parameter τ is adjusted between the nodal values in the model LUT to find the mod-elled reflectance that has the best fit with the observed spec-tral reflectance.
Assuming a Lambertian surface the contribution of the ra-diation at the TOA can be separated from that of the atmo-sphere (e.g. Chandrasekhar, 1960), leading to the equation for modelled reflectance as
Rmod(λ, τ, µ, µ0, 1φ, ps)
=Ra(λ, τ, µ, µ0, 1φ, ps)
+ As(λ)
1−As(λ) s (λ, τ, ps)
T (λ, τ, µ, µ0, ps) . (1) Here path reflectance Ra, transmittance T and spherical
albedos of the atmosphere are derived from LUT by inter-polation as a function ofλ,τ,1φ(relative azimuth angle),
ps(surface pressure),µ(cosine of viewing zenith angle) and
µ0(cosine of solar zenith angle). The sun-satellite geome-try data1φ,ps,µandµ0are included in the OMI level 1B data. The surface reflectanceAs is taken from the Lamber-tian equivalent surface reflectance climatology based on the geolocation of the retrieved pixel and month.
3.1 Acknowledging the model discrepancy
The aerosol microphysical models used in the retrieval pro-cedure are discrete representations of the aerosols in the real atmosphere. Approximations in forward modelling together with uncertainties in the assumptions, e.g. in the surface re-flectance, cause model discrepancy, which manifests itself as systematic deviations between the modelled and observed re-flectance.
We pay special attention to the model discrepancy in the fitting process by adding the related uncertainty termη(λ)to
the observation model
Robs(λ) =Rmod(τ, λ)+η(λ)+obs(λ). (2)
The model discrepancy error termη(λ) enables correlated errors between neighbouring wavelengths, thus allowing for smooth departures from the model. The measurement error
obs(λ)∼N(0,σ2obs(λ)) will describe the independent in-strument noise that will be assumed to be known in the re-trieval procedure from the instrument properties and from the calculation of the observed reflectance. In the fitting pro-cedure, for simplicity, we haveσobs(λ)=Robs(λ)/SNR, for which we used value SNR=500 for the signal-to-noise ratio of the instrument.
Our approach to estimating the model discrepancy term
η(λ)was to explore systematic differences between the mea-sured and modelled reflectance (i.e. residuals). The system-atic structure in the residuals indicates inadequacy in the for-ward model. The model discrepancy was characterised using a zero mean Gaussian processη(λ)∼GP(0,C)(Rasmussen and Williams, 2006), as described by (Määttä et al., 2014), where the covariance matrix C defines the wavelength-dependent correlation properties of the discrepancy. The co-variance matrixCwas constructed by means of an empirical semivariogram when the variances of the residual differences were calculated for each wavelength pairs with the distance
d. Next, the theoretical Gaussian variogram model was fitted to these empirical semivariogram values. The outcome of this analysis was the values for parameters that define the model discrepancy covariance matrixC(see Määttä et al., 2014 for details).
We assume that the likelihood function describing the dis-tribution of the observations given the model follows a Gaus-sian distribution. The likelihood function has an additional error covariance term due to the model error,
p (Robs|τ, m) ∝
exp
−1
2Rres(λ)
TC+diagσ2 obs(λ)
−1
Rres(λ)
, (3) whereRres(λ)=Robs(λ)−Rmod(τ, λ)is the residual,Cis the model discrepancy covariance matrix and diag(σ2(λ))
is a diagonal matrix of the measurement error variances σ2obs(λ). The likelihood function is needed for the calculation of posterior distribution using Bayes’ formula (see Sect. 3.2). 3.2 Aerosol type and AOD retrieval with uncertainty
quantification
In the Bayesian inference, the solution of an inverse prob-lem is presented as a posterior distribution of the unknown. This approach provides a natural way of presenting the un-certainty in the AOD and in the aerosol microphysical model
m. By Bayes’ formula the posterior distribution forτ within the modelmand given the observed reflectanceRobsis
p(τ|Robs, m)=
p(Robs|τ, m) p(τ|m)
p(Robs|m)
Table 2.The retrieved aerosol characteristics for AERONET sites and results from the presented method. The collocated OMI pixel indices in orbit are given in the column Pixel ind. The AERONET AOD at 440 and the Ångström exponentα(440–675) nm are daily averages of the data from level 2.0 version 2 direct-sun algorithm. We interpolated AERONET AOD at 500 nm (marked by∗) by Ångström power law using the instant values ofα(440–675) and AOD at 440 nm. The AOD at 500 nm retrieved by the presented method is the MAP estimate from the averaged posterior density. The Ångström exponentsα1(442–500) andα2(442–500) nm are calculated from the best-matching model LUT and from the second-best-matching model LUT, respectively. We interpolated OMAERO AOD at 500 nm (marked by∗∗) in the best-fitting LUT using AOD at 342.5 nm.
Site name (Lat, lon) Pixel ind AOD 440 AOD 500 α(440–675) AOD 500 α1 α2 AOD 500
AERONET AERONET OMI AERONET AERONET AERONET OMAERO
Beijinga (39.9◦N, 116.3◦W) (1029.25) 2.488 2.160∗ 1.108 3.602 1.008 1.610 –
Beijingb (39.9◦N, 116.3◦W) (1004.12) 0.807 0.665∗ 1.522 0.624 1.560 1.259 –
Agoufou (15.3◦N, 1.4◦W) (905.9) 0.228 0.218∗ 0.375 2.549 0.293 – 1.557∗∗
DMN_Maine_Soroa (13.2◦N, 12.0◦E) (873.53) 0.143 0.139∗ 0.267 0.087 0.978 1.560 0.148∗∗
IER_Cinzana (13.2◦N, 5.9◦W) (899.2) 0.424 0.414∗ 0.236 0.206 0.561 0.290 0.234∗∗
Saada (31.6◦N, 8.1◦W) (1047.6) 0.302 0.276∗ 0.697 0.312 0.561 0.290 –
a16 April 2008.b27 April 2008.
wherep(Robs|τ, m)is the likelihood andp(τ|m)is a prior distribution for τ depending on the aerosol microphysical model m. The denominatorp(Robs|m)does not depend on
τ and acts to normalise the numerator. We assumed that the prior p(τ|m)follows a log-normal distribution in order to ensure that the estimated AOD is positive. The calcula-tion of the actual posterior distribucalcula-tion requires solving in-tegrals over the parameter and model space. In our case, the model selection procedure seeks the solution for one param-eter τ and then the calculation of posterior distribution is fairly straightforward by numerical quadrature. The calcu-lation of the posterior distribution is presented in more detail in Määttä et al. (2014).
The denominatorp(Robs|m)=R p (Robs|τ, m) p(τ|m)dτ in Eq. (4) is the probability of the observed reflectanceRobs assuming the model m is the correct one. However, when considering our problem of choosing the right model m, the p(Robs|m)acts as an evidence in favour form. Conse-quently, we compare models using their evidence values. In the retrieval procedure we accept the models with the high-est amount of evidence until a cumulative sum of the selected models’ evidence passes the value of 0.8 or the number of se-lected models is 10.
Since we assume that a priori all models are equally likely, we end up calculating the relative evidence for each selected modelmi using the formula
p (mi|Robs)=
p (Robs|mi)
P
j
p Robs|mj
. (5)
Here the denominator is a sum over all the evidence of the modelsmj under the comparison process (see Määttä et al.,
2014 for details). The relative evidence indicates how plau-sible the aerosol microphysical model is among the set of potential models.
Even when a model has the highest amount of evidence, it does not ensure that it adequately fits the observed
re-flectance. The goodness of fit of the selected model is anal-ysed by the modified chi-squared value
χ2 = 1
n−1Rres(λ)
TC+diag(σ2(λ))−1R
res(λ), (6) whereCis a covariance matrix for the model discrepancy andnis the number of wavelength bands in the spectral re-flectance. We accepted the retrieved solution (i.e. the selected best model) if this merit function gave a value≤2.
3.3 Bayesian model averaging
Traditionally, the aerosol microphysical modelmi with the
highest amount of evidence can be treated as the correct one. However, there can be several models that could explain the measurements equally well when taking into account the un-certainty in the selection procedure. In that case the selection of single model (i.e. aerosol subtype) does not ensure that it is the most appropriate model, since it may have been se-lected by chance. In addition, the posterior distribution for
τ can differ from model to model among the best models. This indicates that the selection of one particular model as the correct one is not always self-evident or meaningful.
We have used the Bayesian model averaging approach (Hoeting et al., 1999; Robert, 2007) to calculate averaged posterior distribution using the formula
pavg(τ|Robs)=
n
X
i=1
p (τ|Robs, mi) p (mi|Robs) , (7)
where the posterior distributions forτ, assuming that mi is
4 Case studies and results
With the following test cases we study the functioning of the aerosol-type selection procedure, the concept of the evidence for model comparison and the resulting AOD posterior distri-bution for expressing the uncertainty due to model selection and approximations in forward modelling. The relative evi-dence of a single model, with respect to the other selected models, describes how likely it is that the model explains the observed reflectance. The width of the posterior density func-tion illustrates the level of the uncertainty, i.e. the wider the width the higher the uncertainty.
We consider two test cases in which the atmospheric aerosol conditions are different from each other. The first case study focuses on an urban area around Beijing, where we analyse the retrieved aerosol characteristics on 2 days to observe the difference as well as the similarity between aerosol conditions on these days. The Beijing case is chal-lenging since the aerosol air mass is a mixture of dust from the north blending with urban pollution around Beijing. On the other hand, this case enables us to examine aerosol-type selection in a situation with high AOD levels. The other test case covers northern and central Africa where we expect dust aerosols in the north and biomass burning aerosols in the cen-tral part. In particular, this test case covers a large, almost cloud-free area.
We evaluated the retrieved AOD estimates using collo-cated ground-based Aerosol Robotic Network (AERONET) data of aerosol properties. The AERONET programme is a federation of ground-based remote sensing aerosol net-works (Holben et al., 1998). We downloaded the version 2 direct-sun level 2.0 quality-assured and cloud-screened aerosol data for the AERONET sites under investigation. We tracked clouds and land scenes for the case studies by util-ising true-colour images from MODIS on the Aqua satellite, which has an equator crossing time of only about 15 min ear-lier than OMI. The MODIS instrument is on board both the Terra and Aqua spacecraft. The data products derived from MODIS measurements include atmosphere (e.g. cloud mask and aerosol products), land, cryosphere and ocean products (see e.g. http://modis.gsfc.nasa.gov).
4.1 Beijing area on 16 and 27 April 2008
In this case study focusing on an urban area around Beijing, we analysed the retrieved aerosol characteristics on 2 days: 16 and 27 April 2008. In the spring season the atmosphere is typically loaded with a mixture of urban and dust aerosols (Yu et al., 2016). Figure 1 shows the true-colour images from the MODIS, on board the NASA’s Aqua satellite, on 16 April 2008 at 05:15 UTC (left) and 27 April 2008 at 04:55 UTC (right) over the Beijing area.
The OMI pixels that were analysed are located on rows 23–29 across the orbit on the first case day (i.e. 16 April) and on rows 10–20 on the second case day (i.e. 27 April). No
data are reported if the pixel is cloud contaminated or if none of the models had adequate fit with the measured reflectance (Eq. 6).
Figure 2 presents the number of most appropriate models retrieved for each pixel on both days. The maximum number of best models was restricted to 10 (see Sect. 3.2). On the first case day the variety of the number of best models is wide (left), whereas on the latter case day (right) for most of the pixels the maximum number of models are selected to explain the measurements.
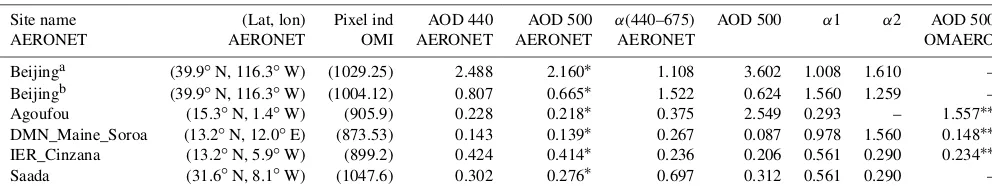
In Fig. 3 is shown the distribution of the main aerosol types of the retrieved aerosol microphysical models (i.e. subtypes) having the highest amount of evidence. The main aerosol types are the weakly absorbing (WA), weakly absorbing sea salt (WA1114), biomass burning (BB), desert dust (DD) and volcanic (VO) aerosols. The prevailing types on both days in the vicinity of Beijing AERONET site (marked with black star in Fig. 3) are the BB and WA types. The appearance of marine type WA1114 as the best-matching type may occur due to cloud impact since the nearby pixels with no results have been omitted as cloudy pixels. In addition, on 27 April (right) the desert dust type obtained the greatest evidence in the upper part of the examination area. An air mass trajec-tory analysis (not shown here) indicated that on 27 April dust from the Gobi desert (north of the study area) was entering the Beijing area.
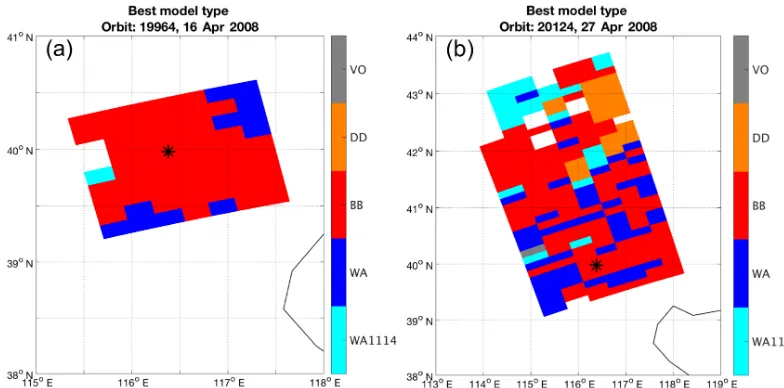
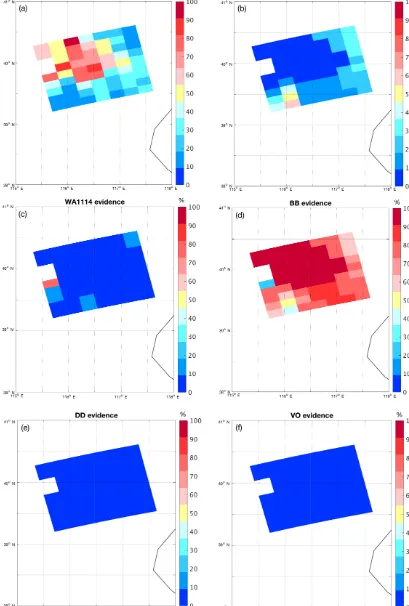
Figures 4 and 5 illustrate how plausible it is that the main aerosol type represents the prevailing aerosol air mass type. We have summed up the relative evidence (%) of the selected models (i.e. subtypes) within each main type to get a quan-tity of confidence, i.e. shared evidence, for each main aerosol type. Figures b-f show pixel-wise the shared evidence (%) for each main type. However, the figure on the upper-left cor-ner (a) presents the relative evidence (%) of the single best-fitting aerosol microphysical model indicating how superior the ranked best model is with respect to the other selected models if any. We can notice that the one best model does not necessarily determine the aerosol type alone, but a mixture of models could give a better match. We also observe that both WA- and BB-type aerosol microphysical models get support as representative models for some pixel areas (b-d). In ad-dition, on 27 April, the DD type gets strong evidence in the upper-right corner of the examination area (Fig. 5e).
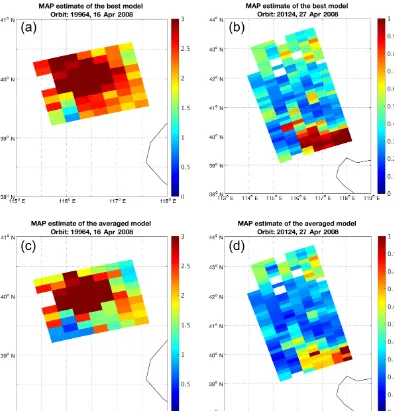
Figure 6 shows the distribution of the retrieved MAP AOD estimates on both days. The upper row shows the MAP esti-mate from the aerosol microphysical model with the highest amount of evidence. The lower row shows the MAP estimate from the averaged posterior distribution over the selected best models. In general, the AOD point estimate value from the averaged posterior distribution is lower than the AOD es-timate based on the single best model.
(a)
(
b
)
Figure 1.True-colour MODIS image (RGB) on 16 April 2008 at 05:15 UTC(a)and on 27 April 2008 at 04:55 UTC(b)over the Beijing area. MODIS, on the Aqua satellite, has the equator crossing time at only about 15 min earlier than OMI. The area of analysed OMI pixels is marked with red contours.
Figure 2.The number of most appropriate aerosol microphysical models at the retrieved pixels on 16 April(a)and 27 April(b).
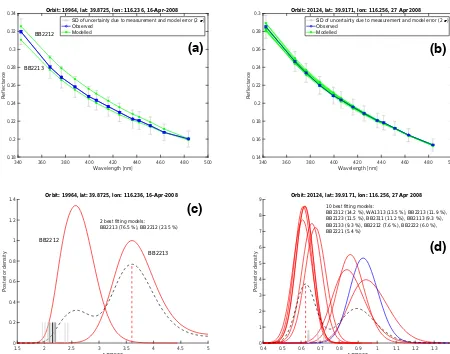
selected best-matching modelled reflectances (in green) for 16 April (left) and 27 April (right). In the lower row the pos-terior density functions that characterise the uncertainty are shown. Also, the best-matching models’ identification num-bers and the associated relative evidence inside brackets are given. The relative evidence (%; Eq. 5) expresses how plau-sible it is that this model explains the measured spectral re-flectance with respect to the other selected best models. The averaged posterior distribution (Eq. 7) has two peaks indi-cating difficulty in model selection. The red vertical dashed line denotes the MAP AOD estimate (i.e. the posterior mode)
from the averaged posterior. The grey vertical lines show the AERONET AOD at 500 nm values at separate measurement times.
Figure 3.The main aerosol type of the retrieved model with the highest amount of evidence, i.e. the best model on 16 April(a)and 27 April(b). The main aerosol types are WA1114 (weakly absorbing sea salt), WA (weakly absorbing), BB (biomass burning), DD (desert dust) and VO (volcanic). The location of the AERONET site Beijing, China (see Table 2) is marked by a black star.
measurements are in the time range of 00:02–04:59 UTC, which is before the OMI overflight time (∼05:25 UTC). However, there are some AERONET AOD measurements (n=3) within a 2 h time window including OMI overpass time. These AOD values are marked by darker grey vertical lines, and the black vertical line is the average.
On 27 April (Fig. 7 right) the resulting AOD from the aver-aged posterior is in agreement with the AERONET data. On that day the AERONET measurements, marked by grey ver-tical lines, are in time range of 08:22–09:43 UTC, thus were monitored after the OMI overpass time (∼05:06 UTC). The selected best models are BB type, except for one WA type model (blue posterior curve) that is ranked as the second-best model in the fitting. The averaged posterior distribution has two modes indicating two alternative explanations for the observed reflectance. The higher mode of the averaged pos-terior gets a larger portion of the model evidence, thus yield-ing the MAP AOD estimate. However, if the end result is based on the one best-fitting model, i.e. BB2312, the esti-mated AOD level would be higher since the corresponding posterior distribution curve is the right one.
In Table 2 the aerosol characteristics are given for the AERONET sites and results, e.g. AOD at 500 nm and Ångström exponent values, retrieved by the proposed method. The AERONET data for Beijing shown in Table 2 are the daily averages. We interpolated AOD at 500 nm by us-ing the AERONET AOD at 440 nm and the AERONET pro-vided Ångström exponent 440–675 nm. The Ångström expo-nent describes the dependency of the AOD on wavelength. It gives an approximation of the aerosol particle size in such a way that when coarse aerosol particles dominate the expo-nent is small, and vice versa for the fine-particle dominance. In our retrieval we calculated the Ångström exponent (442–
500 nm) by Ångström exponent power law where the AOD at 442 nm was derived from the associated LUT based on the retrieved AOD at 500 nm. Thus the reported Ångström exponent is completely determined by the model LUT. In Table 2 Ångström exponent values are presented, based on the best-fitted (α1) and the second-best-fitted (α2) model. For Beijing, on both days, the derived Ångström exponent value of the best model (α1) is in good agreement with the AERONET value. Even so, on 16 April α2 deviates more from the AERONET value, although the estimated AOD, based on the second-best model, is closer to the AERONET AOD values (see Fig. 7, left panels).
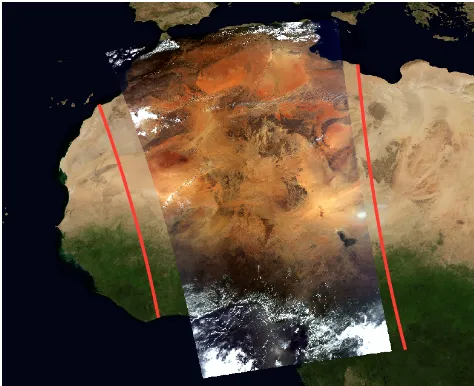
4.2 Northern and central Africa on 26 March 2008 This case study covers a large area over northern and cen-tral Africa on 26 March 2008. Figure 8 shows the merged Aqua/MODIS true-colour images on 26 March 2008 at 13:00 and at 13:05 UTC over northern and central Africa. The view is mainly cloud free except for some broken cloud cover in coastal regions. The AOD data from four AERONET sites, Agoufou (northern Mali), DMN_Maine_Soroa (Niger), IER_Cinzana (Mali) and Saada (Morocco), are used to eval-uate the results. Daily averaged AERONET version 2 direct-sun level 2.0 AOD data are reported in Table 2.
Figure 6.The MAP AOD estimate based on the best model(a, b)and based on the averaged posterior distribution(c, d)shown for 16 April (a, c)and 27 April(b, d). Please note the different colour scale.
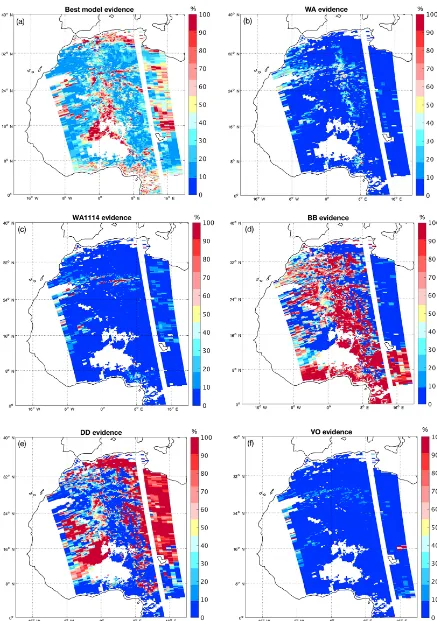
As seen in Fig. 10 the desert dust type dominates the se-lected best models. There are also areas where the BB-type model gets the highest amount of evidence to explain the measurement. The pixels for which the weakly absorbing sea-salt-type aerosols (type WA1114) have the best fit are lo-cated in the edge areas of clouds or in partly cloudy areas (see Fig. 8). The selection of volcanic aerosol type as the only ap-propriate aerosol type happens for pixels located north-east of Lake Chad for which cloud is seen in the MODIS RGB image (Fig. 8). The location of AERONET sites are marked with black stars.
Figs. 11b–f reveal that all the selected best models (i.e. subtypes) usually are of the same main type, namely BB or DD type. However, in the area around Algeria, the
occur-rence of a mixture of main types may be related to the cloud contamination of these pixels.
From Fig. 12 it can be concluded that the MAP estimate from the single best aerosol microphysical model often has a slightly higher AOD level (left) than the MAP estimate from the averaged posterior distribution over the selected best models (right). We can notice that in the area south of 8◦ latitude, where the biomass-burning-type models domi-nate, the AOD estimates are higher. Active fire maps from satellite data (not shown here) support the fire activity at that area. We can also notice the DD-type dominating area near the Agoufou AERONET site where the AOD level is higher (see Figs. 12 and 11e).
second-best-340 360 380 400 420 440 460 480 500 Wavelength [nm] 0.18 0.2 0.22 0.24 0.26 0.28 0.3 0.32 0.34 Reflectance
Orbit: 19964, lat: 39.8725, lon: 116.236, 16-Apr-2008
SD of uncertainty due to measurement and model error (2¾)
Observed
Modelled
BB2212
BB2213
340 360 380 400 420 440 460 480 500 Wavelength [nm] 0.14 0.16 0.18 0.2 0.22 0.24 0.26 0.28 0.3 Reflectance
Orbit: 20124, lat: 39.9171, lon: 116.256, 27 Apr 2008 SD of uncertainty due to measurement and model error (2¾)
Observed
Modelled
1.5 2 2.5 3 3.5 4 4.5 5
AOD500 0 0.2 0.4 0.6 0.8 1 1.2 1.4 Posterior density
Orbit: 19964, lat: 39.8725, lon: 116.236, 16-Apr-2008
BB2213 BB2212
2 best fitting models: BB2213 (76.5 %), BB2212 (23.5 %)
0.4 0.5 0.6 0.7 0.8 0.9 1 1.1 1.2 1.3 1.4
AOD500 0 1 2 3 4 5 6 7 8 9 Posterior density
Orbit: 20124, lat: 39.9171, lon: 116.256, 27Apr2008
10 best fitting models:
BB2312 (14.2 %), WA1313 (13.5 %), BB2213 (11.9 %), BB2123 (11.5 %), BB2311 (11.2 %), BB2113 (9.3 %), BB2133 (9.3 %), BB2212 (7.6 %), BB2222 (6.0 %), BB2221 (5.4 %)
(a)
(b)
(c)
(d)
Figure 7.Beijing, 16 April(a, c)and 27 April(b, d).(a, b)The observed reflectance (blue dots) and modelled reflectance (green dots) of the selected best-fitting models. The error bars in blue correspond to 2×standard measurement error and the error bars in grey correspond to 2×standard uncertainty due to measurement and model error.(c, d)The posterior probability distribution of AOD for each best-fitting model. The biomass-burning-type model’s posterior density curve is in red and weakly-absorbing-type model’s curve in blue. The dashed black curve is the averaged posterior distribution over the best-fitting models (Eq. 7). The red vertical dashed line indicates the MAP estimate from the averaged posterior distribution. The grey vertical lines show AERONET version 2 direct-sun level 2.0 AOD at 500 nm values position at the horizontal axis. The darker grey vertical lines(c)denote AERONET AOD values (n=3) within a 2 h time window including OMI overpass time and the black vertical line is the average of these values.
fitted (right) model. In Table 2 the calculated Ångström expo-nent (442–500 nm) values are shown at the locations of the reference AERONET sites. Again, it should be noted here that the retrieved Ångström exponent is completely deter-mined by the model LUT. Consequently, as seen in Fig. 13 the Ångström parameters reflect the selected aerosol micro-physical models. That is, the Ångström values are low where the desert-dust-type models dominate. Correspondingly, in the coastal region where smoke and urban polluted air are typical the Ångström exponent is higher.
Figures 14 and 15 show the spectral reflectance fitting curves (on the left-hand side) and the retrieved AOD esti-mates with uncertainty (on the right-hand side) for the sin-gle pixels located around the AERONET sites: Agoufou, DMN_Maine_Soroa, IER_Cinzana and Saada. In the figure
showing the posterior distributions (right) the grey vertical lines indicate AERONET direct sun level 2.0 AOD at 500 nm values measured during that day. The darker grey vertical lines denote AERONET AOD values within a 2 h time win-dow including the OMI overpass time and the black vertical line is the average of these AOD values.
Figure 8.Merged true-colour Aqua/MODIS image (RGB) on 26 March 2008 at 13:00 and 13:05 UTC. The area of the analysed OMI pixels is marked with red contours.
Figure 9.The number of most appropriate aerosol microphysical models at the retrieved pixels.
the AERONET AOD values at all. However, the posterior density covers AOD from the OMAERO product (Stein-Zweers and Veefkind, 2012), which is also high compared to the AERONET daily average value (Table 2). It can be noted here that AERONET measurements at the Agoufou site were made in the morning in time range of 06:58– 09:27 UTC whereas the OMI overpass time at that location was at∼13:15 UTC. However, the derived Ångström
expo-Figure 10. The main aerosol type of the retrieved model with the highest amount of evidence. The locations of AERONET sites Agoufou, DMN_Maine_Soroa, IER_Cinzana and Saada (see Ta-ble 2) are marked by black stars.
nentα1 has rather good agreement with the AERONET value (Table 2).
Figure 12.The MAP AOD estimate based on the best model(a)and based on the averaged posterior distribution(b).
Figure 13.The Ångström exponent at 442–500 nm of the ranked best(a)and the second-best(b)aerosol microphysical model.
5 Discussion and conclusions
In this paper, we focused on the aerosol microphysical model selection in the aerosol retrieval and on the quantification of uncertainty for the retrieved aerosol type and AOD using OMI TOA spectral reflectance measurements. The aerosol-type selection from LUTs is a source of uncertainty and af-fects the accuracy of the retrieval. The main targets of our study are (1) to improve the retrieval error estimate (i.e. to produce more realistic uncertainty estimate), (2) to evaluate the model choice procedure and (3) to find a more robust AOD estimate that is based on the average of the most ap-propriate aerosol microphysical models instead of on a single model chosen probably by chance. The retrieval scheme is similar to the OMAERO algorithm, using information from several wavelength bands between 330 and 500 nm and
be-340 360 380 400 420 440 460 480 500 Wavelength [nm] 0.18 0.19 0.2 0.21 0.22 0.23 0.24 0.25 0.26 Reflectance
Orbit: 19663, lat: 15.3428, lon: -1.37441, 26Mar2008
DD3211
SD of uncertainty due to measurement and model error (2¾) Observed
Modelled
0 1 2 3 4 5 6 7
AOD500 0 0.1 0.2 0.3 0.4 0.5 0.6 0.7 Posterior density
Orbit: 19663, lat: 15.3428, lon: -1.37441, 26 Mar 2008
1 best fitting model: DD3211
340 360 380 400 420 440 460 480 500
Wavelength [nm] 0.22 0.24 0.26 0.28 0.3 0.32 0.34 0.36 0.38 0.4 Reflectance
Orbit: 19663, lat: 13.2668, lon: 11.8907, 26Mar2008
SD of uncertainty due to measurement and model error (2¾) Observed
Modelled
0 0.1 0.2 0.3 0.4 0.5 0.6 0.7
AOD500 0 1 2 3 4 5 6 7 Posterior density
Orbit: 19663, lat: 13.2668, lon: 11.8907, 26 Mar 2008
10 best fitting models:
BB2323 (16.9 %), BB2322 (13.1 %), BB2333 (12.6 %), BB2321 (10.6 %), BB2332 (10.0 %), BB2233 (8.1 %), BB2331 (8.1 %), BB2313 (7.8 %), BB2223 (6.8 %), BB2232 (6.0 %)
(a)
(
b
)
(
c
)
(
d
)
Figure 14.Same as Fig. 7 but for the pixels located at Agoufou(a, b)and DMN_Maine_Soroa(c, d). The grey vertical lines show AERONET version 2 direct-sun level 2 AOD at 500 nm values. The darker grey vertical lines(d)denote AERONET AOD values within a 2 h time window including OMI overpass time and the black vertical line is the average of these values.
tween the modelled and observed reflectance. We acknowl-edge this model discrepancy when choosing the most appro-priate LUTs in order to produce more realistic uncertainty estimates of the retrieved AOD. Following the Bayesian ap-proach the uncertainty is described by the posterior proba-bility distribution. The selection of single best-fitting aerosol microphysical model is not always clear and this uncertainty is addressed in this study. We use a statistical technique based on Bayesian model averaging to combine the AOD posterior probability densities of the best models to obtain the aver-aged posterior distribution. Then the retrieved AOD is the MAP estimate from the averaged posterior function. We also determine the shared evidence of the best-matching mod-els within a main aerosol type (weakly absorbing, sea salt, biomass burning, dust and volcanic) in order to quantify the plausibility of each main aerosol type.
Retrieving the aerosol type and AOD from the TOA re-flectance measurements is an ill-posed problem and a priori
340 360 380 400 420 440 460 480 500
Wavelength [nm]
0.18 0.2 0.22 0.24 0.26 0.28 0.3 0.32
Reflectance
Orbit: 19663, lat: 13.2913, lon: -5.94453, 26Mar2008
SD of uncertainty due to measurement and model error (2¾)
Observed
Modelled
0 0.2 0.4 0.6 0.8 1 1.2
AOD500
0 1 2 3 4 5 6
Posterior density
Orbit: 19663, lat: 13.2913, lon: -5.94453, 26Mar2008
10 best fitting models:
DD3222 (15.8 %), DD3121 (15.2 %), DD3211 (12.8 %), DD3131 (12.6 %), DD3132 (11.6 %), DD3212 (7.9 %), DD3122 (7.5 %), DD3232 (6.0 %), DD3111 (6.0 %), BB2233 (4.6 %)
340 360 380 400 420 440 460 480 500
Wavelength [nm]
0.14 0.16 0.18 0.2 0.22 0.24 0.26 0.28 0.3
Reflectance
Orbit: 19663, lat: 31.6967, lon: -8.16139, 26 Mar 2008 SD of uncertainty due to measurement and model error (2¾)
Observed
Modelled
0 0.1 0.2 0.3 0.4 0.5 0.6 0.7
AOD500
0 2 4 6 8 10 12
Posterior density
Orbit: 19663, lat: 31.6967, lon: -8.16139, 26 Mar 2008
9 best fitting models:
DD3212 (25.6 %), DD3111 (23.9 %), DD3211 (16.0 %), DD3112 (11.1 %), DD3122 (7.7 %), DD3121 (5.2 %), BB2323 (3.8 %), BB2223 (3.4 %), BB2233 (3.3 %)
(a)
(
b
)
(
c
)
(
F
)
Figure 15.Same as Fig. 14 but for the pixels located at IER_Cinzana(a, b)and Saada(c, d).(b, d)The desert-dust-type models’ posterior density curves are marked with orange and biomass-burning-type models with red.
central Africa (Sect. 4.2), there is an area in the middle of the orbit where none of the available models gave an adequate fit.
We made the cloud screening in a straightforward way just using the effective cloud fraction threshold value of 0.34 (see Sect. 2) and thus there were most probably cloud-affected pixels left. The suspicious results were often localised to pix-els in the edge of a cloud or inside broken-cloud areas. In these cases the observed reflectance was such that the unex-pected model, e.g. an oceanic or volcanic aerosol model, had the best fit (see Fig. 10). This could be used as an additional cloud detection feature.
Here the model discrepancy was determined empirically by exploring a set of residuals (i.e. the difference between observed and modelled reflectance) and then fitting a Gaus-sian process to find the characteristics of the model error (see Määttä et al., 2014). Brynjarsdóttir et al. (2014) dis-cussed model discrepancy and its effect on the results with simple examples. They also emphasised the importance of
modelling the model error properly and the use of realistic priors for the model discrepancy.
have been selected by chance. There are cases when several selected models have almost the same portion of the relative evidence and so the order of the best models may have been happened by chance. This situation is even more complicated if the level of the AOD varies from model to model.
The comparison with the AERONET data revealed that if the estimated AOD at 500 nm from the averaged posterior distribution is not consistent with the AERONET AOD val-ues, the derived uncertainty of AOD is higher. Then, in most cases, the averaged posterior density covers the AERONET AOD values. The derived Ångström exponent values are in rather good agreement with the AERONET values, even if they are LUT dependent (see Table 2). In general, the re-trieved AOD values are also consistent with the AOD from the OMAERO product and the solution is achieved for a larger pixel set.
However, in order to confirm robustness of the method-ology more comprehensive and systematic assessment and evaluation of the method are needed. This involves valida-tion studies with reference data as well as implementavalida-tion of the method using other instruments’ measurements. Also, the examination of the method with simulated data would offer additional information on the usability and reliability of the approach. Moreover, further study and discussion are needed to determine how to express the uncertainty information pro-vided by the posterior distribution in a more compact form.
The method described in this work is applicable to any instrument measurements where the observed reflectance is available as well as the aerosol microphysical models. Our plan is to apply this method to an AATSR retrieval algo-rithm where the models are constructed during the fitting us-ing a limited amount of aerosol components describus-ing non-absorbing and non-absorbing fine particles together with coarse marine and dust particles (Kolmonen et al., 2016).
Data availability. The OMI level 1B, OMCLDO2 product, OM-LER product and OMAERO product data used in this study are from the NASA Goddard Earth Sciences Data and Information Ser-vices Center (GES DISC) archive and are freely available to the user community via the website: https://urs.earthdata.nasa.gov. The results of the case studies derived by the presented method are avail-able upon request from the corresponding author.
The Supplement related to this article is available online at https://doi.org/10.5194/amt-10-4079-2017-supplement.
Competing interests. The authors declare that they have no conflict of interest.
Special issue statement. This article is part of the special issue “Ten years of Ozone Monitoring Instrument (OMI) observations (ACP/AMT inter-journal SI)”. It is not associated with a confer-ence.
Acknowledgements. This work was supported by the Academy of Finland INQUIRE project and by the European Space Agency as part of the Aerosol_cci project. The OMI data were extracted via the NASA’s GES DISC Mirador data access system. The authors like to thank the OMI Science Team for providing the data. The authors would like to give many thanks to the KNMI OMI team for providing the aerosol model look-up tables (LUTs) used in this study and discussions on the OMAERO algorithm. The authors also thank the Principal Investigators and their staff for establishing and maintaining Beijing, Agoufou, DMN_Maine_Soroa, IER_Cinzana and Saada AERONET sites. The authors give special thanks to Anu-Maija Sundström (FMI) for the help with figures. The authors are grateful to the two anonymous reviewers for the useful comments which improved the manuscript.
Edited by: Omar Torres
Reviewed by: two anonymous referees
References
Ahn, C., Torres, O., and Bhartia, P. K.: Comparison of ozone mon-itoring instrument UV aerosol products with Aqua/Moderate Resolution Imaging Spectroradiometer and Multiangle Imag-ing Spectroradiometer observations in 2006, J. Geophys. Res.-Atmos., 113, D16S27, https://doi.org/10.1029/2007JD008832, 2008.
Ahn, C., Torres, O., and Jethva, H.: Assessment of OMI near-UV aerosol optical depth over land, J. Geophys. Res.-Atmos., 119, 2457–2473, https://doi.org/10.1002/2013JD020188, 2014. Benedetti, A., Morcrette, J.-J., Boucher, O., Dethof, A., Engelen,
R. J., Fisher, M., Flentje, H., Huneeus, N., Jones, L., Kaiser, J. W., Kinne, S., Mangold, A., Razinger, M., Simmons, A. J., and Suttie, M.: Aerosol analysis and forecast in the European Centre for Medium-Range Weather Forecasts Integrated Forecast System: 2. Data assimilation, J. Geophys. Res., 114, D13205, https://doi.org/10.1029/2008JD011115, 2009.
Bovensmann, H., Burrows, J. P., Buchwitz, M., Frerick, J., Noël, S., Rozanov, V. V., Chance, K. V., and Goede, A. P. H.: SCIA-MACHY: Mission objectives and measurement modes, J. Atmos. Sci., 56, 127–150, 1999.
Brynjarsdóttir, J. and O’Hagan, A.: Learning about physical param-eters: the importance of model discrepancy, Inverse problems, 30, 114007, https://doi.org/10.1088/0266-5611/30/11/114007, 2014.
Chandrasekhar, S.: Radiative Transfer, 393 pp., Dover, Mineola, NY, 1960.
Dobber, M.: OMI/Aura Level 1B VIS Global Geolocated Earth Shine Radiances 1-orbit L2 Swath 13x24 km V003, Greenbelt, MD, USA, Goddard Earth Sciences Data and Information Services Center (GES DISC), https://doi.org/10.5067/Aura/OMI/DATA1004, 2007a.
Dobber, M.: OMI/Aura Level 1B UV Global Geolo-cated Earthshine Radiances 1-orbit L2 Swath 13x24 km V003, Greenbelt, MD, USA, Goddard Earth Sciences Data and Information Services Center (GES DISC), https://doi.org/10.5067/Aura/OMI/DATA1002, 2007b.
Dobber, M.: OMI/Aura Level 1B Solar Irradiances V003, Greenbelt, MD, USA, Goddard Earth Sciences Data and Information Services Center (GES DISC), https://doi.org/10.5067/Aura/OMI/DATA1001, 2007c.
Drury, E., Jacob, D. J. ,Wang, J., Spurr, R. J. D., and Chance, K.: Improved algorithm for MODIS satellite retrievals of aerosol op-tical depths over western North America, J. Geophys. Res., 113, D16204, https://doi.org/10.1029/2007JD009573, 2008. Drury, E., Jacob, D. J., Spurr, R. J. D., Wang, J., Shinozuka,
Y., Anderson, B. E., Clarke, A. D., Dibb, J., McNaughton, C., and Weber, R.: Synthesis of satellite (MODIS), aircraft (ICARTT), and surface (IMPROVE, EPA-AQS, AERONET) aerosol observations over eastern North America to improve MODIS aerosol retrievals and constrain surface aerosol con-centrations and sources, J. Geophys. Res., 115, D14204, https://doi.org/10.1029/2009JD012629, 2010.
Dubovik, O., Herman, M., Holdak, A., Lapyonok, T., Tanré, D., Deuzé, J. L., Ducos, F., Sinyuk, A., and Lopatin, A.: Statistically optimized inversion algorithm for enhanced re-trieval of aerosol properties from spectral multi-angle polari-metric satellite observations, Atmos. Meas. Tech., 4, 975–1018, https://doi.org/10.5194/amt-4-975-2011, 2011.
Gelman, A., Carlin, J. B., Stern, H. S., Dunson, D., Vehtari, A., and Rubin, D. B.: Bayesian Data Analysis, 3rd Edn., Chapman & Hall/CRC, 2013.
Govaerts, Y. M., Wagner, S., Lattanzio, A., and Watts, P.: Joint retrieval of surface reflectance and aerosol optical depth from MSG/SEVIRI observations with an optimal estima-tion approach: 1. Theory, J. Geophys. Res., 115, D02203, https://doi.org/10.1029/2009JD011779, 2010.
Hassinen, S., Balis, D., Bauer, H., Begoin, M., Delcloo, A., Eleft-heratos, K., Gimeno Garcia, S., Granville, J., Grossi, M., Hao, N., Hedelt, P., Hendrick, F., Hess, M., Heue, K.-P., Hovila, J., Jønch-Sørensen, H., Kalakoski, N., Kauppi, A., Kiemle, S., Kins, L., Koukouli, M. E., Kujanpää, J., Lambert, J.-C., Lang, R., Lerot, C., Loyola, D., Pedergnana, M., Pinardi, G., Rom-ahn, F., van Roozendael, M., Lutz, R., De Smedt, I., Stammes, P., Steinbrecht, W., Tamminen, J., Theys, N., Tilstra, L. G., Tuinder, O. N. E., Valks, P., Zerefos, C., Zimmer, W., and Zyrichidou, I.: Overview of the O3M SAF GOME-2 opera-tional atmospheric composition and UV radiation data prod-ucts and data availability, Atmos. Meas. Tech., 9, 383–407, https://doi.org/10.5194/amt-9-383-2016, 2016.
Hoeting, J. A., Madigan, D., Raftery, A. E., and Volinsky, C. T.: Bayesian Model averaging: A Tutorial, Stat. Sci., 14, 382–417, 1999.
Holben, B. N., Eck, T. F., Slutsker, I., Tanré, D., Buis, J. P., Set-zer, A., Vermote, E., Reagan, J. A., Kaufman, Y. J., Nakajima, T., Lavenu, F., Jankowiak, I., and Smirnov, A.: AERONET – a
federated instrument network and data archive for aerosol char-acterization, Remote Sens. Environ., 66, 1–16, 1998.
Holzer-Popp, T., de Leeuw, G., Griesfeller, J., Martynenko, D., Klüser, L., Bevan, S., Davies, W., Ducos, F., Deuzé, J. L.. Graigner, R. G., Heckel, A., von Hoyningen-Hüne, W., Kolmo-nen, P., Litvinov, P., North, P., Poulsen, C. A., Ramon, D., Sid-dans, R., Sogacheva, L., Tanre, D., Thomas, G. E., Vountas, M., Descloitres, J., Griesfeller, J., Kinne, S., Schulz, M. and Pinnock, S.: Aerosol retrieval experiments in the ESA Aerosol_cci project, Atmos. Meas. Tech., 6, 1919–1957, https://doi.org/10.5194/amt-6-1919-2013, 2013.
Huneeus, N., Chevallier, F., and Boucher, O.: Estimating aerosol emissions by assimilating observed aerosol optical depth in a global aerosol model, Atmos. Chem. Phys., 12, 4585–4606, https://doi.org/10.5194/acp-12-4585-2012, 2012.
Kahn, R. A., Gaitley, B. J., Garay, M. J., Diner, D. J., Eck, T. F., Smirnov, A., and Holben, B. N.: Multiangle Imaging SpectroRa-diometer global aerosol product assessment by comparison with the Aerosol Robotic Network, J. Geophys. Res., 115, D23209, https://doi.org/10.1029/2010JD014601, 2010.
Kennedy, M. C. and O’Hagan, A.: Bayesian Calibration of Com-puter Models, J. Roy. Stat. Soc. B, 63, 425–464, 2001.
Kleipool, Q.: OMI/Aura Surface Reflectance Clima-tology L3 Global Gridded 0.5 degree x 0.5 degree V3, Greenbelt, MD, USA, Goddard Earth Sciences Data and Information Services Center (GES DISC), https://doi.org/10.5067/Aura/OMI/DATA3006, 2010.
Kolmonen, P., Sogacheva, L., Virtanen, T.H., de Leeuw, G., and Kulmala, M.: The ADV/ASV AATSR aerosol retrieval algo-rithm: current status and presentation of a full-mission AOD data set, Int. J. Digital Earth, 9, 545–561, 2016.
Levelt, P. F., van den Oord, G. H. J., Dobber, M. R., Mälkki, A., Visser, H., de Vries, J., Stammes, P., Lundell, J. O. V., and Saari, H.: The Ozone Monitoring Instrument, IEEE T. Geosci. Remote, 44, 1093–1101, 2006.
Levy, R. C., Remer, L. A., Kleidman, R. G., Mattoo, S., Ichoku, C., Kahn, R., and Eck, T. F.: Global evaluation of the Collection 5 MODIS dark-target aerosol products over land, Atmos. Chem. Phys., 10, 10399–10420, https://doi.org/10.5194/acp-10-10399-2010, 2010.
Livingston, J. M., Redemann, J., Russell, P. B., Torres, O., Vei-helmann, B., Veefkind, P., Braak, R., Smirnov, A., Remer, L., Bergstrom, R. W., Coddington, O., Schmidt, K. S., Pilewskie, P., Johnson, R., and Zhang, Q.: Comparison of aerosol opti-cal depths from the Ozone Monitoring Instrument (OMI) on Aura with results from airborne sunphotometry, other space and ground measurements during MILAGRO/INTEX-B, Atmos. Chem. Phys., 9, 6743–6765, 2009.
MacKay, D. J. C.: Bayesian interpolation, Neural Comput., 4, 415– 447, https://doi.org/10.1162/neco.1992.4.3.415, 1991.
Määttä, A., Laine, M., Tamminen, J., and Veefkind, J. P.: Quantifi-cation of uncertainty in aerosol optical thickness retrieval aris-ing from aerosol microphysical model and other sources, applied to Ozone Monitoring Instrument (OMI) measurements, Atmos. Meas. Tech., 7, 1185–1199, https://doi.org/10.5194/amt-7-1185-2014, 2014.
OMAEROZ.003/doc/README.OMAERO.pdf (last access: 23 October 2017), 2011.
OMI Level 1B Output products and Metadata, available at: http://projects.knmi.nl/omi/documents/calibration/SD467_ IODS_Vol_2_L1b_Products.pdf (last access: 23 October 2017), 2009.
OMI row anomaly team: Background information about the Row Anomaly in OMI, available at: http://projects.knmi.nl/omi/ research/product/rowanomaly-background.php (last access: 23 October 2017), 2016.
OMLER Readme Document: OMI Surface Reflectance Cli-matology README, available at: https://projects.knmi.nl/ omi/research/product/reflectance/OMI-Aura_L3-OMLER_ 2005m01-2009m12_v003-README.pdf (last access: 23 October 2017), 2010.
Povey, A. C. and Grainger, R. G.: Known and unknown unknowns: uncertainty estimation in satellite remote sensing, Atmos. Meas. Tech., 8, 4699–4718, https://doi.org/10.5194/amt-8-4699-2015, 2015.
Rasmussen, C. E. and Williams, C. K. I.: Gaussian Processes for Machine Learning, The MITT Press, available at: http://www. GaussianProcess.org/gpml (last access: 23 October 2017), 2006. Robert, C. P.: The Bayesian Choice, From Decision-Theoretic Foundations to Computational Implementation, 2nd Edn., Springer, New York, 2007.
Spiegelhalter, D. J., Best, N. G., Carlin, B. P., and van der Linde, A.: Bayesian measures of model complexity and fit, J. Roy. Stat. Soc. B, 64, 583–639, 2002.
Stein-Zweers, D. and Veefkind, P.: OMI/Aura Multi-wavelength Aerosol Optical Depth and Single Scattering Albedo 1-orbit L2 Swath 13x24 km V003, NASA Goddard Space Flight Center, Goddard Earth Sciences Data and Information Services Cen-ter (GES DISC), https://doi.org/10.5067/Aura/OMI/DATA2001, 2012.
Thomas, G. E., Poulsen, C. A., Sayer, A. M., Marsh, S. H., Dean, S. M., Carboni, E., Siddans, R., Grainger, R. G., and Lawrence, B. N.: The GRAPE aerosol retrieval algorithm, Atmos. Meas. Tech., 2, 679–701, https://doi.org/10.5194/amt-2-679-2009, 2009. Torres, O., Decae, R., Veefkind, J. P., and de Leeuw, G.: OMI
Aerosol Retrieval Algorithm, in: OMI Algorithm Theoretical Ba-sis Document: Clouds, Aerosols, and Surface UV Irradiance, 3, version 2, OMI-ATBD-03, edited by: Stammes, P., NASA God-dard Space Flight Center, Greenbelt, Md, 47–71, 2002. Torres, O., Tanskanen, A., Veihelmann, B., Ahn, C., Braak, R.,
Bhartia, P. K., Veefkind, P., and Levelt, P.: Aerosols and surface UV products from Ozone Monitoring Instrument ob-servations: An overwiew, J. Geophys. Res., 112, D24S47, https://doi.org/10.1029/2007JD008809, 2007.
Veefkind, P.: OMI/Aura Cloud Pressure and Fraction (O2-O2 Absorption) 1-Orbit L2 Swath 13x24km V003, Greenbelt, MD, USA, Goddard Earth Sciences Data and Information Services Center (GES DISC), https://doi.org/10.5067/Aura/OMI/DATA2007, 2006.
Veihelmann, B., Levelt, P. F., Stammes, P., and Veefkind, J. P.: Sim-ulation study of the aerosol information content in OMI spectral reflectance measurements, Atmos. Chem. Phys., 7, 3115–3127, https://doi.org/10.5194/acp-7-3115-2007, 2007.
Wagner, S. C., Govaerts, Y. M., and Lattanzio, A.: Joint retrieval of surface reflectance and aerosol optical depth from MSG/SEVIRI observations with an optimal estimation approach: 2. Imple-mentation and evaluation, J. Geophys. Res., 115, D02204, https://doi.org/10.1029/2009JD011780, 2010.
Wang, J., Xu, X., Spurr, R., Wang, Y., and Drury, E.: Improved algo-rithm for MODIS satellite retrievals of aerosol optical thickness over land in dusty atmosphere: Implications for air quality mon-itoring in China, Remote Sensing of Environment, 114, 2575– 2583, 2010.
Wang, J., Xu, X., Henze, D. K., Zeng, J., Ji, Q., Tsay S.-C., and Huang, J.: Top-down estimate of dust emissions through integration of MODIS and MISR aerosol retrievals with the GEOS-Chem adjoint mode, Geophys. Res. Lett., 39, L08802, https://doi.org/10.1029/2012GL051136, 2012.
Winker, D. M.,Vaughan, M. A., Omar, A. H., Hu, Y., Pow-ell, K. A., Liu, Z., Hunt, W. H., and Young, S. A.: Overview of the CALIPSO mission and CALIOP data pro-cessing algorithms, J. Atmos. Ocean. Tech., 26, 2310–2323, https://doi.org/10.1175/2009JTECHA1281.1, 2009.
Xu, X., Wang, J., Henze, D. K., Qu, W., and Kopacz, M.: Constraints on aerosol sources using GEOS-Chem ad-joint and MODIS radiances, and evaluation with multisen-sor (OMI, MISR) data, J. Geophys. Res., 118, 6396–6413, https://doi.org/10.1002/jgrd.50515, 2013.