582 | 2017 | ISSUE 3 | VOLUME 12 © 2017 University of Alicante
Breath-hold diving performance factors
FRANCISCO DE ASÍS FERNÁNDEZ1 , JOSÉ MARÍA GONZÁLEZ-RAVÉ2, DANIEL JUÁREZ2
1 La Salle University Higher Studies Center, Autonomous University of Madrid, Spain 2 Faculty of Sports Sciences, University of Castilla-La Mancha, Spain
ABSTRACT
In this study we analyzed the relation of several predictors with Apnea Indoor. 56 divers participated in this observational research. Were measured the individual performance in Apnea Indoor, hemoglobine, blood volume, VO2max, body composition, resting metabolic rate and the heart rate and oxygen saturation during a maximal static apnea. We noted a correlation between vital capacity (r = 0.539; p≤0.05), blood volume (r = 0.466; p ≤0.05), body lean percentage (r = 0.406; p ≤0.05) the minimal heart rate (r = -0.624; p ≤0.05) and the lowest oxygen saturation 0.485; p ≤0.05) obtained during static apnea with Apnea Indoor performance.
Key words: APNEA INDOOR, EXERCISE, TRAINING, TESTING.
1Corresponding author. Associate Professor at Faculty of Health, La Salle University Higher Studies Center, Autonomous
University of Madrid, Spain.http://orcid.org/0000-0001-7955-7255 E-mail: [email protected]
Submitted for publication May 2017 Accepted for publication August 2017
JOURNAL OF HUMAN SPORT & EXERCISE ISSN 1988-5202 © Faculty of Education. University of Alicante
doi:10.14198/jhse.2017.123.03 Cite this article as:
VOLUME 12 | ISSUE 3 | 2017 | 583 INTRODUCTION
During Apnea Indoor championship, the divers, through a single voluntary apnea, compete to remain the maximal time in a static position - Static apnea (STA), and to dive the longest distance; with fins - Dynamic with Fins (DYN) and no fins - Dynamic no Fins (DNF).
According to evidence (Schagatay, 2009; Rahn, 1964), trained freedivers have greater oxygen storage available than untrained; thus, whereas a 70-kg person can store 1996 ml of oxygen (820 ml in the lungs, 880 ml in the blood and the rest in other tissues), it is estimated that an elite diver with similar anthropometry is capable of storing up to 3200 ml of oxygen in the body (1650 ml in the lungs, 1100 ml in the blood and the rest in other tissues).
Environmental conditions, fitness, body composition, nutritional status, psychophysical relaxation or diving reflex are several factors that may influence in the individual metabolic rate during apnea (Fernández, 2015; Lindholm, 2007).
During immersion, the diver low his metabolic rate through a deep relaxation; helped by a bradycardia triggered by the diving reflex and, later, as a defense mechanism prevent hypoxia (Andersson, 2009). Thus, for instance, a breath-hold diver with 55 bpm at rest, is able to remain at 35–45 bpm and to reach a nadir value of 25–30 bpm during apnea.
Progressive hypercapnia and hypoxia stimulates the respiratory receptors that trigger contractions in the inspiratory muscles (Perez, 1998); the growing accumulation of CO2 and lactic acid produces gradual acidification of the organism, causing a "burning sensation" in specific swimming muscles (Olsen et al., 1962). In that point, the diver must to remain in an optimal state of relaxation and concentration, in order to maintain a low metabolic rate to preserve oxygen despite these stress conditions.
Regarding dynamic apnea, in addition to an adequate underwater swimming technique, the diver has to produce a reasonable energy expenditure; i.e., on the one hand, he must not swim too slow because the organism consumes oxygen at a constant rate and, on the other, the energy expenditure used in each stroke should remain within certain energy limits. Furthermore, to achieve a neutral buoyancy that allows all the momentum—and energy expenditure—to be used in an exclusively horizontal direction, the diver must balance all intrinsic factors (body fat percentage, vital capacity, lean mass and bone mineral density) with extrinsic factors (wetsuit and neck/waist weights). Besides influencing buoyancy, swimsuits, affect the compress body shape, reducing the passive drag from the water (Cortesi et al., 2014). On the other hand, there is evidence that trained swimmers use less oxygen than the untrained at the same swimming speed and, also, they swim faster with an equivalent energy expenditure, than untrained swimmers (Holmér, 1972).
A common predictor factor for all apnea disciplines is immersion time, which in static apnea can be influenced by total storage capacity of O2/CO2 in the body, metabolic rate and individual tolerance to asphyxia; besides, the performance in dynamic disciplines is influenced by the underwater swimming efficiency.
584 | 2017 | ISSUE 3 | VOLUME 12 © 2017 University of Alicante
METHODS
Participants
56 male breath-hold divers (36 ± 5.07 years of age) with 2.09 ± 0.66 years of experience in Apnea Indoor participated in this study. The participants were informed of the benefits and risks prior to signing the informed consent document to participate in the research. The study was approved by the local Ethics Committee and conducted in accordance with the Helsinki Declaration (Harriss and Atkinson, 2011).
Design
We performed an observational study, from January 2015 to July 2016, with 56 measurements in total.
Procedures
Test were performed in a sports laboratory, health center and a 25m pool under similar environmental conditions: 550 m altitude, 22.5±1.9°C, with 55% relative humidity in the lab and 26.5±1.4°C water temperature. The test battery sequence was structured to avoid side effects between the various tests; thus, measurements were performed chronologically in five visits, as follows: In the first three visits, individual performance in the Apnea Indoor is measured; i.e., in static (STA), dynamic (DYN) and dynamic no fins (DNF). On the fourth visit, a body composition, blood count, indirect blood volume test, spirometry and an incremental treadmill test were performed. On the fifth visit, the resting metabolic rate was analyzed and the heart rate and oxygen saturation during a maximum dry static apnea were monitored.
Apnea indoor performance
The advantages of pre-competition warm-up have been previously studied (Schagatay, 2010). This study attempts to develop protocols for the previous phase of apnea to avoid possible warming effects. Thus, the STA 15-minute warm-up consisted of 10 minutes’ relaxation, 2 minutes of static apnea and a 3-minute
countdown. Regarding the DYN and DNF, a 15-minute warm-up was performed comprising 10 minutes’
relaxation, 50 m in the specific (fins or no fins) dynamic discipline and a 3-minute countdown. After warm-up, the divers attempted to achieve the maximal individual time or distance. In all the disciplines, during the last 30 seconds of the countdown, the participant placed the nose clip and performed a deep but not maximal inspiration.
Body composition
Anthropometric measurements included height and body mass (bascule stadiometer; SECA 720, Vogel & Halke). Body fat, fat-free mass and bone mineral content were measured by whole body dual-energy x-ray absorptiometry (GE Lunar Prodigy; GE Healthcare, Madison, WI).
Hemoglobine and blood volume
The blood count was collected at the health center and under fasting conditions. Blood volume was obtained with the Nadler formula (Nadler et al., 1962), using previous anthropometric measurements.
Vital capacity
VOLUME 12 | ISSUE 3 | 2017 | 585
Maximal oxygen consumption
The incremental test to measure VO2max and HRmax was performed on a treadmill (H/P/COSMOS 3P ® 4.0, H / P / Cosmos Sports & Medical, Nussdorf-Traunstein, Germany). The volume and composition of expired gases were measured using a gas analyzer (Ultima CPX, Medical Graphics) and the heart rate
measured by ECG (WelchAllyn, CardioPerfect). After a 5-minute warm-up at 10 km•h-1, the speed was
increased 1 km•h-1 every minute until volitional exhaustion of the participant. Throughout the test, the treadmill elevation was maintained at 1%.
Resting metabolic rate
The divers were measured, breath-to-breath (Ultima CPX, Medical Graphics), over 15 minutes by indirect calorimetry. According to previous studies [15], a minimum of 15 minutes of steady state, determined as <10% fluctuation in VO2 and <5% fluctuation in RER, was considered criteria for valid RMR.
Heart rate and oxygen saturation during static apnea
Heart rate and oxygen saturation were monitored during a maximal static apnea in dry conditions. Before beginning the test, the diver rested for 10 minutes in the prone position with head and arms leaning on a table placed in front of the stretcher (Image 1). During the last 30 seconds of the countdown, a nose clip was placed to avoid possible air leakage. At that point, the participant performed a profound exhalation followed by a deep but not maximal inspiration; glossopharyngeal insufflation was not allowed. Throughout the test, the average heart rate (AHR-avg) and the minimum heart rate (AHR-min) were recorded. In order to calculate the HRsta, only HR data starting from the first 30 seconds of apnea, once the HR was stabilized (Breskovic, 2011), were considered for further analysis. The SpO2 was monitored by a pulse oximeter (CMS 50F) placed on the second finger of the left hand.
Statistical Analysis
To compare inter subject HR data, the percentage of each HR value was calculated from the individual maximal HR (% HRmax), which was previously measured in the incremental test.
All data from the 56 measurements were pooled and analyzed by Statistical Package for Social Sciences (SPSS v.19 for Windows). The data were screened for normality of distribution using the Shapiro-Wilks test. The correlation test was calculated by R Pearson and the criterion for statistical significance was set at p
≤.0.05.
RESULTS
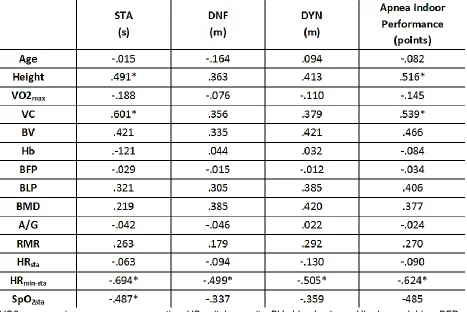
586 | 2017 | ISSUE 3 | VOLUME 12 © 2017 University of Alicante Table 1. Correlation analysis by R Pearson between predictors with Apnea Indoor performance.
VO2max= maximum oxygen consumption; VC= vital capacity; BV= blood volume; Hb= hemoglobine; BFP= body fat percentage; BLP= body lean percentage; BMD= bone mineral density; A/G= ratio android and gynoid fat; RMR= metabolic rate in rest conditions; HRsta= average heart rate during static apnea in dry
conditions; HRmin-sta= minimum heart rate during static apnea in dry conditions; SpO2sta= minimum oxygen saturation during static apnea in dry conditions. p ≤ 0.05.
Apnea Indoor Performance
To measure Apnea Indoor performance, the International Association for the Development of Apnea (AIDA) points system was established; thus, for STA, each second the athlete remains immersed is multiplied by 0.2; whereas for DNF and DYN, each meter reached was multiplied by 0.5.
POINTS variable is constructed from the variables STA, DNF and DYN; thus, it has a high correlation with the previous three (r = 0.9 in all cases). Thus, the STA, DNF and DYN variables were obtained to study the performance as a set of these three disciplines and the POINTS variable was used as a global performance predictor.
The range of individual values of Apnea Indoor performance was 103±27 points in the pooled subjects. Regarding disciplines, STA performance was established in 197±59 seconds and, DYN and DNF performance, in 70±20 meters and 60±17 meters, respectively.
Correlation between performance factors with Apnea Indoor Performance Age
VOLUME 12 | ISSUE 3 | 2017 | 587
Height
Mean (SE) height was 176(7) cm with a range from 163 to 197cm. There was a positive correlation between height and performance score (r =0.52; P <0.05; Table 1).
Vital capacity
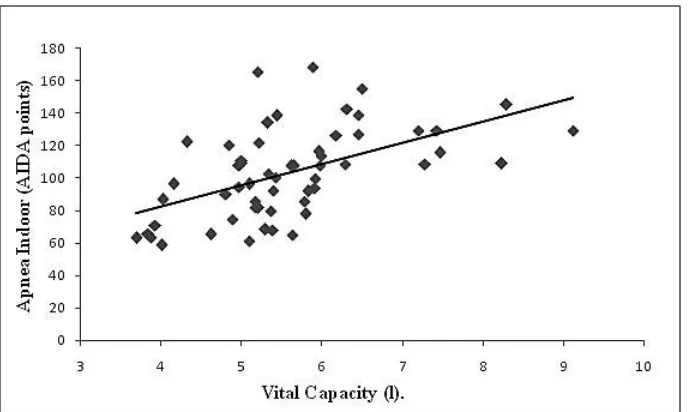
Mean (SE) VC was 5.59(1.1) L with a range from 3.7 to 9.1L. There was a positive correlation between VC and performance score (r =0.54; P <0.05; Figure 1; Table 1).
Hemoglobine
Mean (SE) Hb was 15.6(1.1) g/dl with a range from 14.1 to 17.7g/dl. No correlation between Hb and Apnea Indoor performance was observed.
Blood volume
Mean (SE) blood volume was 5.1(0.6) L with a range from 4.1 to 6.1L. There was a positive correlation between BV and performance score (r =0.47; P <0.05; Table 1).
Maximal aerobic capacity
Mean (SE) maximal aerobic capacity was 49(7) ml/kg/min with a range from 33 to 68ml/kg/min. No correlation between VO2max and Apnea Indoor performance was observed.
Body Fat Percentage (BFP)
Mean (SE) BFP was 24.5(6.8) % with a range from 11.9 to 36.7%. No correlation between BFP and Apnea Indoor performance was observed.
Body Lean Pertentage (BLP)
Mean (SE) BLP was 69.9(14.9) % with a range from 61.3 to 84.1% There was a positive correlation between BLP and performance score (r =0.41; P <0.05; Table 1).
Bone Mineral Density (BMD)
Mean (SE) BMD was 1.28(0.09) g/cm2 with a range from 1.08 to 1.49g/cm2. No correlation between BMD and Apnea Indoor performance was observed.
Fat distribution (Ratio A/G)
Mean (SE) A/G was 1.1(0.2) with a range from 0.6 to 1.5. No correlation between fat distribution and Apnea Indoor performance was observed.
Rest Metabolic Rate
Mean (SE) RMR was 1.16(0.23) cal*min with a range from 0.71 to 1.64cal*min. No correlation between fat RMR and Apnea Indoor performance was observed.
Heart rate during dry static apnea
Mean (SE) HRsta was 30.5(3.3) % HRmax with a range from 22.9 to 36.8 % HRmax No correlation between HRsta and Apnea Indoor performance was observed.
588 | 2017 | ISSUE 3 | VOLUME 12 © 2017 University of Alicante NADIR value of oxygen saturation during dry static apnea (SpO2min-sta)
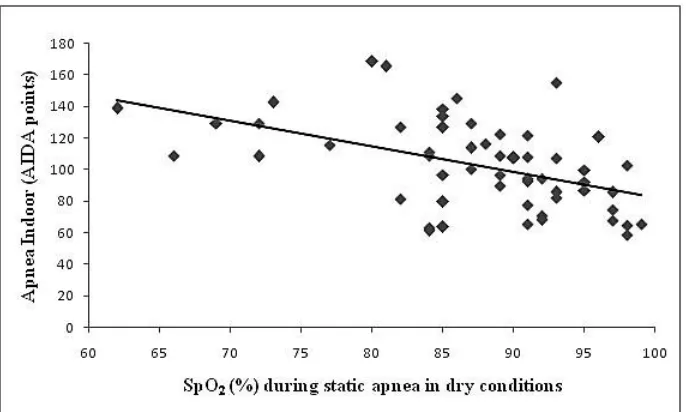
Mean (SE) SpO2min-sta was 87.3(8.3) % with a range from 62 to 99%. There was an inverse correlation between SpO2min-sta and performance score (r = -0.49; P <0.05; Figure 3; Table 1).
Figure 1. Correlation analysis between Vital Capacity with Apnea Indoor performance. r = 0.601. p ≤ 0.05.
Figure 2. Correlation analysis between minimum heart rate during static apnea in dry conditions with Apnea Indoor performance.
VOLUME 12 | ISSUE 3 | 2017 | 589
Figure 3. Correlation analysis between minimum oxygen saturation reached during static apnea in dry conditions with Apnea Indoor performance.
r = -0,485. p ≤ 0.05.
DISCUSSION
Contributions from O2/CO2 body storage capacity in Apnea Indoor performance
Total O2/CO2 body storage capacity has previously been correlated with Apnea Indoor performance- especially with static discipline (Fernández, 2015); however, the O2/CO2 available in the body depends on several stores (Schagatay, 2009) in which, the lungs and circulating hemoglobin are prominent.
Among the factors examined in this study, the divers with the highest VC showed, also, the highest performance in the Apnea Indoor.
Also, the height was shown as a good predictor of Apnea Indoor performance. It is thought to be that the highest divers have an anthropometric advantage that gives them, in addition to a known increased swimming efficiency (Zampagni, 2008), a greater underwater swimming efficiency.
According to the results provided by this research, resting hematological values were not correlate with performance in any of the Apnea Indoor disciplines. In other study, (Prommer, 2007) concluded that trained and untrained freedivers had similar levels of baseline Hb; in contrast, a study by Bruijn (De Bruijn, 2004) in which elite divers showed higher baseline Hb levels than elite skiers or untrained subjects.
A possible reason for this divergence may be that others performance factors, such as the individual Tolerance to Asphyxia, are more decisive in the total Apnea Indoor performance, masking the influence of hemoglobine.
590 | 2017 | ISSUE 3 | VOLUME 12 © 2017 University of Alicante Maximal aerobic capacity is closely related to performance in endurance sports (Bassett and Howley, 2000); however, the role of the maximal aerobic capacity in Apnea Indoor performance is currently an open discussion among scientists and coaches. In this study, the results indicate no correlation between individual VO2max and Apnea Indoor performance, perhaps due to non-specific VO2max testing. Despite this lack of correlation with Apnea Indoor performance; from a global perspective, a high aerobic capacity could improve recovery ability (Tomlin and Wenger, 2001) by an increased diffusion and transport of O2 / CO2, allowing a greater stimulus training that could trigger, in turn, a greater physiological adaptation.
Contributions from Metabolic Rate in Apnea Indoor performance
The ability to achieve a low metabolic rate during apnea (30-40 bpm) - and the moments leading up to it (40-50bpm) - is thought to be a good predictor in the Apnea Indoor performance (Telles et al., 2000). The inverse correlation showed in the results of this study, between HRmin-sta and Apnea Indoor performance suggests that those divers who are able to lower their HR to minimum, even for only a moment, get better results in Apnea Indoor than divers who do not.
Regarding body composition, the results concluded that BFP, within healthy parameters, is not correlated with Apnea Indoor performance. Other articles suggest the role of fat as thermal insulation, preventing energy
loss due to the chills caused by the body’s adaptation to cold water exposure (Tikuisis, 2000); however, the
use of wetsuits and thermal pools during training and testing has removed the influence of this factor. In addition, the results of this study show that fat distribution, expressed in the ratio A/G, is unrelated to Apnea Indoor performance. In contrast, BLP is correlated with Apnea Indoor performance, showing a similar correlation with static and dynamic disciplines. These results suggest that muscle mass could propose several benefits beyond increased swimming speed (Hawley, 1992), such as: an increased intramuscular myoglobin storage (Möller and Sylvén, 1981) and increased blood volume (Feldschuh and Enson, 1977).
Contributions from Tolerance to Asphyxia in Apnea Indoor performance
Despite the difference in total lung capacity, blood volume or a low metabolic rate, the first line separating an amateur diver from a professional diver is defined by the individual tolerance to asphyxia. Only trained divers are able to withstand the feeling of asphyxia resulting from high levels of CO2 and acidosis; facing then, with a severe hypoxia.
According to the results showed in this study, and taking into account that hyperventilation was not allowed, the divers who were able to achieve a pronounced hypoxia; i.e., who were able to tolerate a physical and psychological stress, obtained the highest results in Apnea Indoor performance.
CONCLUSIONS
We noted a correlation between vital capacity, blood volume, body lean percentage, the minimal heart rate and the lowest oxygen saturation obtained during static apnea with Apnea Indoor performance.
PERSPECTIVE
VOLUME 12 | ISSUE 3 | 2017 | 591
From the obtained results, athletes and coaches, could prescribe exercise to increase their breath-hold performance; besides, apnea training can increase the performance in other sports that, similar to breath-hold, produce a pronounced hypercapnia and hypoxia: for instance, martial arts, altitude sports or endurance sports.
REFERENCES
1. Andersson, J. (2009). Arterial oxygen saturation and diving response during dynamic apneas in breath-hold divers. Scand. J. Med. Sci. Spor., 1, 87-91.
2. Bassett, D.R., & Howley, E.T. (2000). Limiting factors for maximum oxygen uptake and determinants of endurance performance. Med. Sci. Sports. Exerc., 32, 70-84.
3. Breskovic, T. (2011). Cardiovascular changes during underwater static and dynamic breath-hold dives in trained divers. J. Appl. Physiol., 3, 673-678.
4. Cortesi, M., et al. (2014). Passive Drag Reduction Using Full-Body Swimsuits: The Role of Body Position. J. Strength. Cond. Res., 11, 3164-3171.
5. Costa, D., Gales, N., & Crocker, D. (1998). Blood Volume and Diving Ability of the New Zealand Sea Lion, Phocarctoshookeri. Physiological Zoology, 71, 208-213.
6. De Bruijn, R. (2004). Hemoglobin levels in elite divers, elite skiers and untrained humans. In: Proceedings of the 33rd Annual Scientific Meeting of the European Underwater and Baromedical Society. Corsica, France.
7. Hawley, J.A. (1992). Muscle power predicts freestyle swimming performance. Br. J. Sports. Med., 26, 151-155.
8. Holmér, I. (1972). Oxygen uptake during swimming in man. J. Appl. Physiol., 33, 502-509.
9. Feldschuh, J., Enson, Y. (1977). Prediction of the normal blood volume. Relation of blood volume to body habitus. Circulation, 56, 605-12.
10. Fernández, F.A. (2015). Predicting static and dynamic apnea performance in elite divers using a 2-minute static apnea test. In: Proceedings of the 41st Annual Scientific Meeting of the European Underwater and Baromedical Society. Amsterdam.
11. Fernández, F.A. (2015). Periodization of apnea training. Doctoral thesis, University of Castilla-la Mancha.
12. Harriss, D., Atkinson, G. (2011). Update - Ethical standards in sport and exercise science research. Int. J. Sports. Med., 32, 819-21.
13. Lindholm, P. (2007). Effects of fasting and carbohydrate consumption on voluntary resting apnea duration. Eur. J. Appl. Physiol., 100(4), 417-25.
14. Möller, P., & Sylvén, C. (1981). Myoglobin in human skeletal muscle. Scand. J. Clin. Lab. Invest., 41, 479-482.
15. Nadler, S., Hidalgo, J., & Bloch, T. (1962). Prediction of blood volume in normal human adults. Surgery, 51, 224.
16. Olsen, C.R., Fanestil, D.D., & Scholander, P.F. (1962). Some effects of apneic underwater diving on blood gases, lactate, and pressure in man. J. Appl. Physiol., 17, 938-942.
17. Perez, M.E. (1998). Control de la respiración. Manual de Neumología y Cirugía Torácica. IL. EditoresMédicos.
18. Prommer, N. (2007). Total haemoglobin mass and spleen contraction: a study on competitive apnea divers, non-diving athletes and untrained control subjects. Eur. J. Appl. Physiol., 6, 753-759. 19. Rahn, H. (1964). Oxygen stores of man. IL: Dickens & Neil.
592 | 2017 | ISSUE 3 | VOLUME 12 © 2017 University of Alicante 21. Schagatay, E. (2010). Predicting performance in competitive apnea diving, part II: dynamic apnoea.
Diving Hyperb. Med., 1, 11-22.
22. Telles, S., Reddy, S., & Nagendra, H.R. (2000). Oxygen Consumption and Respiration Following Two Yoga Relaxation Techniques. Appl. Psychophysiol. Biofeedback, 25, 221-227.
23. Tikuisis, P. (2000). Comparison of thermoregulatory responses between men and women immersed
in cold water. J. Appl. Physiol., 89, 1403-1411.
24. Tomlin, D.L., & Wenger, H.A. (2001). The relationship between aerobic fitness and recovery from high intensity intermittent exercise. Sports Med., 31, 1-11.