Statistical Analysis and Visualization Solution
for Multidimensional Data
1
Prarthana A. Deshkar,
2Dr. Parag S. Deshpande,
3Prof. A. Thomas
1Ph.D. Scholar CSE Dept. G.H.Raisoni College of Engineering, Nagpur, India
2Supervisor, CSE dept, G. H. Raisoni College of Engineering, Nagpur, India
3Dept. of CSE, G. H. Raisoni College of Engineering, Nagpur, India
Abstract
From the ancient time it is observed that statistics plays very important role in the analysing data and so as to make the decisions. Due to the speed of the data generation and various formats in which data is generated, it is challenging to analyze such data. Organizations are trying to dig inside the data and extracting the insights from the data using advanced statistical analytics. With the help of statistical algorithms data scientist can discover the patterns present in data which would have unnoticed. Always it is not possible to have technically expert data analyst. The ITDA (Integrated Tool for Data Analysis) project focuses on providing one stop solution for data analysis and visualization using statistical analysis and data mining techniques. The objective of this paper is to introduce with the statistical analysis capability of ITDA.
Keywords
Statistical Algorithms, Decision Making, Visualization, Multidimensional Analysis
I. Introduction
Organizations prefer sophisticated data analysis tools for the
efficient and effective decision making system. Data analysis
gives the hidden patterns, trends from the data which can be used to make the valuable decisions to enhance the performance of the business or any process.
Data analysis is an umbrella term which includes statistical techniques, data mining algorithms, machine algorithms, etc. ITDA is a system which gives the complete solution for the data analysis needs [1]. Statistical analysis helps to get the quick analysis of the
data. For example, it is very simple to find out the central tendency
or determine the shape of the available data, which is many time prerequisite for the further data analysis [11]. In the current period, statistics is in the changing state in terms of its applications and its users. With the help of statistics organizations can predict the future with the available information. Because of the ability to estimate the population from the sample, statistics catches the importance in the data scientist’s community. Basically there are two main categories of statistics; descriptive and inference. Descriptive statistics describe a data with the help of summaries but does not draw any conclusion. Inferential statistics helps to draw the conclusion from the data [5].
It is not possible that everyone is able to handle the mathematical statistics and make use of it in making decisions. Hence the various data analysis tools are available in the market which possesses different characteristics. Most of the available tools are focusing the business domain, but data analysis is the concept which is applicable for the entire available domain and also in research work. ITDA is a web based system which facilitates the data analysts with the large range of statistical algorithms.
This paper focuses on the ITDA ability to perform the statistical
analysis. The complete statistical algorithms are broadly divided as univariate algorithms and multivariate algorithms. This paper presents complete functionality with result representation of sample algorithms. Last section will discuss the conclusion and future scope.
A. System Design
ITDA provides near about 60 statistical algorithms grouped in various categories like descriptive statistics, time series statistics, association matrix which is further grouped into single stage (Univariate) and two stage (Multivariate) algorithms. As ITDA is a complete data analysis solution, its functionality is not restricted to only statistical algorithms. it also provides the data mining and machine learning algorithms. Multidimensional analysis helps the organizations to take quick and rational decisions. User can perform the statistical analysis directly on the source data or user
can have first the multidimensional data analysis and then can
have the statistical analysis on the result of multidimensional analysis.
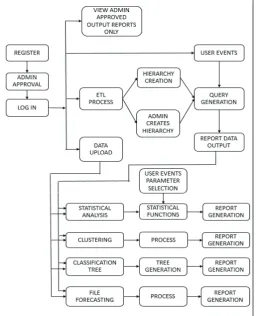
Fig. 1 shows the system architecture. First user has to register after which admin will approve user registration and then user can start
interacting with the system. There are five different categories of
user available listed below.
1. Create Model and use it
This is type 1 user which can upload data and create hierarchy and can perform multidimensional analysis and various types statistical analysis on data generated by multidimensional analysis.
2. Perform Data Analysis
This is type 2 user which can upload data but cannot create hierarchy on itself. Here admin will create hierarchy and then user can do analysis on created hierarchy.
3. Use Existing Models
This is type 3 user which can neither upload data nor create hierarchy on itself. This user can do analysis on already available models. This one is specially created for the guest user with no prior knowledge of multidimensional data.
4. Use Existing Reports
This is type 4 user which can just see the reports available to it and don’t want to bother about any other thing.
5. File Environment
This is type 5 user which can upload data, in various format, on which user directly want to perform statistical analysis, association
Fig. 1: Operational Architecture of ITDA
In the implementation of ETL process in ITDA user is allowed to upload the data in various formats like TXT, CSV and database. An interactive interface is provided to upload the data. Data cleaning and data transformation can be performed in the ETL process. Hierarchy Generation allows user to create hierarchy which will satisfy their business requirement. This facility can be availed by the non technical data analysts [2].
There are total of 50 univariate algorithms grouped into major categories like single series, matrix algorithm, etc which are again grouped into minor categories like descriptive statistics, time series. Also there are 5 multivariate statistical algorithms grouped into two stage algorithms.
II. Implementation Results
A. Univariate Algorithms
Univariate analysis is the simplest form of analyzing data. A variable in univariate analysis is just a condition or subset that data falls into. It can be thought as a “category”. In this section details and results of some sample algorithms are discussed.
1. ANOVA
ANOVA, one way analysis of variance is defined as the technique
to decide, whether there is considerable difference between the means of dissimilar or divergent groups. This algorithm can be used in a situation like, a situation where nutritionist wants to study the impact of the drink on the tendency of the human of losing weight. The drink is categorized as for example, drink A, B, C.
ANOVA technique is going to help in finding out that is there any
difference between the spread of each group, if it not i.e., groups are pretty much the same. In other words we can say weight loss is not related to the type of drink people have.
2. Data Expected
Input required in two dimensional arrays where each column represents groups and number of rows represents samples. In the implementation, ITDA gives the facility to perform analysis in both row wise and column wise manner. So, for column wise analysis rows became groups and number of columns can be considered as number of samples.
Here user just needs to find is there any significant differences
between the means of independent groups and not the exact groups in which there is statistical difference between the mean. Because the result of one way ANOVA is to identify that any two groups
are not similar. But this technique unable to find out exactly which
two groups is not similar.
3. Output and Inference
Fig. 2: ANOVA result in ITDA
Output is ANOVA table as shown in below figure. It includes all
the values that is calculated in calculation part above and also the conclusion which tells whether to accept or reject null hypothesis. It is decided based on F-ratio. F(Dfbg;Dfwg) can be calculated from F-table and if this value is lesser than F-ratio which means null hypothesis should be rejected or if it is larger than F-ratio
then it is accepted. It can be seen from following figure:
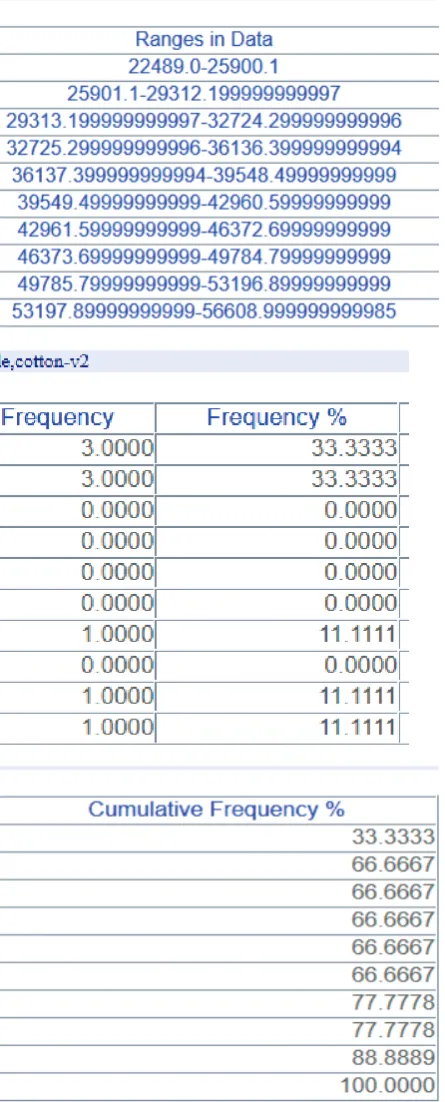
4. Frequency Analysis
Descriptive statistics can be defined as the study of the quantitative
characteristics of the data. Descriptive statistical analysis includes various techniques; frequency analysis is one of them. Number of occurrence of the event is called the frequency. Frequency analysis
play important role in the statistics as it is the simplest way to find
out basic characteristic of data, such as, frequency, central tendency of data, dispersion of data, etc. At a glance data can be interpreted
using the frequency analysis. Every domain including scientific,
research, business, economic, decision making, reporting, make use of the various forms of frequency analysis.
For example in business research, frequency analysis is used to
find out average of customer’s personal characteristics like age,
spending habits, income spread in the particular region, etc. all this information is of great use while deciding the business policies, which can be used in marketing, pricing, while maintaining inventory and so on.
ITDA provides very effective and interactive interface to perform the frequency analysis.
wise or column wise. In implementation of this algorithm number
of buckets are fixed to 10 i.e., data will be categorized into 10
buckets. However this can be taken from user, in how many buckets user wants to categorize data. So, simply data expected is two dimensional arrays.
Output and Inference
Fig. 3: Tabular Display of Frequency Analysis in ITDA
Output for this algorithm is simple as it shows range of each buckets and count i.e., number of values falls in each bucket. After that this values are written in JSON format and provided to highchart.js to get the histogram of the data. Where 10 different buckets gets created and its value on Y-axis suggests count in each buckets. This visualization makes it easy to have deep look
into data.
Fig. 4: Graphical Representation of Frequency Analysis in ITDA
5. Multivariate Algorithms
Multivariate Data Analysis refers to any statistical technique used to analyze data that arises from more than one variable. There are numerous multivariate algorithms some of which are implemented in the ITDA system and is explained in following section.
III. MANCOVA
Multivariate analysis of covariance (MANCOVA) is simply an extension to ANCOVA. In ANCOVA there is only one dependent variable and only one covariate i.e., control variable. MANCOVA is more superior than MANOVA because of its property to exclude the noise which appears due to covariant. Assumptions and output of this algorithm is exactly same as MANOVA algorithm explained below in detail.
A. Utility
As far as utility is concerned MANCOVA has same goal as of MANOVA.
IV. MANOVA
Multivariate analysis of variance (MANOVA) is simply an ANOVA with several dependent variables. That is to say, ANOVA tests for the difference in means between two or more groups, while MANOVA tests for the difference in two or more vectors
of means. This technique is basically helpful in finding whether
there is effect of independent variable on the dependent variable. It also helps to identify the relationship between the dependent variables. It also talks about if there is any relationship present in the independent variables.
A. Data Expected
In this implementation the input for any algorithm is nothing but two dimensional arrays. However for MANOVA algorithm we required to group data in various groups. After multidimensional analysis there is just numeric matrix and not any grouping on data.
So, first step is to select one variable which is to be discretize so
that other data can be grouped on that particular variable. Assumptions for MANOVA are as follows:
To perform the MANOVA technique it is required that within the group dependent variable follows the normal distribution. It is advisable that outliers should be removed before applying MANOVA technique, as outliers can add non-normality in the data.
MANOVA also assumes that pairs of dependent variable posses the linear relationship.
B. Output and Inference
Output of MANOVA is shown by using following table:
Fig. 5: MANOVA Result in ITDA
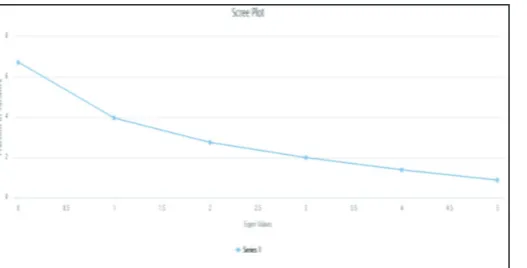
C. Factor Analysis
Factor analysis is the process in which data observations are
represented as functions of number of possible causes, to find
out the most important causes. These important ones are latent or hidden factor and not among the original ones unlike in PCA. If a small number of attributes can be found that group and summarize the original attributes, then we will have achieved both a reduction in dimensionality and an increase in our understanding of the data.
Consider a data set that records the performance of the group of athletes in the ten separate events that comprise the decathlon.
We might find that athletes tend to show same performance in all
events that emphasize speed; i.e., slow athletes are consistently slow and fast athletes are consistently fast. Likewise strength factor can be considered. So, we can consider two underlying factors: speed and strength. Factor analysis attempts to discover such relationship
Data expected for factor analysis in nothing but m by n data matrix. Then over that new matrix will be created which is m by p new matrix where `p’ is the number of factors. It is taken as a input from user, which indicates there will be f1, f2,..,.., fp are latent factors.
D. Output and Inference
In output, factors are arranged in ascending order of their Eigen values. Output gives factor loadings matrix which shows for each of the original attributes, how the original value depends on the latent factors. To make result visualization more effective, ITDA provides a facility to have a look into graphical representation of factors. User can select two factors across which graph can be plotted. Screen plot of Eigen values is also provided in output of factor analysis.
Fig. 6: Screen Plot Output in ITDA
Fig. 7: Factor Plot Output in ITDA
V. Conclusion and Future Scope
The ITDA is a complete solution for multidimensional data analysis of high volume data without generating cube for storing aggregations. In this paper statistical analysis ability of ITDA is discussed. This design obviates the need for users to know programming.
There is considerable scope of adding many more statistical algorithms. Some more data mining algorithms can be added for
more accurate and efficient decision making.
References
[1] Prarthana A. Deshkar, Parag S. Deshpande, A. Thomas, “A software Infrastructure for Multidimensional data Analysis: A Data Modeling Aspect”, International Journal of Computer Science and Information Security, Vol. 16, No. 1, 2018. [2] Prarthana A. Deshkar, Parag S. Deshpande, A. Thomas,
“Multidimensional Data Analysis Facilities and Challenges: A Survey for Data Analysis Tools”, International Journal of Computer Applications, Vol. 179, No. 13, 2018.
[3] Manasi Vartak, Sajjadur Rahman, Samuel Madden, Aditya
Parameswaran, Neoklis Polyzotis,“SEEDB: Efficient
Data-Driven Visualization Recommendations to Support Visual Analytics”, Proceedings of the VLDB Endowment, Vol. 8, No. 13 Copyright 2015 VLDB Endowment 2150-8097/15/09. [4] Data Modeling Guide, IBM Cognos Analytics Version 11.0.0,
Copyright IBM Corporation 2015, 2017.
[5] [Online] Available: https://www.businessnewsdaily. com/6000-statistical-analysis.html, Chad Brooks, Business News Daily, February 28, 2014
[6] Sandro Fiore, Alessandro D’Anca, Donatello Elia, Cosimo Palazzo, Ian Foster, Dean Williams, Giovanni Aloisio,
“Ophidia: A full software stack for scientific data analytics”,
2014 IEEE.
[7] S. Fiorea, A. D’Ancaa, C. Palazzoa,b, I. Fosterc, D. N. Williamsd, G. Aloisioa,“Ophidia: toward big data analytics for eScience”, 2013 International Conference on Computational Science, 2013.
[8] Architecture for Enterprise Business Intelligence, an overview of the microstrategy platform architecture for big data, cloud bi, and mobile applications
[9] Usman AHMED,“Dynamic Cubing for Hierarchical Multidimensional Data Space”, PhD thesis, February 2013.
[10] Muntazir Mehdi, Ratnesh Sahay, Wassim Derguech, Edward Curry,“On-The-Fly Generation of Multidimensional Data Cubes for Web of Things”, IDEAS ’13 October 09 - 11 2013, Barcelona, Spain
html, James Alan Miller, September 17, 2012
[12] Yang Zhang, Simon Fong, Jinan Fiaidhi, Sabah Mohammed,“Real-Time Clinical Decision Support Systemwith Data StreamMining”, Hindawi Publishing Corporation Journal of Biomedicine and Biotechnology, Volume 2012.
[13] Sandra Geisler, Christoph Quix, Stefan Schiffer, Matthias
Jarke,“An evaluation framework for traffic information
systems based on data streams”, 2011 Elsevier Ltd. All rights reserved.
[14] IBM Cognos Dynamic Cubes, October 2012.