Analysis of Scientific Research in Selected Institutions in South Africa:
A Bibliometric Study
I
Daisy Jacobs
2Dept of Information Science, University of Pretoria, South Africa
[email protected]
Received: 29th October 2005 Accepted: 6th February 2006
This paper reports the preliminary findings on South Africa's most productive authors, journals and research universities. The paper makes use of Scientometric techniques to assess the quantity and quality of science research papers published by researchers in various journals. The results show that four of the most cited authors represent 40.80% of the total count. The citations per paper for these authors are Bilic N (16.40), Michael JP(6.36), Sacht C(6.00), and Marques HM (4.60). The majority of citations are found within Chemistry (37.0%), followed by Physics (26.0%), Medicine (7.40%) and Biology (7.40%). Analysis of 18 journals indexed in the Journal Citation Report OCR), revealed that only the South African Journal of Geology had an impact factor above one. The journal with the largest numbers of original papers was the South African Journal of Science with 89articles and 1397 total citations in 2003. Statistical analysis, with Pearson's correlation coefficient (p-value <0.05), indicated significant correlation between journal productivity and citation frequency. aswellasbetween citation frequency and immediacy index.
Key words: Scientific Research; Bibliometrics; South Africa; Institutions
Introduction
The qualitative and quantitative evaluation of scientific production is a common need in the entire research world. Scientists searching references for study, committees awarding grants, managers evaluating candidates and students
reading a paper are all determined through the evaluation of their scientific research output (Cole. S, Cole,
&
Simon, 1981). Bibliometrics is a quantitative assessmentof man's cultural progress, including science and technology as may be revealed through bibliographic data. Bibliographic data are those that can be collected, derived or deciphered from different parameters as can be assignedto a document (Sen'.,Subir & Chatterjee, 1990).Bibliometrics offers a powerful set of methods and measures for studying the structure and process of scholarly communication. For a long time bibliometrics based on the number of publications have been used as indicators to evaluate the research capacity and competitiveness of a university (Moed et. AI., 1985). In the quantitative approaches of
evaluation, numbers of publications, citations and highly cited authors and their papers are often considered as science indicators. According to Egge, Rousseau& Van Hoydoonk (2000), different methods applied in counting methods have their problems. But in most cases,these problems and short comings are overlooked or neglected. One of the best-known bibliometric approaches, namely, citation analysis,has become more sophisticated, and the advent of networked
information technologies has led to quantitative and qualitative advances in other bibliometric methods (Christine, Borgman
&
Jonathan, 2002). Bibliometrics thus enables researchers/librarians to contribute to detailed analysis of research activities within their institutions. This is achieved by searching bibliographic databasesand subsequent ranking of individual papers retrieved from scientific sub fields, followed by citation analysis including co-citation analysisand bibliographic coupling (Osareh, 1996)This paper used lSI's EssentialScience Indicators databaseto evaluate the research performance of the five
research-oriented universities from 1994 to 2003 with the number of papers, citations, the average citations per paper, the number of highly cited papers and the number of highly cited authors. The indicators obtained were used to analyseand evaluate the strengths of the universities and the highly cited authors and highly cited South African journals.
The structural approach used in this paper identifies published works and then reviews citation patterns in the literature. This paper further reveals patterns relating to publishing activity by year for individual as well as total number
of publications, comparative analysisamong different fields of study, and most influential authors and cited works. It has also tried to review and analyze journals according to the impact factor and immediacy index. The study endeavoured to
analyze seven main disciplinary fields within medicine, natural & physical sciences and technology. The analysis is commonly shown as time series consisting of running 5-year periods.
I. The original version of this paper was presented at the 10th International Conference of the International Society of Scientometrics and Informetrics, 24th-28th July 2005, Karolinska Institute, Stockholm, Sweden.
• To identify highly productive authors and their contributions.
• To evaluate and identify top South African journals and their performance based on productivity
• To investigate whether there is a significant relationship between productivity, citation frequency, impact factor and cited half-life of South Africa's top journals
• To compare the development of South African relative citation impact for the most productive institutions.
2 Methodology
The data presented in this paper consists of scientific articles published in journals processed on the Institute of Scienctific Information (lSI) databases such as Science Citation Index (SCI), Social Sciences Citation Index (SSCI) and South African Studies Databases. The South African Studies Databases consists of 15 different databases providing access to the great majority of documents published in and about South Africa. Each of the databases provide access to over 938 400 records, touching both science and medicine.
All papers recorded in the annual volumes of the Science Citation Index (SCI) of the Institute for Scientific Information (lSI), as articles, notes or reviews were taken into consideration for the period of 1994-2003. For each paper, the reference data was retrieved from lSI's Web of Science resulting in uniform format and journal abbreviations. Data were collected for the seven disciplines of Physics, chemistrY. Botany, Zoology, Microbiology and Biochemistry Engineering and Clinical medicine.
The data for citation frequency, journal impact factor and cited half life were obtained from the
Journal Citation Reports
(jCR) , an lSI product published annually in two editions (science and social sciences) in print and on CD-ROM. To
determine the impact factor, a common assumption was adopted; that is, the impact can be measured by the number of times a publication is cited from a standard set of journals over a fixed time span. This is the number of citations from the 151databases in a year to all papers in the journal for the two previous years, divided by the number of those papers. According to Wilson and Pittman (2000), the yearly impact factors for some 7000 journals are published in lSI's Journal Citation Reports. Thus the JCR provides a systematic and objective indicator of the relative importance of scholarly journals and the papers within them. With the assumption that the impact of any paper in a journal is well-estimated by the 'average of paper', that is its journal impact factor which can be obtained from the annual issue of JCR. It further gave a measure of the overall quality of the publications on science for each year by the mean of each set of publications. Thus the impact factors of Citations were verified according to 151databases for the period of 1994-2003. This process enabled identification of highly cited journals, highly cited field and highly cited institutions. The impact analysis is restricted to citations received from 151indexed research papers. The relative citation scores are based on five-year citation windows; self-citations have been excluded. In the National Science Indicator (NSI) database, one of the standard indicators is a 5-year citations indicator using overlapping periods.
The data were analyzed using Microsoft Excel and the SPSS statistical software package. Pearson's correlation coefficient was used to investigate the association among productivity, citation frequency, and impact factor and cited half-life. A one-tailed test t-test was used and it was carried out at the 95% and 99% level of confidence.
3 Findings and discussions
This section reports on most cited authors and works, evaluation of the performance of South African journals and a relative comparison of the research oriented universities in South Africa
3.1 Most cited authors and works
Citation analysis is a widely used tool in academia to assess the impact of scholarly output and trends in scholarship in a particular field by tracking references in the footnotes and bibliography of academic articles. Citation analysis is considered to be more objective than qualitative judgements, which are prone to bias and favouritism. It is therefore widely used to rate academic journals, departments and individual researchers for external assessments, including grant proposals (Fazel
&
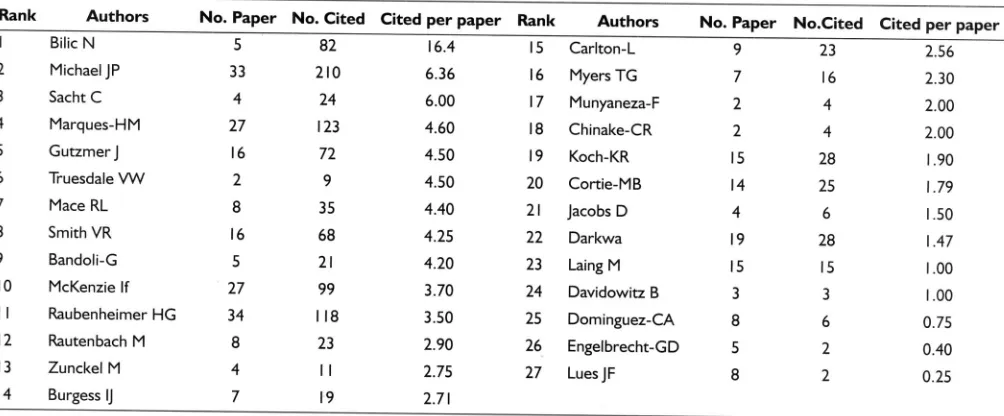
Danesh, 1995).The major area of bibliometric research uses various methods of citation analysis in order to establish relationships between authors and their work. As can be seen in Table I, there were 27 authors during 2000-2003, each with at least 2 papers and 2 citations. Despite the fact that there were many South African scientists who had published during the given period, only those authors who had been cited above the threshold (greater than or equal to 0.25 cited per paper) were selected, 27 authors in all. The total number of papers produced per author during the given period ranged between 2 and 34 respectively. Similarly, the number of citations per paper varied from 2 to 210.
Table I Authors ranked according to citation per paper
Rank Authors No. Paper No. Cited Cited per paper Rank Authors No. Paper No.Cited Cited per paper
I Bilic N 5 82 16.4 15 Carlton-L 9 23 2.56
2 MichaelJP 33 210 6.36 16 Myers TG 7 16 2.30
3 Sacht C 4 24 6.00 17 Munyaneza-F 2 4 2.00
4 Marques-HM 27 123 4.60 18 Chinake-CR 2 4 2.00
5 Gutzmer J 16 72 4.50 19 Koch-KR 15 28 1.90
6 Truesdale VW 2 9 4.50 20 Cortie-MB 14 25 1.79
7 Mace RL 8 35 4.40 21 Jacobs D 4 6 1.50
8 Smith VR 16 68 4.25 22 Darkwa 19 28 1.47
9 Bandoli-G 5 21 4.20 23 Laing M 15 15 1.00
10 McKenzie If 27 99 3.70 24 Davidowitz B 3 3 1.00
II Raubenheimer HG 34 118 3.50 25 Dominguez-CA 8 6 0.75
12 Rautenbach M 8 23 2.90 26 Engelbrecht-GD 5 2 0.40
13 Zunckel M 4
"
2.75 27 LuesJF 8 2 0.2514 Burgess IJ 7 19 2.71
Table I shows the number of papers, citations, and average citations per paper from 1994 to 2003 for the most cited authors. The four leading authors, noted to have produced more than 25 papers during the period of study, in order of ranking, were Raubenheimer HG (34), Michael JP (33), Marques HM (27) and McKenzie IF (27). Analysis of authors' performance from citations received per paper showed that four of the most cited authors represented 40.80% of the total. These were Bilic N (16.40), Michael JP (6.36), Sacht C (6.00), and Marques-HM (4.60): Gutzmer
J,
Truesdale VW and Mace RL, received 4.50, 4.50 and 4.40 citations per paper respectively.From the total number of citations (1076) received, 572 (53.20%) citations were found within Chemistry; 267 (24.80%) in Physics; 72 (7.0%) in Geology and 68 (6.30%) in Plant Science. All other departments account for below 5.00% of citations. Further analysis with regards to authors per department indicated that out of the top 27 authors noted, the majority was found within Chemistry (37.0%), followed by Physics (26%), Medicine (7.40%) and Biology (7.40%). The number of top selected authors from other departments accounted for 3.70% each.
Table 2Distribution of publications according to subject field and institutions, 1994-2003
Field (participation %)
Institution CLNIC PLT&ANM BIO&BICH ENGIN ENV&ECO CHEM PHY Total.
UP 560( 14.55) 1436(37.31 ) 101 (2.62) 441(11.46) 377(9.80) 332(8.63) 602( 15.64) 3849( 19.84)
UCT 1732(33.32) 873( 16.79) 431 (8.30) 671(12.91) 541 (10.41) 411(7.91) 539( I0.37) 5 198(26.80)
NATAL 947(29.98) 714(22.60) 84(2.66) 319(10.10) 275(8.70) 324(10.26) 496( 15.70) 3 159( 16.28)
STELL 970(26.51) 642( 17.55) 161 (4.40) 751 (20.52) 321(8.77) 309(8.44) 505( 13.80) 3659( 18.86)
WITS 1516(42.90) 379(10.72) 158(4.50) 338(9.56) 232(6.56) 360(10.17) 551 (15.60) 3534( 18.22)
Total" 5725(29.51) 4044(20.85) 935(4.82) 2520(13.0) 1746(9.00) 1736(8.94) 2693( 13.88) 19399( I00)
Source: compiled by science citation index .P-value >0.10
•• P-value <0.005
From scientific publications throughout the period studied (1994-2003), the vast majority of South African publications came from the field of Clinical Science (29.51 %). Plant and Animal Science, Physics and Engineering 20.85%, 13.80% and
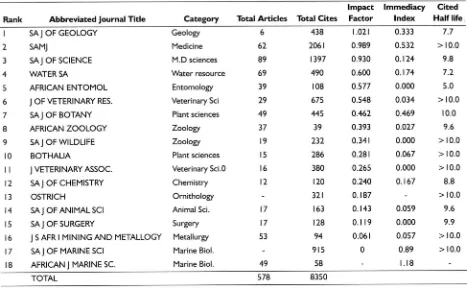
Table 3 indicates the performance of South African journals, according to total number of citations per article and impact
factor. Despite the fact that the SA journal of Geology was ranked first, due to the high impact factor, it was observed that
the South African Medical Journal (SAMJ) had the highest number of citations - 2061 from 62 articles, followed by the
South African journal of science (S AFR J SCI) - I 397 citations from 89 papers.
Table 3 South African journals in JCR: 2003 indicators
Impact Immediacy Cited Rank Abbreviated Journal Title Category Total Articles Total Cites Factor Index Half life,
I SA J OF GEOLOGY Geology 6 438 1.021 0.333 7.7
2 SAMJ Medicine 62 2061 0.989 0.532 > 10.0
3 SAJ OF SCIENCE MD sciences 89 1397 0.930 0.124 9.8
4 WATER SA Water resource 69 490 0.600 0.174 7.2
5 AFRICAN ENTOMOL Entomology 39 108 0.577 0.000 5.0
6 J OF VETERINARY RES. Veterinary Sci 29 675 0.548 0.034 >10.0
7 SAJ OF BOTANY Plant sciences 49 445 0.462 0.469 10.0
8 AFRICAN ZOOLOGY Zoology 37 39 0.393 0.027 9.6
9 SAJ OF WILDLIFE Zoology 19 232 0.341 0.000 > 10.0
10 BOTHALIA Plant sciences 15 286 0.281 0.067 > 10.0
II J VETERINARY ASSOC. Veterinary Sci.O 16 380 0.265 0.000 >10.0
12 SA J OF CHEMISTRY Chemistry 12 120 0.240 0.167 8.8
13 OSTRICH Ornithology 321 0.187 > 10.0
14 SAJ OF ANIMAL SCI Animal Sci. 17 163 0.143 0.059 9.6
15 SAJ OF SURGERY Surgery 17 128 0.119 0.000 9.9
16 J S AFR I MINING AND METALLOGY Metallurgy 53 94 0.061 0.057 > 10.0
17 SAJ OF MARINE SCI Marine BioI. 915 0 0.89 >10.0
18 AFRICAN J MARINE Sc. Marine BioI. 49 58 1.18
TOTAL 578 8350
Distribution of papers by journal impact showed that only one journal, SA J OF GEOLOGY, had an impact factor above
one. Thirty three percent (33.30%) of the journals had an impact factor ranging between 0.5 1.0; 40% between 0.2
-0.5 and 16.70% had an impact factor below 0.2.
Based on the South African journals in the JCR (Table 2), Pearson's correlation coefficient was used to investigate the
association among productivity, citation frequency, and impact factor and cited half-life of South African main journals. A
one-tailed test was used and it was carried out at the 5% and I % levels of significance.
Statistical analysis regarding the association between journal productivity and citation frequency yielded a Pearson's
correlation coefficient of 0.610 with a P-value of 0.0 I 0; analysis of the citation frequency and impact factor revealed a
correlation coefficient of 0.768 with a P-value of 0.00 I; analysis of citation frequency and immediacy index revealed a
correlation coefficient of 0.596 with a P-value of 0.0 12 and analysis of impact factor and immediacy index showed a
correlation coefficient 0.636 with a P-value of 0.007.
These results indicate that for South African journals, with 95% confidence interval (P-value
<
0.05), there is asignificant correlation between journal productivity and citation frequency, and between citation frequency and
immediacy index.
Table 4Pearson'scorrelation coefficient matrix (journal variables)
Correlations matrix Total no. Articles Total no. Cites Impact Factor Immediacy Index Cited Half-life
Total Articles Total Cites
1.000
0.610* 1.000
Impact Factor 0.435 0.768**
Immediacy Index 0.319 0.596*
Cited Half-life -0.012 0.1 14
*
Correlation is significant at the p-value< 0.05 level (I-tailed)**
Correlation is significant at the p-value< 0.01 level (I-tailed)SAJnl Libs&Info Sci2006, 72( I)
1.000 0.636**
-0.349
1.000
Further analysis of the results showed that there is no significant correlation at 95% confidence interval between citation frequency and cited half-life (p-value 0.349), between impact factor and cited half-life (p-value 0.1 I I) or between
immediacy index and cited half-life (p-value 0.241). It was also demonstrated that the correlation between journal productivity and cited half-life was not significant at 95 % confidence interval. This suggests that more productive journals usually publish papers of a higher quality in terms of citation frequency and impact factor.
3.3 A relative comparison of the research- oriented universities of South Africa
The trend analysis in Figure I depicted that the relative citation impact of both the University of Pretoria (UP) and University of the Witwatersrand (WITS) suffered negative growth during the 9-year period. UP demonstrated further periods of decline. The relative citations' share for UP fell from 1.93 in 1994 -1999 to less than 80% in 1999-2003 (0.37),
while the relative citations' share for WITS decreased by 49% during the same period, from 1.42 in 1994-1998 to 0.73 in 1998-2002, and then started to increase by 16% in 1999-2003. There was not much fluctuation in the percentage share
in the relative citation impact of the University of Cape Town (UCT). The University of Stellenbosch (STELL) was noted to have had the highest percentage increase during this period (180%), followed by the University of Natal (UN) with an
increase of 22%. Both universities (STELL and UN) showed a continuous increase in the relative citation impact from 1994 to 2003.
2.5
-
(,)2.0
III
C-.5
t:
.2
1.5
~
~
(,)Q)
1.0
• =-:..:::::::::-
•
••
.~
<-~
.I~
&.
0.5
3/
8
~
~
~
~
8{
g;
,....
,....
I-+-
LP
-II-NA.T,AL
Figure 1 Relative citations for South Africa's most productive university (1994-2003)
4 Conclusion
Given the fact that citation indicator is calculated as the average citation rate of all articles in a given field, in this paper comparison has been made among the top South African authors, major South African journals and among most productive institutions. The performance of South African scientists were measured using cited per paper perspectives.
The result showed that the four top ranked authors representing 40.80% of the total count are: Bilic N (16.40), Michael JP (6.36), Sacht C (6.00), and marques-HM (4.60). From the total 1076 citations counted, it was found that 572 or
53.20% citations belong to Chemistry, 267 or 24.80% belong to Physics, and 72 or &.00% belong to Geology.
of Geology (SA J OF GEOLOGY), had impact factor above one. Of the remaining journals, 30% have an impact factor ranging between 0.5 - 1.0 and 40% between 0.2 - 0.5 These results are not satisfactory, as more than 40% of all the journals in the JCR have an impact factor greater than one (Pouris 2004), indicating that international journals have a higher impact factor. The association between productivity and citation frequency, and between citation frequency and immediacy index have been proved to be positive using the appropriate statistical Pearson's correlation coefficient at the p-value <0.05. In other words, journals with high productivity receive more citations and more cited journals attain high immediacy index.
The activity of institutions against their relative citation impact for the time period 1994- 2003, point out that STELL
and Natal marked the highest percentage increase by 180% and 22% respectively. The most plausible reason that
citation impact was higher in STELL than that of UP might be that the authors from STELL collaborated more
internationally than did the authors from other South African universities. This caused the papers to be cited higher than those papers for which their authors collaborated nationally. Both the university of Pretoria (UP) and University of
Witwatersrand (WITS) suffered from negative growth during the same 9-year period. The percentage increase or
decrease of university of Cape Town's (UCT) relative citation impact activity was not as conspicuous. However, individual university still shows strengths in various specific fields.
References
Christine, L. Borgman & Jonathan, F. (2002). Scholarly communication and Bibiliometrics. Annual review
of
Information Science and Technology, 36: 1-2.Egge, L., Rousseau, R & Van Hoydoonk, G. (2000). Methods for accrediting publications to authors or countries: Consequences for evaluation studies. Journal
of
the American Society for Information Science,S I, 145-1 57.Fazel, S., & Danesh, j. (1995). Bah'a'i scholarship: an examination by citation analysis,Bah'a'i studies Review, 5( I), 13-26. Moed, H., Burger, W., Frankfort, j. & Van Raan, A (1985). The use of bibliometrics data for the Measurement of university
research performance. Research Policy, 14, I3 I-149.
Osareh F., (1996). Bibliometrics, citation analysis and co-citation analysis: areview
of
literature I. Libra, 46, (4): 148-158. Pouris, A. (2004). An assessment of the impact and visibility of South Africa journals. Scientmetrics,62, (2): 213-222.Roche,T.& Smith,D.( 1978).Frequency of Citations as Criterion for the Rankings of Departments, journals, and Individuals.
Sociological Inquiry, 48, (I): 49-57.
Sen, Subir K. & Chatterjee, Sunil jumar. (1990). An introduction to researches in bibliometrics Part I.laslic Bulletin, 35 (3) 1990. Wilson, C S & Pittman, S. (2000). Assessments of Outputs: Quantity and quality of cancer research publications in New South Wales from 1994 to 1998. Sydney: The University of New South Wales, School of Information Systems, Technology and management