Driver's Good Postures Correction Model while
Driving for Smart Vehicle Seat using Multinomial
Logistic Regression
Heum park#1, Changbum Lee*2#College of Engineering, Youngsan University Yangsan-si Gyeongnam-do 626-790, R.O.Korea
1hmpark@ysu.ac.kr
*Department of Electrical and Electronic Engineering, Youngsan University Yangsan-si Gyeongnam-do 626-790, R.O.Korea
2cblee@ysu.ac.kr
Abstract— This paper presents a driver's good postures
correction model while driving for smart vehicle seat using multinomial logistic regression. The good driver’s seating postures are considered the angles for the placement of human body, the space for foot controls in vehicles, and the ranges of adjustments of the driver's seat and steering wheel. According to them, for the good postures, it has adjusted seat height, seat angle, head height, back of knees, distances of foot pedals, tilt of seat, etc. for each driver. There have been some studies on analysis for comfort vehicle driver’s seat, analysis of interface pressure of drivers, correction of good posture, effects of driving environment on the posture, and sitting strategies with seating pressure distribution. However, there are a few studies on correction model for driver’s good postures while driving using machine learning. Therefore, we suggest 1) a driver's good postures while driving in vehicle and 2) a good postures correction model for them using multinomial logistic regression. We developed the system with the Arduino board and C-type piezoelectric effect elements to get driver’s postures while driving. For the experiments using the logistic regression models, first, we collected the piezoelectric values from 55 drivers and 17 types of cars from the system, second, defined the 6 types of good postures with thresholds, and third, analyzed the postures from test data using multinomial logistic regression for the types using them. As the results, it can apply with a smart vehicle seat system and can guide the good postures correction for the bad postures while driving in real-time.
Index Term— Correction of Driver’s Posture, Machine Learning, Smart Vehicle Seat, Multinomial Logistic Regression, Driver’s Good Posture
I. INTRODUCTION
The automotive industry strongly encourages research in the field of objective comfort assessment for the seat and driver posture in the vehicle design process. There are methodologies for the prediction of the driver’s comfort, sense of well-being with health and safety, biomechanical factors involving muscular and skeletal systems to prevent a lot of painful disorders such as low back pain, from bad sitting postures and negative factors for the comfort [1]. There are choices for automobile depended on a variety of factors, such as the vehicle type, brand, trend, security, its performance, interior space, interior design, navigation,
additional equipment offered, etc. The seat comfort is a very important issue for the drivers. Long-time driving usually results in manifestation of low back pain or other musculoskeletal disorders, caused by the discomfort of the seats. Accordingly, the expectations of customers regarding the seat comfort are continuously increasing, and the manufacturers of seats for passenger automobiles have to respond to market requirements and offer seats with higher quality and comfort [2].
Most cars are not designed for correct sitting posture, however many now offer a vast array of adjustments to both the seat and steering column, allowing for a better overall driving position. To find the ideal position we should start with the seat in the wrong position and then adjust it from there, and need to adjust seat height, seat position, tilt of seat, inclination of the seat back, position of lumbar support, supporting of thoracic spine, adjusting the mirrors, etc. for suitable size and position in a car. For good driving postures, firstly, push the seat all the way back, then lower it as far as possible. Next, recline the back of the seat to about 30-40 degrees and move the steering wheel (if it adjusts) all the way up and in towards the dashboard, and so on [3].
For commercial drivers, if they drive long distances every day, specifically involves long hours of driving, they may have experienced back pain. Approximately 30-60% of drivers report back pain that is caused or made worse by driving. Driving also involves the use of their feet to control the car’s pedals which means they are not used to help stabilize and support their lower body as they normally would when sitting. A combination of these factors as well as the inadequate design of some vehicle seats can cause back problems for some [4]. The good driver’s seating postures have been considered the angles for the placement of human body, the space for foot controls in vehicles, and the ranges of adjustments of the driver's seat and steering wheel on the various studies.
thoracic spine, adjusting the mirrors, etc. for suitable size and position in a car [1], the analysis of vehicle driver’s seat through simulation of the sitting process for comfort driving [2], a novel system which applies convolutional neural network (CNN) to automatically learn and predict pre-defined driving postures, the main idea is to monitor driver hand position with discriminative information extracted to predict safe/unsafe driving posture [5],
estimation of driver’s standard postures by a multivariate analysis method that understand the driver's posture and to apply the human shape data to vehicle design with human body characteristics of drivers and passengers and the anthropometric data on driver's posture [6], classification of sitting strategies based on seating pressure distribution by cluster analysis for mid-back and scapular, mid-back and lumbar, and lumbar sitting strategies, hip concentrated, hip and mid-thigh concentrated, and hip and mid-thigh distributed sitting strategies [7], effects of driving environment on driver’s posture to develop a driver’s posture measurement system during driving and investigate casual changes due to duration, car type, traffic flow [8], effects of seating position of short stature drivers in frontal impacts with two methods; accident analysis and a survey of drivers’ seating positions [9], for the studies of driver’s postures and pain, the association between risk factors and low back pain among commercial vehicle drivers [10], and so on.
There have been a lot of studies for applications based on logistic regression. Logistic regression is used in various fields, most medical fields, and social sciences, for logistic regression analysis and reporting what to expect in an article using logistic regression techniques: logistic regression models, logistic regression analysis and reporting, evaluations using logistic regressions, etc. [11]. There have been some studies for drivers using logistic regression, a binary logistic regression model of the driver avoidance manoeuvers in two passenger vehicle crashes [12], a model for traffic accidents prediction based on driver personality traits assessment [13], effect of driver, roadway, collision, and vehicle characteristics on crash severity: a conditional logistic regression approach [14], multinomial logistic regression model for predicting driver’s drowsiness using only behavioural measures [15], assessment of drowsy drivers by fuzzy logic approach based on multinomial logistic regression analysis [16], and so on.
However, there are a few studies on correction of driver’s postures while driving for problem of the postures using machine learning algorithm. Therefore, in the paper, we suggest 1) a driver's good postures while driving in vehicle and 2) a good postures correction model using multinomial logistic regression while driving. In Section 2, we discuss the driver's good postures while driving in vehicle, and in Section 3, good postures correction model using multinomial logistic regression for smart vehicle seat. In Section 4, experiments and the results, and in Section 5, we draw conclusions and discussions.
II. DRIVER’S GOOD POSTURE WHILE DRIVING IN VEHICLE
A. Driver’s Good Postures in Vehicle
Most cars are not designed for correct sitting posture, however many now offer a vast array of adjustments to both the seat and steering column, allowing for a better overall driving position. For the ideal position, drivers should start with the seat in the wrong position and then adjust it from there. Firstly, push the seat all the way back, then lower it as far as possible. Next, recline the back of the seat to about 30-40 degrees and move the steering wheel (if it adjusts). For seat height, the drivers adjust the seat height up until the hips are at least as high as the knees, and make sure they can still see the road and the instruments. Make sure the backs of the knees do not touch the car seat bottom, as this is bad for knees and circulation [3].
There should be at least a two finger gap between the back of the knee and the seat. For the seat position, the drivers adjust the seat forwards so they can reach and completely depress all the foot pedals without their back moving away from the back of the seat. Make sure they have a small bend in the knees of at least 20-30 degrees having the knees too straight can cause knee pain. For tilt of the seat, the car seats are stopped the driver from slipping under the seat belt, and the backwards angle has actually been shown to decrease the hip angle and increase the pressure on your lower back/spine, and raise the inclination of the seat back to an angle of 100-110 degrees and the angle decreases the pressure on the discs in the drivers low back [3]. Fig. 1 shows driver’s bad and good postures, and seat height.
Fig. 1 Bad and Good Postures of Drivers and Seat Height
(a) Back of Knees and Car Seat Bottom (b) Seat Position with Foot Pedals
(c) Tilt of Seat with Heap and Lower Back
Fig. 2 shows back of knees and car seat bottom, seat position with foot pedals, and tilt of seat with heap and lower back. The supports are often both height and depth adjustable, to adjust the depth of the lumbar support by moving it from flat until it comfortably fills the arch of the back. For supporting the thoracic spine, the back of the car seat should reach the height of the shoulders. To adjust front-to-back, sit with the head in a neutral position, align the earlobe between the collar bone and neck muscles. Fig. 3 shows lumbar support and height of headrest for driver’s postures [3].
(a) Lumbar Support for Good Posture
(b) Height and Front-to Back of Headrest Forward
Fig. 3 Lumbar Support and Height of Headrest for Driver's Posture
B. Driver’s Good Postures while Driving
In the present study, we considered preconditions of the complete driver’s seat in vehicle for distances a steering wheel and pedals, seat height, backs of your knees, seat position, tilt of the seat, and inclination of the seat back to an angle of 100-110 degrees, it makes be comfortable to the drivers. Thus, the drivers have sets of the comfortable seat for their body and conditions with the preconditions in the experiments. The good postures should be:
Reclined the back of the seat and the heap as closely as possible.
Adjusted comfortable interval between a steering wheel and pedals.
Adjusted the incline the back seat
Adjusted the position of the headrest and the head. However most drivers cannot get the good postures while driving, because cannot get the information that bent their back, bad hip joint, biased body to left (or right), angle of the back of the seat, recline the armrest to left (or right), unbalanced legs, long time driving, etc. Most bad driver’s postures while driving is caused by those reasons, not status of seat positions in vehicle. Thus, we defined 6 types’ good postures for drivers with the pressure of the back of seat and the bottom of seat with thresholds:
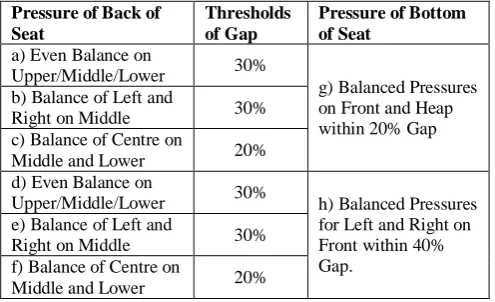
a) Even balance of back pressure on the upper, the middle and the lower of the back seat within threshold 30%, and balanced bottom pressure for the front and the heap within 20% gap.
b) Balance of back pressure for the left and the right on the middle of the back seat within threshold 30%, and balanced bottom pressure for the front and the heap within 20% gap.
c) Balance of back pressure for the centre on the middle and the lower of the back seat within threshold 20%, and balanced bottom pressure for the front and the heap within 20% gap.
d) Even balance of back pressure for the upper, the middle and the lower of the back seat within threshold 30%, and balanced bottom pressure for the left and the right on the front within 40% gap.
e) Balance of back pressure for the left and the right on the middle of the back seat within threshold 30%, and balanced bottom pressure for the left and the right on the front within 40% gap.
f) Balance of back pressure for the centre on the middle and the lower of the back seat within threshold 20%, and balanced bottom pressure for the left and the right for the front within 40% gap. Table 1 shows 6 types of good postures for drivers and thresholds for the back of seat and the bottom of seat. The thresholds of pressures are the values of gaps among the upper, the middle and the lower, or the front and the heap, or the left, the centre and the right.
TABLE I
6 TYPE OF GOOD POSTURES FOR DRIVERS WHILE DRIVING
Pressure of Back of Seat
Thresholds of Gap
Pressure of Bottom of Seat
a) Even Balance on
Upper/Middle/Lower 30%
g) Balanced Pressures on Front and Heap within 20% Gap b) Balance of Left and
Right on Middle 30%
c) Balance of Centre on
Middle and Lower 20% d) Even Balance on
Upper/Middle/Lower 30% h) Balanced Pressures for Left and Right on Front within 40% Gap.
e) Balance of Left and
Right on Middle 30%
f) Balance of Centre on
Middle and Lower 20%
(a) (c)
(d)
(b)
(e) (f)
Upper
Middle
Lower
Heap
Front
Left Centre Right
Within 20% Gap
Left Right Within 40% Gap
Fig. 4 6 Types of Driver's Good Postures while Driving
III.GOOD POSTURES CORRECTION MODEL USING MULTINOMINAL LOGISTIC REGRESSION
A. Logistic Regression Model
Logistic regression is estimating the parameters of a logistic model. The two possible dependent variable values are often labelled as "0" and "1", which represent outcomes such as pass/fail. The binary logistic regression model can be generalized to more than two levels of the dependent variable: categorical outputs with more than two values are modelled by multinomial logistic regression. Logistic regression competes with discriminant analysis as a method for analyzing categorical-response variables. The name multinomial logistic regression is usually reserved for the case when the dependent variable has three or more unique values, such as Married, Single, Divorced, or Widowed. Although the type of data used for the dependent variable is different from that of multiple regressions, the practical use of the procedure is similar [17].
In logistic regression, a mathematical model of a set of explanatory variables is used to predict a logit transformation of the dependent variable. Suppose the numerical values of 0 and 1 are assigned to the two outcomes of a binary variable. Often, the 0 represents a negative response and the 1 represents a positive response. The mean of this variable will be the proportion of positive responses. If p is the proportion of observations with an outcome of 1, then 1-p is the probability of an outcome of 0. The ratio p/(1-p) is called the odds and the logit is the logarithm of the odds, or just log odds. Mathematically, the logit transformation is written, logit(p)=log(p/1-p). The
logistic transformation is the inverse of the logit transformation, as p=logistic(x)=ex/(1+ex).
And a categorical dependent variable Y having G (G = 2) unique values is regressed on a set of p independent variables X1, X2,..., Xp. For example, Y may be presence or absence of a disease, condition after surgery, or marital status. Since the names of these partitions are arbitrary, we often refer to them by consecutive numbers. The Y will take on the values 1, 2, …, G. Let X=(X1, X2,..., Xp). The logistic regression model is given by the G equations: ln[Pg/P1]=[Pg/P1]+βg1X1, βg2X2,…, βgpXp=ln[Pg/P1]+XBg. Here, Pg is the probability that an individual with values X1,
X2,..., Xp is in outcome g.
That is, Pg=Pr(Y=g|X). Usually X1 ≡ 1 (that is, an intercept is included), but this is not necessary. The quantities P1, P2, ..., PG represent the prior probabilities of outcome membership. If these prior probabilities are assumed equal, then the term ln(Pg / P1) becomes zero and drops out. If the priors are not assumed equal, they change the values of the intercepts in the logistic regression equation. Outcome one is called the reference value. The regression coefficients β11, β12,…, β1p for the reference value are set to zero. The choice of the reference value is arbitrary. Usually, it is the most frequent value or a control outcome to which the other outcomes are to be compared. This leaves G-1 logistic regression equations in the logistic model. The β’s are population regression coefficients that are to be estimated from the data. Their estimates are represented by b’s. The β’s represents unknown parameters to be estimated, while the b’s are their estimates. These equations are linear in the logits of p. However, in terms of the probabilities, they are nonlinear. The corresponding nonlinear equations are Pg=Prob(Y=g|X)
=eXBg/(1+eXB2+eXB3+…+eXBG), since eXBg=1 because all of its regression coefficients are zero.
The interpretation of the estimated regression coefficients is not as easy as in multiple regressions. In logistic regression, not only is the relationship between X and Y nonlinear, but also, if the dependent variable has more than two unique values, there are several regression equations. Consider the usual case of a binary dependent variable, Y, and a single independent variable, X. Assume that Y is coded so it takes on the values 0 and 1. In this case, the logistic regression equation is ln(p/(1-p))= β0+β1X, β1=β0+(X+1)-(β0+β1X)=ln[odds’/odds]. That is,
β1 is the log of the ratio of the odds at X+1 and X, eβ1 =
[odds(X=1)/odds(X=0)] for binary X.
With multiple independent variables and multinomial dependent variable, consider the following example in which there are two independent variables, X1 and X2, and the dependent variable has three groups: A, B, and C. The three indicator variables: GA, GB, and GC. They are set to one or zero depending on whether Y takes on the corresponding value. Two regression equations will be generated corresponding to any two of these indicator variables. The value that is not used is called the reference value. Suppose the reference value is C. The two regression equations would be ln(pA/pB) =
give the change in the log odds of A versus C and B versus C for a one unit change in X1, respectively [17].
B. Good Postures Correction using Binomial Logistic Regression
In statistics, multinomial logistic regression is a classification method that generalizes logistic regression to multiclass problems, i.e. with more than two possible discrete outcomes. That is, it is a model that is used to predict the probabilities of the different possible outcomes of a categorically distributed dependent variable, given a set of independent variables. To determine the good postures with logistic regression, we adopted the expression, Y= β0+β1X1+β2X2+…+βMXM to predict good or not for driver’s postures, where Y is a dependent variable (good or not), Xi independent variables for the pressures of back seat (left, centre and right on upper, middle, lower) and bottom seat (left and right on front and heap), and M is the number of independent variables and β0, β1,…, βM are regression coefficients.
For binary logistic regression, the results are good posture or not from data. We defined 6 types of good postures for the back seat and the bottom seat, as shown Table 1. It is determined by the pressures values of the back of seat and the bottom of seat with thresholds. For determination of good (or not) postures, the dependent variable has 1 or 0, the independent variables are pressure values of back of seat (left, centre and right on upper, middle, lower) or pressure values of bottom of seat (left and right on front and heap). For binary logistic regression, the results are good posture or not from data. There are 5 cases for the back seat and the bottom seat among 6 types as shown Table 1, as follows:
If balance of back pressure on the upper, the middle and the lower of seat (average of left, centre and right) is within threshold (30% gap), the result is good posture and the other is not, the type a) of Table 1.
If balance of back pressure for the left and the right on the middle of seat is within threshold (30% gap), the result is good posture and the other is not, the type b) of Table 1.
If balance of back pressure for the center on the middle and the lower of seat is within threshold (20% gap), the result is good posture and the other is not, the type c) of Table 1.
If balance of the front and the heap (average of left and right) for pressures within 20%, the result is good posture and the other is not, the type g) of Table 1.
If balance of the left and the right on the front for pressures are within 40%, the result is good posture and the other is not, the type h) of Table 1.
C. Good Postures Correction using Multinomial Logistic Regression
For multinomial logistic regression, with 6 types of good postures model and 16 pressures points of seat, the expression is Yi= β0i+β1iX1i+β2iX2i+…+βMiXMi, where Yi is a dependent variable (good or not), Xi independent
variables for the pressures of back seat (left, centre and right on upper, middle, lower) and bottom seat (left and right on front and heap), and Mi is the number of independent variables for i-th of Y and β0i, β1i,…, βMi are regression coefficients. For determination of good (or not) postures, the dependent variables have 4 kinds of results:
1) Good for back seat 2) Good for bottom seat
3) Good for back seat and bottom seat 4) Not good for all.
The independent variables are the pressure values of back of seat (left, centre and right on upper, middle, lower), and the pressure values of bottom of seat (left and right on front and heap). For multinomial logistic regression, there are 11 cases for the back seat, the bottom seat and the combined of them. The 5 cases for the back and the bottom seats with 4 kinds of results 1) ~ 4) are as follows:
If balance of back pressure on the upper, the middle and the lower of seat is within threshold (30% gap), and the result is 1) good posture for back and the other is 4), a) of Table 1.
If balance of back pressure for the left and the right on the middle of seat is within threshold (30% gap), the result is 1) good posture for back and the other is 4), b) of Table 1.
If balance of back pressure for the center on the middle and the lower of seat is within threshold (20% gap), the result is 1) good posture for back and the other is 4), c) of Table 1.
If balance of the front and the heap for pressures within 20%, the result is 2) good posture for bottom and the other is 4), g) of Table 1.
If balance of the left, the centre, and the right on the front for pressures are within 40%, the result is 2) good posture for bottom and the other is 4), h) of Table 1.
Table 2 shows 5 cases and 3 results for the back and the bottom seat.
TABLE II
5 CASES FOR BACK AND BOTTOM SEAT WITH 3 RESULTS
5 Cases for Back and Bottom Results
(a) Back pressure on upper, middle and lower of seat
1) Good for back seat 4) Not good for all (b) Back pressure for left and right on
middle of seat
(c) Back pressure for center on middle and lower of seat
(d) Pressures between front and heap
2) Good for bottom seat 4) Not good for all (e) Pressures between left and right
on front
With combination of the cases for the back and the bottom seat, there are 6 cases with 4 kinds of results 1) ~ 4) are as follows:
If balance of back pressure for the left and the right on the middle of seat is within threshold (30% gap), and if balance of the front and the heap for pressures within 20%, the result is 3) good posture for back and bottom, and the other is 4), types b) and g) of Table 1.
If balance of back pressure for the center on the middle and the lower of seat is within threshold (20% gap), and if balance of the front and the heap for pressures within 20%, the result is 3) good posture for back and bottom, and the other is 4), types c) and g) of Table 1.
If balance of back pressure on the upper, the middle and the lower of seat is within threshold (30% gap), and if balance of the left and the right on the front and the heap for pressures within 40%, the result is 3) good posture for back and bottom, and the other is 4), types d) and h) of Table 1.
If balance of back pressure for the left and the right on the middle of seat is within threshold (30% gap), and if balance of the left and the right on the front and the heap for pressures within 40%, the result is 3) good posture for back and bottom, and the other is 4), types e) and h) of Table 1.
If balance of back pressure for the center on the middle and the lower of seat is within threshold (20% gap), and if balance of the left and the right on the front and the heap for pressures within 40%, the result is 3) good posture for back and bottom, and the other is 4), type f) and h) of Table 1.
TABLE III
6 CASES FOR BACK AND BOTTOM SEAT WITH 4 RESULTS
6 Cases for Back and Bottom Results
(a) Pressure on upper, middle and lower, and balance of front and heap
1) Good for back seat
2) Good for bottom seat
3) Good for back seat and bottom seat 4) Not good for all (b) Pressure for left and right on
middle, and balance of front and heap (c) Pressure for center on middle and lower, and balance of front and heap (d) Pressure on upper, middle, lower, front and heap
(e) Pressure for left and right on middle, and front and heap
(f) Pressure for center on middle and lower, and front and heap
TABLE IV
16 INDEPENDENT AND 4 DEPENDENT VALUES FOR BACK AND BOTTOM
Independent Values Dependent Values
Top: X1 , Upper: Left (X2) Right (X3)
Good for back or/and bottom Not good for all Middle1: Left(X4)Centre (X5) Right (X6)
Middle2: Left(X7)Centre (X8) Right (X9) Lower: Left(X10)Centre(X11) Right (X12) Heap: Left (X13) Right (X14)
Front: Left (X15) Right (X16)
Table 3 shows 6 cases and 4 results for the back and the bottom seat. If balance of back pressure for the center on the middle and the lower of seat is within threshold (20%
gap), and if the balance of the left and the right on the front for pressures are within 40%, the result is 3) good posture for back and bottom, and the other is 4), for the type (f) and (h). Table 4 shows 16 independent values from the back and the bottom seat, and 4 dependent values (4 results).
IV.EXPERIMENTS AND RESULTS
In the present study, we considered the preconditions of the complete driver’s seat in vehicle for distances a steering wheel and pedals, seat height, backs of your knees, seat position, tilt of the seat, and inclination of the seat back to an angle of 100~110 degrees, it makes be comfortable to the drivers. Thus, the drivers have sets of the comfortable seat for their body and conditions in the experiments, 1) recline the back of the seat and the heap as closely as possible, 2) adjust comfortable interval between a steering wheel and pedals, 3) adjust the incline the back seat, and 4) adjust the position headrest and head. Most drivers cannot get the good postures while driving, because be bent their back, bad hip joint, biased body to left (or right), angle of the back of the seat, recline the armrest to left (or right), unbalanced legs, long time driving, etc., regardless the status of seat positions for drivers.
We developed the system to get driver’s postures with the piezoelectric values using 16 C-type piezoelectric effect elements on the surface of back of a seat (10 elements) and bottom of seat (4 elements), be interfaced with an Arduino Mega-2560 board. Fig. 5 shows the system to collect driver’s postures with 16 piezoelectric effect elements, having 2 sensors on the upper seat back, 3 for the middle, 3 for the lower, 1 for the top, and 4 on the bottom seat, and an application program. The specification of the elements is C-type piezoelectric effect element, 27mm ceramic material, electricity 0~0.1mA, and DC output 1~1.5V. It can get the values of output voltage for degree of intensity between body and sensors. We could get the data from the experimental participants on the 4~5km uphill and downhill roads.
System for Collecting Piezoelectric Values
Arduino Mega2560
Board I/F
Board
Piezoelectric Sensors
Connected Car PC
TABLE V
INFORMATION OF DRIVERS FOR EXPERIMENTS
Information of Drivers
Age 20s 30s 40s 50s 60s
19 8 10 13 5
Height (cm)
160~169 170~179 180~189 190~200
17 19 18 1
Weight (kg)
60~69 70~79 80~89 90~110
10 31 11 3
Sex Male Female
46 9
Using the system we collected driver’s postures while driving from 55 drivers and 17 types of cars (28 vehicles), and defined 3 types of good postures for back seat, 2 types for bottom seat and 6 combination types of them. And we analyzed the data for thresholds with binominal logistic regression and multinominal logistic regression from the data. Table 5 shows the information of drivers for the experiments.
Table 6 shows the rates of the average (left, centre, right) for piezoelectric values (samples) on the upper, the middle of back and the rates of the average (left, right) on front and heap of the bottom of the seats for 30 drivers through the system. With them, we defined 11 types of good postures for back seat and bottom seat, and analyzed the data for thresholds with binominal logistic regression and multinominal logistic regression for the drivers while driving. The dependent values are 1) Good for back seat, 2) Good for bottom seat, 3) Good for back seat and bottom seat, and 4) Not good for all. The independent values are upper, middle and lower of the back, and front and heap of bottom, as shown Table 6.
TABLE VI
RATES OF PIEZOELECTRIC VALUES AMONG UPPER, MIDDLE OF BACK AND BOTTOM SEAT FOR 30 DRIVERS (SAMPLES)
Upper Middle Lower Upper Middle Lower 15.9% 34.1% 9.0% 17.0% 20.8% 9.5% 13.5% 11.1% 5.8% 1.5% 25.4% 4.9% 0.0% 1.5% 0.0% 52.8% 30.2% 38.3% 35.6% 50.8% 28.4% 25.5% 50.1% 30.1% 39.5% 19.8% 30.1% 33.2% 28.8% 39.3% 22.9% 24.5% 51.9% 40.2% 24.8% 61.7% 60.8% 23.0% 63.9% 59.0% 49.3% 64.8% 66.7% 28.8% 39.3% 1.7% 0.0% 53.0% 42.9% 15.0% 1.0% 5.8% 29.6% 46.9% 53.3% 44.5% 57.8% 16.1% 3.5% 46.4% 62.0% 61.0% 13.3% 27.8% 50.2% 80.6% 57.2% 4.4% 17.0% 19.3% 10.8% 29.4% 47.9% 34.4% 5.0% 62.0% 61.0% 13.3% 27.8% 50.2% 80.6% 57.2% 4.4% 34.5% 27.3% 44.7% 12.0% 36.0% 61.8% 48.6% Front Heap Front Heap Front Heap
43.5 35.6 38.9 54.8 89.7 67.5 54.4 56.5 64.4 61.1 45.2 10.3 32.5 45.6 78.5 24.5 64.1 44.8 65.7 88.2 24.7 21.5 75.5 35.9 55.2 34.3 11.8 75.3 38.4 64.5 51.3 72.5 45.1 36.9 48.9 61.6 35.5 48.7 27.5 54.9 63.1 51.1
As experimental results, there are 11 cases of the back seat, the bottom seat and the combined them. From the data, we can get the results of the drivers while driving and can recommend the corrected driving postures in real time. We applied the binominal logistic regression and the multinomial logistic regression to the experiments, tested the data that can be within the thresholds (gap) for each type of the good postures using logistic regression algorithm. We tested the data from the experimental participators. From the 55 drivers’ data, we analysed the data and could recommend the corrected postures by the results that are good or not by binominal logistic regression. And for multinominal logistic regression, the results are 1) good for back, 2) good for bottom, 3) good for back and bottom, and 4) not good for all, and we could recommend the corrected postures. As experimental results, we can analyze driver’s posture and guide correction of bad postures while driving in real time with the thresholds. Table 7 shows the ratios of good postures and the results for 11 types from the dataset. We can get the results from the experiments as shown Table 7. For the back of seat, a) even balance on the upper, the middle and the lower has ratio 13.5%, b) balance of left and right on the middle has ratio 21.6%, c) balance of center on the middle and the lower has ratio 21.6%. For the bottom of seat, d) balance of front and heap within 20% has ratio 41.2%, e) balance left and right on front within 40% has ratio 32.2%. With combinations of the back of seat (3 types) and the bottom of seat (2 types), we had 11.2%, 15.4%, 13.1%, 12.5%, 15.8% and 17.9%, respectively, with the good results 1), 2) and 3).
TABLE VII
RATIOS AND RESULTS OF GOOD POSTURES FOR 11 TYPES FROM EXPERIMENTAL DATASET
Seat Types
Balances of Pressure of Seat Good Results Good Ratios Back of Seat
Even Balance on Upper/ Middle/Lower
1)
13.5%
Balance of Left and Right
on Middle 21.6%
Balance of Center on
Middle/Lower 21.6%
Bottom of Seat
Balance of Front and Back within 20%
2)
41.2%
Balance of Left and Right
on Front within 40% 32.2%
Combine Back and Bottom (Front and Heap)
Even Balance on Upper/Mi ddle/Lower and Front/Heap
1) 2) 3) 4)
11.2%
Balance of Left and Right
on Middle and Front/Heap 15.4% Balance of Center on Mid
dle/Lower and Front/Heap 13.1%
Combine Back and Bottom (Left and Right on Front)
Even Balance on Upper/Mi
ddle/Lower and Front 12.5%
Balance of Left and Right
on Middle and Front 15.8%
Balance of Center on
Fig. 6 shows not good postures, as the (a)~(d), for the good postures a) and g), b) and g), c) and h), a) and h) of Table 1. Fig. 6 (a) shows the values of the lower are higher than the middle and the upper of the back seat, and the values of the front are higher than the heap of the bottom seat. Fig. 6 (b) shows the values of the left are higher than the centre and the right on the middle of the back seat, and the values of the rights on the front/heap are higher than the right of them of the bottom seat. Fig. 6 (c) shows the values of the centre of the lower than the centre of the middle of the back seat, and the values of the left on the front are higher than the left of the bottom seat. It needs the information for a guide of correction of driver’s posture. Fig. 6 (d) shows the values of the right are higher than the centre/left on the middle/lower, and the values of the left on the front are higher than the left of the bottom seat. It needs the information for a guide of correction of driver’s posture. Fig. 6 (e) shows the values of the right of the upper/middle are higher than the centre/left of them, and the values of the right on the front are higher than the left of the bottom seat. It needs the information for a guide of correction of driver’s posture.
Fig. 7 shows the guide and correction for the deviant postures from the thresholds for each good posture from the (a)~(f). Fig. 7 (a) shows recommend that stand the backbone and balance the hip for the postures (a) of Fig. 6. Fig. 7 (b) shows recommend that stand balance of the backbone and balance the hip to the left for the postures (b) of Fig. 6. Fig. 7 (c) shows recommend that stand the backbone to up and balance the hip to right for the postures (c) of Fig. 6. Fig. 7 (d) shows recommend that stand the backbone to left and balance the hip to right for the postures (d) of Fig. 6, and so on.
(a) (b) (c) (d) (e)
Fig. 6. Not Good of Postures a) and g), b) and g), c) and h), b) and h), a) and h)
(a) (b) (c) (d) (e)
Fig. 7 Guides for postures of 5 Bad Postures
V. CONCLUSIONS
We suggested a driver's good postures model while driving in vehicle and good postures correction model using multinomial logistic regression. First, we developed the system to get driver’s postures with the piezoelectric values using 16 C-type piezoelectric effect elements on the surface of back of a seat (10 elements) and bottom of seat (4 elements), be interfaced with an Arduino Mega-2560 board. Second, we collected the data from 55 drivers and 17 types of cars (28 vehicles) from the system. Third, we defined 5 types of good postures for binomial logistic regression from the data of the back seat and the bottom seat, and 11 types of good postures combined with the data of the back seat and the bottom seat. And fourth, we analyzed the postures from test data using binomial logistic regression with the 5 types of good postures and multinomial logistic regression for the 11 combined types. As experimental results, we can get the 4 kinds of categories through multinomial logistic regression, 1) good for back seat, 2) good for bottom seat, 3) good for back seat and bottom seat, and 4) not good for all, using 11 types of good postures, and guide good postures and correction as e) ~ h) for the deviant postures as a) ~ d) with each good posture, as shown Figure 5. Using the results, we can guide good postures for bad or problems of postures while driving.
ACKNOWLEDGMENT
This research was supported by the Youngsan University research grant in 2018
REFERENCES
[1] G. Andreoni, G. C. Santambrogio, M. Rabuffetti, A. Pedotti, Method for the analysis of posture and interface pressure of car drivers, Journal of Applied Ergonomics, vol 33, pp. 511–522, 2002. [2] I. Mircheski, T. Kandikjan, S. Sidorenko, Comfort analysis of
vehicle driver’s seat through simulation of the sitting process, Journal of Technical Gazette, vol 21, no 2, pp. 291-29, 2014.. [3] Physio Med, Correct Sitting Posture: Driving,
http://www.physiomed. co.uk, Physio Med Limited.
[4] BackCare, Driving and back pain - BackCare, http://www.backcare. org, the National Back Pain Association, 2009.
[5] C. Yan, B. Zhang and F. Coenen, Driving posture recognition by convolutional neural networks, IET Computer Vision, vol 10, issue 2, pp. 103-114, 2015.
[6] S.J. Park, Estimation of Driver’s Standard Postures by a Multivariate Analysis Method, Journal of the Ergonomics Society of Korea, vol. 25, no 1, pp. 27-33, 2006.
[7] Y. Choi, J. Park, B. Lee and H. You, A Classification of Sitting Strategies Based on Seating Pressure Distribution”, Journal of the Korean Institute of Industrial Engineers, vol 39, no 2, pp. 105-108, 2013..
[8] T. Kim, K. Choi, E. S. Jung, S. Park, and J. Choi, Effects of Driving Environment on Driver’s Posture, Journal of the Korean Institute of Industrial Engineers, vol. 29, no 4, pp. 271-282, 2003. [9] G. O. Kadilar, Effects of Seating Position of Short Stature Drivers
in Frontal Impacts, IRCOBI Conference 2013, pp.842-853, 2013. [10] S. Bahri, M. Tamrini, K. Yokoyamai, J. Jalaludin, N. A. Aziz, N.
Jemoin, R. Nordin, A. L. Naing, Y. Abdullah and M. Abdullah, The Association between Risk Factors and Low Back Pain among Commercial Vehicle Drivers in Peninsular Malaysia: A Preliminary Result, Industrial Health, vol 45, pp. 268–278, 2007. [11] C-Y J. Peng, K. L. Lee and G. M. Ingersoll, An Introduction to
[12] H. Mohammed H. Al-Taweel, W. Young and A. Sobhani, A binary logistic regression model of the driver avoidance manoeuvers in two passenger vehicle crashes”, Australasian Transport Research Forum 2016 Proceedings, Melbourne, Australia, November 16-18, 2016.
[13] K. Lipovac, S. Čicevic and B. Antic, A Model for Traffic Accidents Prediction based on Driver Personality Traits Assessment, Human – Transport Interaction Preliminary Communication, vol 29, no 6, pp. 631-642, 2017.
[14] G. O. Kadilar, Effect of driver, roadway, collision, and vehicle characteristics on crash severity: a conditional logistic regression approach, International Journal of Injury Control and Safety Promotion, vol 23, no. 2, pp.135-144, 2016.
[15] A. Murata and K. Naitoh, Multinomial Logistic Regression Model for Predicting Driver’s Drowsiness Using Only Behavioral Measures, Journal of Traffic and Transportation Engineering, pp. 80-90, 2015.
[16] H. Shirmohammadi and F. Hadadi, Assessment of Drowsy Drivers by Fuzzy Logic approach based on Multinomial Logistic Regression Analysis, International Journal of Computer Science and Network Security, vol 17, no 4, pp.298-305, 2017.
[17] NCSS, Chapter 321, Logistic Regression, NCSS Statistical Software, pp. 321-1-321-69.
[18] Y. Hwang , K. Kim , O. Kwon , I. Moon , G. Shin , J. Ham , and J. Park , Analyzing Box-Office Hit Factors Using Big Data: Focusing on Korean Films for the Last 5 Years, Journal of Information and Communication Convergence Engineering, vol. 15, no. 4, pp.217-226, 2017.