STUDY ON SIALIC ACID AS BIOMARKER OF CANCER
Arpita Chatterjee1, Sudip Kumar Sinha2, Gopeswar Mukherjee31.INTRODUCTION
In modern life malignant neoplasm or cancer is the main reason of morbidity and mortality as well as cause of fear throughout the whole world [1,2,3,16]. In economically developed countries, the leading cause of death is cancer whereas in developing countries it is the second leading cause of death [7]. In females, breast cancer is the most frequently diagnoses cancer and is the leading cause of cancer death (23% of total cancer cases and 14% of cancer deaths). In males, the leading site of cancer is lung cancer (17% of total cancer cases and 23% of total cancer deaths) [4,5,6,8].
Early diagnosis, proper prognosis, screening for malignancy in asymptomatic groups are main current clinical practice in oncology. Now-a-days tumor markers are assumed to play a major role in all the aspects of cancer care i.e. starting from screening to follow up after treatment. During the course of tumor development, quantitative changes have been shown to occur in a variety of substances in serum. These substances are collectively referred to as biochemical markers or tumor markers [15,18]. They can be found in blood, urine and tissues etc. Tumor markers can be found in tissue (tissue tumor markers; in bone marrow or circulating tumor cells in blood, lymph nodes, solid tumors etc.) or in body fluids like pleural fluid, serum etc. (serological tumor markers). To diagnostic pathologists, tissue tumor markers are of main importance, but clinicians more often use the serological tumor markers. Tumor markers can be specific for particular type of cancer or can be found in several types of cancer. The main use of tumor markers is to detect cancer at an early stage so that cancer can be treated and can be prevented the chance to grow and spread.
There are only few tumor markers which are well established and are used by the physicians. Sialic acid level in body fluid may be used as an important biomarker to screen and diagnose cancer [27,29]. The term sialic acid is used to describe derivatives of neuraminic acid, where the amino group of neuraminic acid is substituted by either an acetyl or glycolyl group. The unique structural features of the molecule, which includes a negative charge owing to a carboxyl group, enables it to play a role in cellular functions, such as transport of positively charged compounds, cell-to-cell repulsion, influencing conformation of glycoproteins on cell membranes, and even masking antigenic determinants on receptor molecules [28].
Slalic acids are one of the most important molecules of life, since they occupy the terminal position on macromolecules and cell membranes and are involved in many biological and pathological phenomena. Sialic acids play a dual role, not only are they indispensable for the protection to and adaptation of life, but are also utilized by life-threatening infectious microorganisms [24]. It is mainly found in glycoproteins and gangliosides. It is the end moieties of carbohydrate chain and is very much essential for the proper function of glycoconjugates. It is one of the major components of the cell membrane. Sialic acid has major role to determine the surface properties of the cells. During malignancy due to increase turnover, secretion and shedding from malignant cells, sialic acid is released into circulation, in lymph or blood [22].
In epidemiological studies diagnosis of the disease in early stage in the main focus for search of tumor markers. In the light of such problems, it would be very useful to find biochemical markers that allow to suspect the presence of the carcinoma at early stages. Considering the high prevalence of malignancy, the present study was undertaken to validate diagnostic value of total sialic acid and lipid-bound sialic acid. The objectives of this study were to estimate the sialic acid amount in cancer patients and normal cases (control group) and compare the amount of patients with normal cases.
1
Barasat College, 1, Kalyani Road, PO- Nabapally, Barasat, Kolkata, India.
2
Victoria Institution (College), 78B, APC Road, Kolkata, India.
3
Department of Research and Development, Barasat Cancer Research and Welfare centre, Banamalipur, Barasat, Kolkata, India.
Abstract- In the present study total serum sialic acid (TSA), lipid associated sialic acid (LASA), total protein (TP) and TSA/TP factor was estimated in 53 patients suffering with breast, lungs, gastrointestinal and other types of cancer, and compared to 50 healthy controls. The patients enrolled were newly diagnosed for cancer but without having any treatment till before the experiment was performed. A significant increase in TSA and LASA was observed along with decrease in TP values in all the cases of cancer. When TSA was normalized to TP, the value found was increased significantly in cancer patients in comparison to normal cases. The specificity and sensitivity study of TSA, LASA and TSA/TP showed that TSA/TP had greater specificity and sensitivity when comparing to other two. Thus it can be inferred that these are sensitive markers regarding early detection of malignancy and useful in monitoring cancer patients.
Keywords – Total serum sialic acid, lipid associated sialic acid, TSA/TP factor.
2.MATERIALSANDMETHODS
Total numbers of samples tested were 103 of which include 50 normal samples and 53 from patients suffering with different types of cancers. Patients enrolled in this study were newly diagnosed for cancer but without having any treatment till befor e the experiment was performed. Written consent was taken from all the human subjects and it was approved from the review committee of Barasat Cancer Research and Welfare Centre, Kolkata. Whole blood was drawn by veinipuncture method from cancer patients and also from normal controls. For coagulation, the bloods were centrifuged at 2000 rpm for 10 minutes at room temperature. The sera obtained were then kept in test tubes and were stored at -20°C for further experiments.
2.1 Lipid associated sialic acid (LASA) measurement–
Lipid associated serum sialic acid (LASA) was measured by using the methods of Katopodis et.al. [20] with slight modification in volume done by Plucinsky et.al. [19]. The 50 μl sera were mixed with 150 μl of distilled water, vortexed and kept on ice. 3 ml cold (4°C) chloroform: methanol was mixed in this chilled mixture, vortexed for 30 seconds, 0.5 ml distilled and deionised water was added and votexed again for 30 seconds. Then tubes are centrifuged at 2500 rpm for 5 minutes.1 ml of upper layer was transferred to another tube and 50 μl phosphotungstic acid was mixed by vortexing. The tubes were kept at room temperature for 5 minutes and then centrifuged at 2500 rpm for 5 minutes. Supernatant was removed and pellet was re-suspended in 1 ml warm (37°C) water. 1 ml of resorcinol reagent was added to the tubes and vortexed to mix. Tubes were kept in boiling water bath for exactly 15 minutes and then in ice for 10 minutes. 2 ml butyl acetate: n- butanol was added. After mixing the tubes were centrifuged at 2500 rpm for 5 minutes at room temperature. The blue chromophore was extracted and read at 580 nm. LASA amount was determined from the standard curve of N-acetylneuraminic acid and expressed in mg/dl.
2.2 Total sialic acid (TSA) measurement –
Total sialic acid (TSA) was measured using the method described by Plucinsky et.al. [19]. The 20 μl sera were taken in a test tube and were mixed with 980 μl of distilled and deionised water by vortexing. The mixture was kept in ice. 1 ml resorcinol reagent was mixed to the chilled sample and vortexed. The tubes were kept in boiling water bath for exactly 15 minutes and then placed on ice for 10 minutes. Then 2 ml butyl acetate: n-butanol mixture was added to each tube and vortexed. This followed centrifugation at 2500 rpm for 5 minutes. The extracted blue chromophore was read at 580 nm. The amount of TSA was determined using the standard curve of N-acetylneuraminic acid (NANA). Amount was expressed in mg/ dl.
2.3 Total protein (TP) measurement –
Serum total protein (TP) was estimated using Autozyme Total Protein Reagent by using Biuret method. The reaction is carried out at high pH and gives a violet colour.
2.4 Statistical analysis –
Student’s t test was used here to check whether the mean values of TSA, LASA, total protein (TP), and TSA/TP were significantly different in the cancer and normal groups. Significant results were considered when P values < 0.01. For, P values > 0.1, results were considered as NS (no significance).
3.RESULT
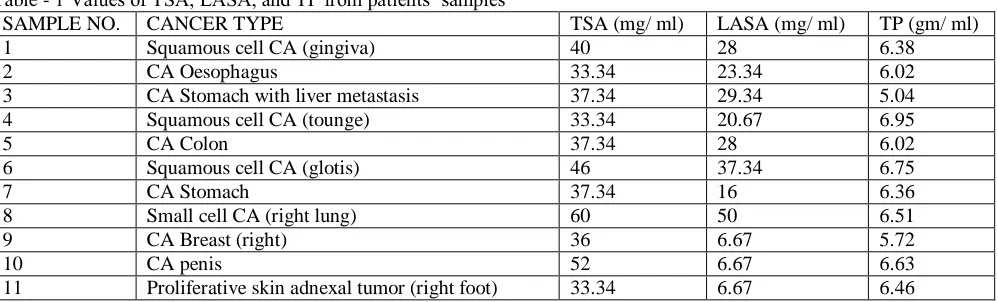
The result revealed that TSA and LASA levels were significantly increased (P < 0.0001) in cancer patients when compared to normal cases. TP value decreased significantly (P < 0.0001) in cancer patients compared to normal cases. When TSA was normalized to TP, the value found was increased significantly (P < 0.0001) in cancer patients in comparison to normal cases. Table 1 and 2 represents the values of TSA, LASA, and TP obtained from cancer patients as well as normal samples, respectively. Table 3 represents the comparison of TSA, LASA, TP, and TSA normalized to TP values (mean), obtained from cancer patients and normal controls.
Table - 1 Values of TSA, LASA, and TP from patients’ samples
SAMPLE NO. CANCER TYPE TSA (mg/ ml) LASA (mg/ ml) TP (gm/ ml)
1 Squamous cell CA (gingiva) 40 28 6.38
2 CA Oesophagus 33.34 23.34 6.02
3 CA Stomach with liver metastasis 37.34 29.34 5.04
4 Squamous cell CA (tounge) 33.34 20.67 6.95
5 CA Colon 37.34 28 6.02
6 Squamous cell CA (glotis) 46 37.34 6.75
7 CA Stomach 37.34 16 6.36
8 Small cell CA (right lung) 60 50 6.51
9 CA Breast (right) 36 6.67 5.72
10 CA penis 52 6.67 6.63
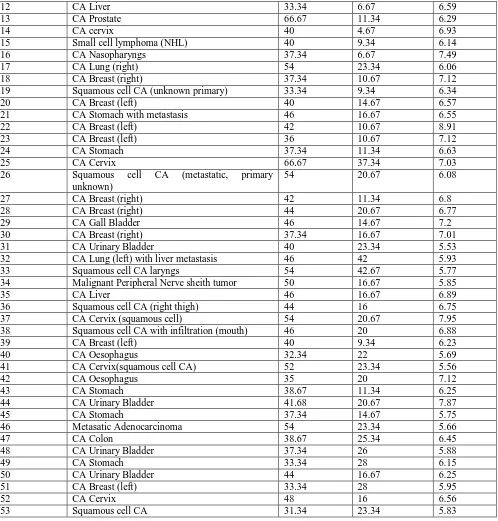
12 CA Liver 33.34 6.67 6.59
13 CA Prostate 66.67 11.34 6.29
14 CA cervix 40 4.67 6.93
15 Small cell lymphoma (NHL) 40 9.34 6.14
16 CA Nasopharyngs 37.34 6.67 7.49
17 CA Lung (right) 54 23.34 6.06
18 CA Breast (right) 37.34 10.67 7.12
19 Squamous cell CA (unknown primary) 33.34 9.34 6.34
20 CA Breast (left) 40 14.67 6.57
21 CA Stomach with metastasis 46 16.67 6.55
22 CA Breast (left) 42 10.67 8.91
23 CA Breast (left) 36 10.67 7.12
24 CA Stomach 37.34 11.34 6.63
25 CA Cervix 66.67 37.34 7.03
26 Squamous cell CA (metastatic, primary
unknown)
54 20.67 6.08
27 CA Breast (right) 42 11.34 6.8
28 CA Breast (right) 44 20.67 6.77
29 CA Gall Bladder 46 14.67 7.2
30 CA Breast (right) 37.34 16.67 7.01
31 CA Urinary Bladder 40 23.34 5.53
32 CA Lung (left) with liver metastasis 46 42 5.93
33 Squamous cell CA laryngs 54 42.67 5.77
34 Malignant Peripheral Nerve sheith tumor 50 16.67 5.85
35 CA Liver 46 16.67 6.89
36 Squamous cell CA (right thigh) 44 16 6.75
37 CA Cervix (squamous cell) 54 20.67 7.95
38 Squamous cell CA with infiltration (mouth) 46 20 6.88
39 CA Breast (left) 40 9.34 6.23
40 CA Oesophagus 32.34 22 5.69
41 CA Cervix(squamous cell CA) 52 23.34 5.56
42 CA Oesophagus 35 20 7.12
43 CA Stomach 38.67 11.34 6.25
44 CA Urinary Bladder 41.68 20.67 7.87
45 CA Stomach 37.34 14.67 5.75
46 Metasatic Adenocarcinoma 54 23.34 5.66
47 CA Colon 38.67 25.34 6.45
48 CA Urinary Bladder 37.34 26 5.88
49 CA Stomach 33.34 28 6.15
50 CA Urinary Bladder 44 16.67 6.25
51 CA Breast (left) 33.34 28 5.95
52 CA Cervix 48 16 6.56
53 Squamous cell CA 31.34 23.34 5.83
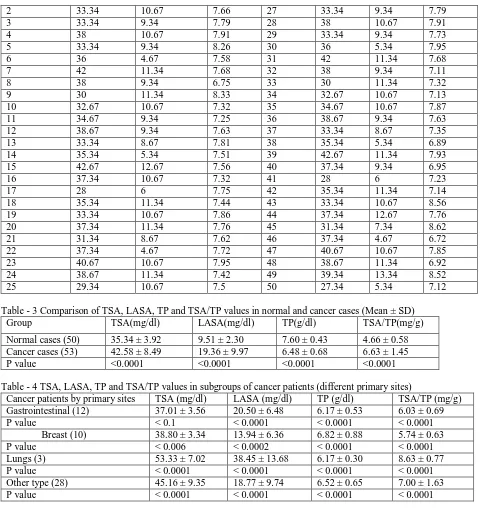
In the present study the TSA value showed significant increase (P < 0.1) for gastrointestinal cancer subgroup. In breast cancer the TSA value is less significantly increased (P < 0.006), and in lung and other types of cancer this value is significantly increased (P < 0.0001). LASA values were also increased significantly (P < 0.0001 to P < 0.0002) in the above subgroups. There was a significant decrease in serum TP values (P < 0.0001) for all subgroups of cancer patients when compared to normal controls. For TSA/ TP values, they showed significant increase (P < 0.0001) in all cancer patients’ subgroups when the value was compared with normal controls. The Table 4 shows the comparisons of all the values obtained from sera (TSA, LASA, TP and TSA/TP) from subgroups of cancer patients (i.e. primary sites differ from one another) and normal samples. Comparison was done to the mean TSA value for normal samples and for patients’ samples.
Table - 2 Values of TSA, LASA, and TP obtained from normal samples
SAMPLE NO. TSA (mg/ dl) LASA (mg/ dl) TP (gm/
dl)
SAMPLE NO.
TSA (mg/ dl)
LASA (mg/ dl)
TP (gm/
dl)
2 33.34 10.67 7.66 27 33.34 9.34 7.79
3 33.34 9.34 7.79 28 38 10.67 7.91
4 38 10.67 7.91 29 33.34 9.34 7.73
5 33.34 9.34 8.26 30 36 5.34 7.95
6 36 4.67 7.58 31 42 11.34 7.68
7 42 11.34 7.68 32 38 9.34 7.11
8 38 9.34 6.75 33 30 11.34 7.32
9 30 11.34 8.33 34 32.67 10.67 7.13
10 32.67 10.67 7.32 35 34.67 10.67 7.87
11 34.67 9.34 7.25 36 38.67 9.34 7.63
12 38.67 9.34 7.63 37 33.34 8.67 7.35
13 33.34 8.67 7.81 38 35.34 5.34 6.89
14 35.34 5.34 7.51 39 42.67 11.34 7.93
15 42.67 12.67 7.56 40 37.34 9.34 6.95
16 37.34 10.67 7.32 41 28 6 7.23
17 28 6 7.75 42 35.34 11.34 7.14
18 35.34 11.34 7.44 43 33.34 10.67 8.56
19 33.34 10.67 7.86 44 37.34 12.67 7.76
20 37.34 11.34 7.76 45 31.34 7.34 8.62
21 31.34 8.67 7.62 46 37.34 4.67 6.72
22 37.34 4.67 7.72 47 40.67 10.67 7.85
23 40.67 10.67 7.95 48 38.67 11.34 6.92
24 38.67 11.34 7.42 49 39.34 13.34 8.52
25 29.34 10.67 7.5 50 27.34 5.34 7.12
Table - 3 Comparison of TSA, LASA, TP and TSA/TP values in normal and cancer cases (Mean ± SD)
Group TSA(mg/dl) LASA(mg/dl) TP(g/dl) TSA/TP(mg/g)
Normal cases (50) 35.34 ± 3.92 9.51 ± 2.30 7.60 ± 0.43 4.66 ± 0.58
Cancer cases (53) 42.58 ± 8.49 19.36 ± 9.97 6.48 ± 0.68 6.63 ± 1.45
P value <0.0001 <0.0001 <0.0001 <0.0001
Table - 4 TSA, LASA, TP and TSA/TP values in subgroups of cancer patients (different primary sites)
Cancer patients by primary sites TSA (mg/dl) LASA (mg/dl) TP (g/dl) TSA/TP (mg/g)
Gastrointestinal (12) 37.01 ± 3.56 20.50 ± 6.48 6.17 ± 0.53 6.03 ± 0.69
P value < 0.1 < 0.0001 < 0.0001 < 0.0001
Breast (10) 38.80 ± 3.34 13.94 ± 6.36 6.82 ± 0.88 5.74 ± 0.63
P value < 0.006 < 0.0002 < 0.0001 < 0.0001
Lungs (3) 53.33 ± 7.02 38.45 ± 13.68 6.17 ± 0.30 8.63 ± 0.77
P value < 0.0001 < 0.0001 < 0.0001 < 0.0001
Other type (28) 45.16 ± 9.35 18.77 ± 9.74 6.52 ± 0.65 7.00 ± 1.63
P value < 0.0001 < 0.0001 < 0.0001 < 0.0001
For further evaluation of the study, specificity (true negative) and sensitivity (true positive) were also considered. The cut-off values were set by the method of iteration for each case i.e. normal and patients’ groups (TSA, LASA, TP and TSA/TP). Values above the cut-off value were considered positive and below cut-off value were negative. Too high cut-off value would decrease sensitivity and too low cut-off value would decrease specificity. The cut-off values were considered such that in that value they should give the highest specificity and sensitivity. The cut-off values for TSA, LASA, and TSA/ TP were 37.5 mg/ dl, 11 mg/dl, and 5.25 mg/g per dl, respectively. The sensitivity and specificity of the TSA, LASA, and TSA/TP test are considered in Table 5 and 6. These results revealed that TSA/ TP test had highest specificity (82%) and sensitivity (84%) when compared to other two tests. TSA test had the lowest specificity (70%) and sensitivity (60%) than the other two tests.
Table - 5 Specificity (true negative) of TSA, LASA and TSA/TP tests in normal cases
Table - 6 Sensitivity (true positive) of TSA, LASA and TSA/ TP tests
Test TSA ≤ 37.5 mg/ dl (normal) LASA ≤ 11 mg/ dl (normal) TSA/TP ≤ 5.25 mg/g (normal)
Test TSA > 37.5 mg /dl (elevated) LASA > 11 mg/ dl (elevated) TSA/ TP > 5.25 mg/ g (elevated)
Cancer Types Number Sensitivity Number Sensitivity Number Sensitivity
All (53) 32 0.60 37 0.77 45 0.85
Gastrointestinal (12) 3 0.25 12 1.00 11 0.92
Breast (10) 5 0.50 5 0.50 7 0.70
Lung (3) 3 1.00 3 1.00 3 1.00
Other types (28) 23 0.82 21 0.75 24 0.86
4.DISCUSSION
During malignant transformation, glycosylation is heavily altered compared with healthy tissue due to differential expression of glycosyltransferases, glycosidases and monosaccharide transporters within the cancer microenvironment. One key change of malignant tissue glycosylation is the alteration of sialic acid processing that leads to a general up-regulation of sialylated glycans (hypersialylation) on cell surfaces and an increased introduction of the non-human sialic acid N-glycolyl-neuraminic acid (Neu5Gc) instead of N-acetyl-neuraminic acid into cell surface glycans [22]. Sialic acid is one of the major components of glyco-proteins and glyco-lipids, which are necessary to form the cell membranes. In malignant cells, the carbohydrate compositions have been altered in surface glyco-proteins and glyco-lipids. By increase turnover, secretion and shedding from malignant cells, these altered glyco-proteins and glyco-lipids can be released into the circulation (blood, sera). Sialic acid concentrations of the tumor cell surfaces were shown to be related to malignant potential and changes in immunogenicity. The carbohydrate moiety may influence differentiation, growth and cell-to-cell interactions, and thus may be important in malignant transformation [26].
Sialic acid, a family of acety-lated derivatives of neuraminic acid is widely distributed in mammals [17]. They are the end moieties of the carbohydrate chains and are biologically important and essential for functions of glycoconjugates [14,23]. Sialic acid is thought to be important in determining the surface properties of cells and has been implicated in cellular invasiveness, adhesiveness and immunogenicity. They are released into circulation through increased turnover, secretion and/or shedding from malignant cells [26]. In-creased levels of β2-microglobulin and glycoconjugates like total sialic acid and lipid-bound sialic acid have been reported in serum of patients of oral cancer [10,11,12,13,21,30].
Tumor markers are assuming a growing role in all aspects of cancer care, starting from screening to follow-up after treatment, and their judicious application in clinical practice needs a thorough understanding of the basics of pathophysiology, techniques of identification or testing, reasons for out-of-range levels of tumor markers, as well as the knowledge of evidence of their role in any given malignancy [29].
Focus on sialic acid as a tumor marker should be examined from the perspective of aberrant glycosylation in cancer cell membranes owing to activation of new glycosyl transferases that are characteristic of tumor cells, and the role played by sialic acid in tumor cell metastasis including increased capacity to adhere to vascular endothelium, and decreased capacity of cancer cells to be destroyed by host defense mechanisms [9]. The high sensitivity of sialic acid as a tumor marker has been reported in a variety of cancerous conditions. Its specificity, however, is relatively low since there is also an increase in sialic acid-rich glycoproteins in inflammatory diseases. Sialic acid measurements, however, have value in monitoring cancer patients during treatment. A variety of methods are available for the measurement of both total and lipid associated sialic acids in serum or plasma. The newer high performance liquid chromatographic procedures can detect picogram levels of sialic acid and are relatively free of interferences seen with classical procedures [28].
Several investigators have studied the levels of sialic acid in sera or plasma of patients having cancer [25]. They mainly concerned with the TSA, LASA levels where TSA is the value of protein and lipid associated sialic acid (also some free sialic acid), but LASA is only the value of lipid associated sialic acid. Investigators found that, in malignant melanomas, serum TSA levels increased significantly and the levels had a direct relation to tumor burden and recurrence of disease. LASA levels in prostate cancer and bladder cancer patients increased significantly.
In the present study, the values of TSA, LASA, and TP were determined in cancer patients and normal samples to find out if any one of these can be used as marker of cancer to detect the disease at an early stage. TSA, LASA and TSA/ TP values were increased significantly in cancer patients, irrespective of cancer type but they were diagnosed for cancer and had not any treatments before the experiment was performed, when they were compared with normal cases. The TP value decreased significantly in cancer patients in comparison with normal cases. Only significant increase or decrease is not enough to determine whether a substance can be used as marker to detect the disease or not. For that, specificity and sensitivity of TSA, LASA, and TSA/TP were also determined. These values show that TSA/TP had greater specificity (82%) and sensitivity (85%) when comparing to other two (i.e. TSA and LASA).
When cancer patients were grouped according to the primary sites, then also TSA, LASA, and TSA/TP values increased in all cases compared to control groups. TSA value was less significantly increased in gastrointestinal cancers (P < 0.1) and in breast cancers (P < 0.006). But here also when specificity and sensitivity were considered, TSA/TP showed higher sensitivity (for gastrointestinal, breast, lung and other types of cancer the values are 92%, 70%, 100%, 86% respectively) compared to other two (i.e. TSA and LASA). Only in lung cancer cases all of them (TSA, LASA, and TSA/TP) showed 100% sensitivity but former two had lesser specificity (for TSA and LASA values were 70% and 74% respectively).
study may help to detect cancer in early stage or can screen people from a population having chance of being affected in future. Then treatment can be planned to cure the disease at early stage and may be tried to prevent its recurrence. But still further studies needed to conclude whether TSA/TP can be used as a biomarker of cancer or not.
5.CONCLUSION
The result of the study reveals that TSA/TP ratio can be used as marker of cancer to detect the disease at an early stage. But future work should be performed for proper validation of the result.
The values should be checked in pathologic groups (those who don’t have cancer but have some other type of disease e.g. jaundice or anything else) to check whether these values also changed similarly in comparison with normal cases as it happened in cancer patients. If the value of any one substance (TSA, LASA, and/ or TSA/TP) changed only in cancer cases but not in pathologic samples then we may say that substance as a biomarker of cancer. The value should also have to check in the cancer cases after treatment (e.g. surgery, radiotherapy and/ or chemotherapy) and if the values (TSA, LASA, and TSA/TP) get decrease significantly from the values before treatment, then the substance can be confirmed as biomarker of cancer and then only it can be used to detect and diagnose cancer at an early stage.
6.REFERENCES
[1] A. Chatterjee, “A six-year demographic study on stomach cancer incidence in rural population of West Bengal”, in Journal of Environmental
Physiology, v 2, n 1&2, p 80-85, 2009.
[2] A. Chatterjee, “Risk of Prostrate Cancer in Eastern India” in International Journal of Cancer Research, v 8, n 2, p 63-68, 2012.
[3] A. Chatterjee, “Study on the Enraging Severity of Cancer in West Bengal, India from 2003 to 2011”, in Asian Journal of Epidemiology, v 4, n 1, p
23-27, 2011.
[4] A. Chatterjee and G. Mukherjee, “A study on incidental profile of women cancer in West Bengal”, in International Journal of Basic and Applied
Medical Sciences, v 2, n 3, p 116-119, 2012.
[5] A. Chatterjee and G. Mukherjee, “Epidemiological survey and PCR based detection of mutation for breast cancer in West Bengal, India”, in Asian
Journal of Microbiology, Biotechnology & Environmental Science, v 13, n 2, p 285-288, 2011.
[6] A. Chatterjee and S. Sarkar, “A study on the ovarian cancer incidence in southern part of West Bengal”, in European Journal of Biomedical and
Pharmaceutical Sciences, v 3, n 5, p 619-623, 2016.
[7] A. Jemal, F. Bray, M.M. Center, J. Ferlay, E. Ward and D. Forman, “Global cancer statistics” in CA Cancer J Clin, v 61, n 2, p 69-90, 2011.
[8] American Cancer Society, “Cancer Facts & Figures 2010”, in Atlanta: American Cancer Society, 2010.
[9] A. Varki and R. Schauer, “Essentials of Glycobiology”, 2nd Edition, Cold Spring Harbor Press, p Ch 14, 2008.
[10] B. Petkowicz, J.W. Miszczuk, M. Wojtak, et al., “The diagnostic utility of the assay of β2 -microglobulin in the precancerous lesions and oral cancers”,
in Ann Univ Mariae Curie Sklodowska, v XIX, n 1, p 243-247, 2006.
[11] C.R.W.D. Silvia, D.M. Vasudevan and K.S. Prabhu, “Alteration of serum β2-microglobulin in oral carcinoma” in Indian J Clin Biochem, v 17, n 2, p
104-7, 2002.
[12] C.R.W.D. Silvia, D.M. Vasudevan and K.S. Prabhu, “Evalua-tion of serum glycoproteins in oral carcinoma”, in Indian J Clin Biochem, v 16, n 1, p
113-115, 2001.
[13] C.S. Chitra and S. Devi, “Effect of vitamin E on protein bound carbohydrate complexes in radiation treated oral squamous cell carcinoma patients” in
Indian J Clin Biochem, v 23, n 1, p 92-94, 2008.
[14] C.Y. Kadam, R.V. Katkam, A.N. Suryakar, K.M. Kumbar and D.P. Kadam, “Biochemical markers in oral cancer”, in Biomedical Research, v 22, n 1,
p 76-80, 2011.
[15] D. Ayude, G. Gacio, M.P. Cadena, E. Pallas, V.S. Martinez-Zorzano, A. de Carlos and F.J. Rodriguez-Berrocal, “Combined use of established and
novel tumor markers in the diagnosis of head and neck squamous cell carcinoma”, in Oncol. Rep. v 10, p 1345-1350, 2003.
[16] D. Hanahan and R.A.Weinberg, “The Hallmarks of Cancer”, in Cell, v 100, p 57 –70, 2000.
[17] F. Akcay, S. Taysi, C. Uslu, Y. Dogru and K. Gümüstekin, “Levels of soluble intercellular adhesion molecule-1 and total sialic acid in serum of
patients with laryngeal cancer”, in Jpn. J. Clin. Oncol. v 31, n 12, p 584-588, 2001.
[18] H. Lal, “Biochemical studies in head and neck cancer”, in Clin Biochem, v 27, n 4, p 235-43, 1994.
[19] M.C. Plucinsky, W.M. Riley, J.J. Prorok and J.A. Alhadeff, “Total and lipid-associated serum sialic acid levels in cancer patients with different
primary sites and differing degrees of metastatic involvement”, in Cancer, v 58, n 12, p 2680-5, 1986.
[20] N. Katopodis, Y. Hirshaut, N.L. Geller and C.C. Stock, “Lipid-associated sialic acid test for the detection of human cancer”, in Cancer Research, v 42,
p 5270-5, 1982.
[21] N. Vaishali and J.V. Tupkari, “An estimation of serum β2-microglobulin level in premalignant lesions/conditions and oral squamous cell carcinoma: A
clinicopathological study”, in J Oral Maxillofac Pathol, v 9, n 1, p 16-19, 2005.
[22] O.M.T. Pearce and H. Laubli, “Sialic acids in cancer biology and immunity”, in Glycobiology, v 26, n 2, p 111-128, 2015.
[23] P.S. Patel, G.N. Raval, R.M. Rawal, et al., “Importance of glycoproteins in human cancer”, in Indian J Biochem Biophys, v 34, p 226-233, 1997.
[24] R. Schauer, “Achievements and Challenges of Sialic Acid Research”, in Glycoconj J, v 17, n 7-9, p 485–499, 2000.
[25] S.L. Tewarson, V.P. Mittal, M. Singh and G.P. Gupta, “Serum sialic acid--an important cancer marker”, in Indian J Cancer, v 30, n 3, p 125-31, 1993.
[26] S. Manoharan, M. Padmanabhan, K. Kolanjiappan, et al., “Analysis of glycoconjugates in patients with oral squamous cell carcinoma”, in Clin Chim
Acta, v 339, p 91-96, 2004.
[27] S.M.S. Susik and S.P.D. Reddy, “Tumor Markers in Clinical and Diagnostic Oncology – Revisited”, in Indian J Dent Adv, v 7, n 2, p 121-131, 2015.
[28] S. Narayanan, “Sialic acid as a tumor marker”, in Ann Clin Lab Sci., v 24, n 4, p 376-84, 1994.
[29] S. Sharma, “Tumor markers in clinical practice: General principles and guidelines”, in Indian J Med Paediatr Oncol, v 30, n 1, p 1–8, 2009.
[30] Y. Kimura, S. Fujieda, T.T. Bayashi, et al., “Conventional tumor markers are prognostic indicators in patients with head and neck squamous cell