- 244 - Abstract— This paper presents the basic features of the simulation tool; MATLAB. Specific performance problems in Electronic System Control and Asynchronous Transfer mode Communication networks are outlined. Conventional solutions to these problems are described. The application of MATLAB in solving same problems is further showcased in the paper.
Finally, test results and proof of improvement in the solution strategies are elucidated.
Key words—Fuzzy, Matlab, Simulation
I. INTRODUCTION
The name MATLAB stands for Matrix Laboratory. It is a high performance tool that enhances technical computing as it integrates Computation, Visualisation and Programming in a user friendly computer system environment.
Technical problems in Matrix and vector forms are solved directly without the need for rigorous lines of codes written in high level languages.
A very important feature of MATLAB is a collection of increasingly Add-On – Application specific solutions referred to as Tool Boxes. These are comprehensive collections of MATLAB functions referred to as M.-files. Currently Toolboxes exist for solution of problems in the fields of; Signal Processing [4,5], Control Systems, Fuzzy Logic, Genetic Algorithm, Neural Networks, Wavelets, Filter Design, Simulation etc.
MATLAB consists of five main parts; The Desktop tools and Development environment is a Graphics User
Interface (GUI) that presents the Desktop and command window, command history, Editor and Debugger, browsers
for viewing help, workspace files and the search path. The MATLAB mathematical function library is a vast collection of basic mathematical operators such as Arithmetic, Matrix inverse and Eigenvalues, Bessel functions, Fast Fourier transform etc. The MATLAB language allows for MATLAB programs to be inserted to aid existing command. The graphics part of MATLAB has facilities for displaying graphs of matrices and vectors, it allows for editing and hence customisation of the graphs. Finally, the part; MATLAB External Interfaces/ API is a library that allows you to develop algorithms in C and FORTRAN which interact with MATLAB common.
In Electronic systems control, the problem is usually centred on the determination of the value of system parameters which are actually components of the System Transfer Function. The problem of the Control Engineer is to ensure that these parameters yield a desired output response, while also maintaining stability. This is vital in feedback systems. Specific problems include Filter designs, Computer
Hard Disk Drive head system design, Links to a flexible Robot design, Anti Lock Braking system (ABS) designs etc.
The Asynchronous Transfer mode (ATM) [1] is a current switching system that employs the Virtual Packet Switching techniques [2] to deliver Multimedia (Video, Audio, Data) information simultaneously through the same network. Since ATM simultaneously attempts to support voice, data and video applications, each one having different performance and Quality of service QoS requirements, It becomes imperative that for optimal utilization of the network, the system architecture requires complex, non linear, distributed control structures. In order to achieve its potential, ATM network will need to accommodate several interacting control mechanisms such as Call Admission control, Flow and Congestion control, Input Rate regulation, Routing, Bandwidth allocation, Queue scheduling and Buffer management.
II. CONVENTIONALSOLUTIONTOTYPICAL
ELECTRONICSYSTEMSPROBLEMS
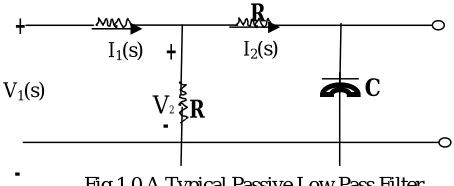
A typical electronic control problem is the development and investigation of a simple filter.
A passive low filter is shown in Fig 1 below
The current and voltage equations are:
I1 = (V1-V2)G,……….Equation 1
I2 = (V2-V3)G, ……….Equation 2
V2 = (I1-I2)R,……….Equation 3
V3= I2z,……….Equation 4
Using an appropriate tool; for instance, Signal Flow graph, the following system transfer function is derived for the filter. T(s) = 1/3RC
S+2/3RC
For a lowpass filter that passes signal at f =106 Hz with a
Improving the Performance Of Electronic
Systems Using Matlab As A Simulation Tool
C. IHEKWEABA, I.G OKECHUKWU
-I2(s)
-+
R
C
V
2R
+
I1(s)
V1(s)
ISSN: 1793-8236
- 245 - d.c gain of 0.5, the following parameters R = 1k and C = 1uf is obtained. [3]
Further, graphs of the system parameters are plotted in a bid to confirm that the system is performing properly.
In this field, the system transfer function is very important in control operations. Derivation of transfer function for complex systems can be rigorous. In some systems, random inputs are fed into them (the systems), data is collected, at the output(s), methods including the Least square method are applied to compute the parameters and hence transfer function of the system under investigation.
Conventionally, stability of control systems are obtained by manual calculations and application of Nyquist criteria, Bode plots etc.
Conventional methods of solving ATM
Telecommunications problems have existed. ATM requires a robust traffic control scheme to allow the admission of cells into the network, monitor and discard optimally cells that are not conforming with the originally agreed upon-network characteristics. The mechanism that determines the connections to be accepted or rejected based on available resources is referred to as Call Admission Control (CAC). Another mechanism; the Usage Parameter Control (UPC) serves to police network operations, while
detecting connections that violate the conditions originally accepted before connection set up.
Conventionally, CAC is considered the most important component in ATM traffic control framework as proposed by ITU-T through recommendation 1.371 and ATM forum UNI 3. In CAC, some networks depend only on preventive. congestion control, whereby a very large bandwidth is originally provided for handling traffics or some reserves are kept in case of congestion. However, the former could be expensive and unnecessary at low traffic. Reactive Congestion Control as used by networks operates by detecting and easing out congestion. Some networks depend on UPC. Here, the police as it is usually referred to, checks mean rates and with respect to allowable values, rejects bursts. Here, cells are passed or dropped based on an evaluation of conformance to the traffic control and negotiated traffic parameters.
Currently, Fuzzy controlled ATM networks have been proposed. However, the problems involved in each sequence of the operations; Fuzification, Generation of rule base, Membership functions and Defuzzification has created a limit to the number of inputs, number of fuzzy levels for each input and subsequently the rule base, these in turn have drastically affected the efficiency of the control systems achieved.
III. APPLICATION OFMATLAB INSOLUTION OFTYPICAL
ELECTRONICPROBLEMS
In a typical filter problem, assuming it is desired to design an active Band Pass Filter that will yield a resonant frequency of 10 KHz, with a maximum gain of 10 and bandwidth of not more than 500Hz.
In solving this problem, an Active bandpass filter model
(fig 2.0) is adopted.
The transfer function for the above circuit is H(s) = V(s) = Ks
E(s) = S2 + Bs + Wo2
Where, Wo = resonant frequency (rad/s) B = Bandwidth (rad/s)
K = Gain
Using the design parameters given, then
Bf = 500Hz, B = 2 , Bf = 2 * * 500 =
1000 = 103
K = 10B = 10 * 1000 = 104
Fo = 10KHz = 104Hz, Wo = 2 Fo = 2 * * 104
Thus the System Transfer Function
H(s) = 104S
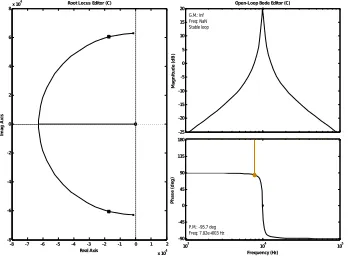
S2 + 103S + 4 2 108 Using MATLAB, these parameters are fed into the system, MATLAB generates the system transfer function. The system further generates the following plots; Root Locus, Bode, Frequency response and Nyquist. etc as shown in
Fig. 3, Fig. 4, Fig. 5 and Fig. 6 below. These are direct outputs from the MATLAB operation.
103 104 105
-90 -45 0 45 90 135 180
P.M.: -95.7 deg Freq: 7.82e+003 Hz
Frequency (Hz)
P
h
a
s
e
(
d
e
g
)
-25 -20 -15 -10 -5 0 5 10 15 20
G.M.: Inf Freq: NaN Stable loop
Open-Loop Bode Editor (C)
M
a
g
n
it
u
d
e
(
d
B
)
-8 -7 -6 -5 -4 -3 -2 -1 0 1 2 x 10⁴
-8 -6 -4 -2 0 2 4 6 8x 10
4 Root Locus Editor (C)
Real Axis
Im
a
g
A
x
is
Fig. 3 Root Locus plot using MATLAB
E
R
R
R
OP
-+
+
-V
+
- 246 -
4 4.5 5 5.5 6 6.5 7 7.5 8 8.5 9 9.5
x 104
4 5 6 7 8 9 10
Bandpass Filter Frequency Response Magnitude
Frequency (rad/s) R e s p o n s e M a g n it u d e
3 dB Line
Fig. 4 Frequency response plot using MATLAB
Nichols Chart
Open-Loop Phase (deg)
O p e n -L o o p G a in ( d B ) Nyquist Diagram Real Axis Im a g in a ry A x is Bode Diagram
Frequency (Hz)
Bode Diagram
Frequency (Hz) Pole-Zero Map Real Axis Im a g in a ry A x is Impulse Response Time (sec) A m p li tu d e
-90 -45 0 45 90
-30 -20 -10 0 10 20
-2 0 2 4 6 8 10
-5 0 5
2 4 6 8 10
x 104 -30 -20 -10 0 10 20 M a g n it u d e ( d B )
2 4 6 8 10
x 104 -90 0 90 P h a s e ( d e g ) -40 -20 0 20 M a g n it u d e ( d B )
-1500 -1000 -500 0 -5
0 5 x 10⁴
0 1 2 3 4
x 10-3 -3 -2 -1 0 1 2 3 4x 10
4
Fig. 5, 6 Response plots, Nyguist chart etc using MATLAB
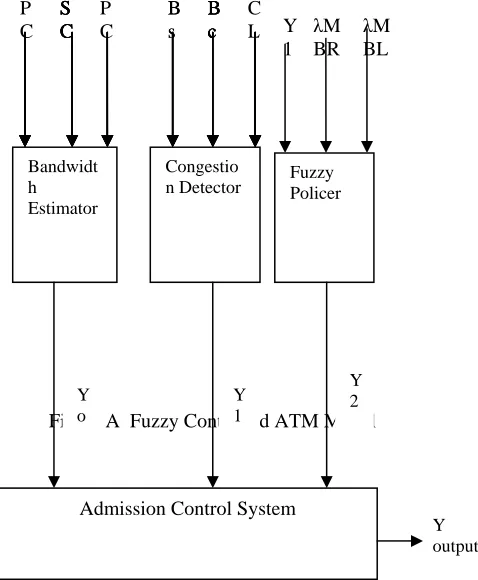
Using MATLAB on the ATM Fuzzy controller, The model considered consists of four modules; The Admission Control System which perform the final control by reference to the outputs of the other three modules. The bandwidth
Estimator accepts the crisp input values of three ATM traffic descriptors; Peak Cell Rate; PCR, Sustainable Cell Rate (SCR) and Peak Cell Duration (PCD) to generate Y0; the bandwidth requirements of the arriving cell packet. The
Congestion detector accepts the crisp values of the Peak Cell Rate (PCR), Sustainable Cell Rate (SCR) and Cell Loss Ratio (CLR) to generate Y1, which is a measure of the congestion state. The Fuzzy Policer accepts the output of the Congestion Detector(Y1), Ratio of up to-date Mean bit rate to negotiated Mean bit rate λMBR, and the Ratio of up-to-date Mean Burst length to the negotiated. Mean Burst Length to generate Y2 which is a measure of the violation state of the system.
Fig. 7 A Fuzzy Controlled ATM Model
The Term Sets adopted for each parameter are as follows;
TABLE; 1TERM SET ADOPTED FOR THE BANDWIDTH ESTIMATOR MODULE.
T(PCR) T(SCR) T(PCD) T(BS)
Small (S) Small (S) Small (S) Small (S)
Slightly Medium (SM) Slightly Medium (SM) Slightly Medium (SM) Slightly Medium (SM) Medium (M) Medium (M) Medium (M) Medium (M) Slightly Large (SL) Slightly Large (SL) Slightly Large (SL)
Slightly Large (SL)
Large (L)
Large (L) Large (L) Large (L)
TABLE 2TERM SET ADOPTED FOR THE CONGESTION DETECTOR MODULE
T(Bc) T(CLR) T(Y1) T(λMBR)
Small (S) Small (S) Congestion (C) Small (S)
Slightly Medium(S
Slightly Medium (SM)
Slightly
Congestion (SC)
Slightly Medium (SM) Y output Bandwidt h Estimator Congestio
n Detector Fuzzy Policer
P C R S C R P C D B s B c C L R B c B s B c B c S C R S C R S C R Y 1 λM BR λM BL
Admission Control System
ISSN: 1793-8236
247 M)
Medium (M)
Medium (M) No Congestion
(NC) Slightly
Large (SL)
Slightly Large (SL)
Slightly Large (SL)
Large (L) Large (L) Large (L)
T(λMBL)
Small (S) Slightly Medium
(SM) Medium (M) Slightly Large (SL)
Large (L)
TABLE 3TERM SET ADOPTED FOR THE FUZZY POLICER MODULE
On MATLAB, the input signals for each block are defined as shown in Fig. 8, Fig. 9 and Fig. 10 below. Also the fuzzy model; Mamdani, the methods for the basic operations; OR, AND, Implication, Aggregation and Defuzzification are defined.
Fig 8 MATLAB parameters specification for Bandwidth Estimator
Fig 9 MATLAB Parameters Specification for Congestion Detector
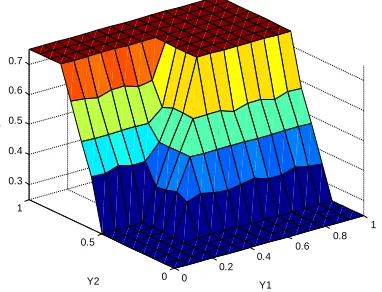
Finally, MATLAB is used to generate surface plots, a specimen of which is shown in Fig. 11a and Fig. 11 b below. The final Plot which is a graphical exposition of the ratio of total calls and acceptable calls, is shown in Fig. 12 below.
Fig 10 MATLAB Parameters Secification for Fuzzy Policer
0
0.2 0.4 0.6
0.8 1
0 0.5
1 0.3 0.4 0.5 0.6 0.7
Y0 Y1
Y
Fig 11a The Fuzzy Controlled ATM Network output surface plot generated by MATLAB
0 0.2
0.4 0.6
0.8 1
0 0.5
1 0.3 0.4 0.5 0.6 0.7
Y1 Y2
Y
- 248 -
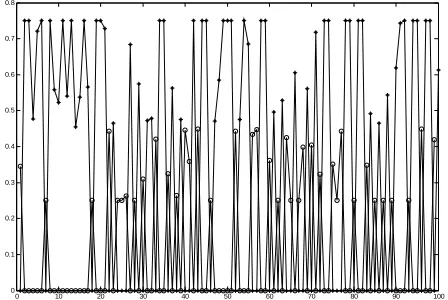
0 10 20 30 40 50 60 70 80 90 100
0 0.1 0.2 0.3 0.4 0.5 0.6 0.7 0.8
Fig 12 The output plot showing total calls, calls accepted and calls rejected
IV. RESULTSOBTAINEDUSINGMATLAB
In this paper, a few problems were solved with MATLAB. In the Active Filter design, MATLAB accepted the important parameters; Bandwidth, resonance frequency and gain. It took a processing time of less than one second on a 1GHz speed laptop, to compute the transfer function and the values of the discrete components. Finally, a customized graph was constructed which visually displayed the eventual performance of the filter designed. The stability of the system was quickly investigated.
In the improvement of the performance of ATM networks, MATLAB made it possible for three inputs and five input variables (resulting to a 125 rule base) for about four modules to be maintained. Tweaking this software made it possible for various parameter values and configurations to be tested in the bid to achieve the rare 62% efficiency obtained.
V. CONCLUSION
MATLAB has proved to be a veritable tool in the research and development of Electronics and Telecommunications systems.
REFERENCES
[1] http:/webopodia.com/TERN/snitching.html
[2] George, P. ‘Principles of Telecommunications and
Packet Network M.Sc Module, EEM.
Ptm.(http://www.eesurvey.ac.uk/personal/G.Parlour/Teaching/Pavilon -ptn-ptsn.pdf)2004-2005 pp.35.
[3] Richard C.D, ‘Modern Control Systems’, Addison-Wesley, 1998, pp. 78-80.
[4] Chiu, S., (1994.), "Fuzzy Model Identification Based on Cluster Estimation," Journal of Intelligent & Fuzzy Systems, Vol. 2, No. 3. [5] Jang, J.-S. R. and C.-T. Sun, Neuro- Fuzzy and Soft Computing: A Computational Approach to Learning and Machine Intelligence, Prentice Hall. (1997.)
[6] Wang, L.-XAdaptive fuzzy systems and control: design and lity analysis, Prentice Hall. (1994.)
[7] Jackson, L., Digital Filtering and Signal Processing with MATLAB Exercises, Third edition, Kluwer Academic Publishers. (1996), [8] McClellan, J.H., C.S. Burrus, A.V. Oppenheim, T.W. Parks, R.W.
Schafer, and H.W. Schuessler, Computer-Based Exercises for Signal Processing Using MATLAB 5, Prentice-Hall. (1998),
[9] Moler, C. "Floating points: IEEE, Inc Standard unifies arithmetic model," Cleve's Corner, The MathWorks., (1996),
[10] Harris, Fredric j., Multirate Signal Processing for Communication Systems, Prentice Hall PTR. (2004),
[11] Lyons, Richard G., Understanding Digital Signal Processing, Prentice Hall PTR. (2004),
[12] Mitra, S.K., Digital Signal Processing, McGraw-Hill. (1998), [13] A. Feldmann, A.C. Gilbert, W. Willinger,,DataNetworks as cascades:
Investigating the multifractal nature of the Internet WAN traffic, SIGCOMM 98, Vancouver. [1998]
[14] A. Pitsillides, A. Sekercioglu, G. RamamurthyEffective Control of Traffic Flow in ATM Networks Using Fuzzy Explicit Rate Marking (FERM), IEEE Journal on Selected Areas in Communications (JSAC),,[ 1997] Volume 15.
Ihekweaba Chukwugoziem holds a Bachelors degree in Electrical/Electronics Engineering Anambra State University of Technology, Enugu, Nigeria in 1987. A Masters degree in Computer Science and Engineering from the same University in 1990. A Doctorate degree in Communication & Engineering, Enugu State University of Science and Technology Enugu, Nigeria. The Author’s major field of study is Application of Computational Intelligence in Data Communication Networks.
He has been involved in several projects in Data Communications and has taught Computer Science and Engineering since 1987. He has presented papers in several conferences, published articles in several journals and three books in wide use in several higher institutions.
Engr. Ihekweaba is a member of Nigeria Society of Engineering (NSE), Council for regulation of Engineering
in Nigeria (COREN), Nigeria Computer Society (NCS) and Computer Professionals of Nigeria (CPN).