Page 262 www.ijiras.com | Email: [email protected]
Data Loss Control In A Congested Network Using Computer Based
Forecasting Techniques
ONU, Fergus U.
AKIENE, Promise T. K.
Department of Computer Science, Ebonyi State University, Abakaliki, Nigeria
I. INTRODUCTION
Presently, the computer network and the Internet accommodate simultaneous transmission of audio, video, and data traffic among others. Efficient and reliable data transmission is essential for achieving high performance in a networked computing environment. It is important to avoid high data loss rate in the internet. When a packet is dropped before it reaches its destination, all of the resources it has consumed in transit have been wasted. In extreme cases, this situation can lead to congestion collapse. Over the last decades, Transmission Control Protocol (TCP) and its congestion control mechanisms have been instrumental in controlling packet loss and in preventing congestion collapse across the internet. Optimizing the congestion control mechanisms used in TCP has been one of the most active areas of research in the past few years. While a number of proposed TCP enhancements have made their way into implementations, TCP connections still experience a high loss rate [1].
The basic problem that would lead to this research is that traffic conditions in networks vary considerably over time. In order to look ahead, a prediction model that describes the time-varying traffic conditions throughout the high-speed net- work is needed. Here, three variables (i.e., current traffic information, past traffic information, and prediction traffic information) are investigated to assess the variability in traffic conditions. Current traffic information is one of essential means of estimating traffic trends and it is a component of the prediction model. Past traffic information is used to smooth out abrupt changes in the current traffic flow to avoid extreme forecasts. Traffic prediction information is introduced to represent the dynamic nature of traffic flow [2].
RESEARCH PROBLEMS
It is important to avoid high data loss rate in the network. The phenomenon of packet loss in a congested network if not controlled can lead to a devastating experience. It can crumble an entire network, a business, cause a company to fold or render someone bankrupt.
Abstract: The phenomenon of packet loss in a congested network if not controlled can lead to a devastating experience. It can crumble a business, cause a company to fold or render someone bankrupt. This research work examines the use of a computer based forecasting technique like the Exponential Moving Average (EMA) in the prediction of the possibility of packet loss in a congested network and the control of these drops/losses as they occur. The paper will develop a system that proffers a means of predicting and pinning down the degree of packet losses at any given node, within which a transmission path is seen. And uses the prototyping software methodology. Various processes involved in packet transmission from source to sink in a First-In First-Out (FIFO) Queue system and how to control the problem of packet loss in a congested network is examined. It is observed that some of the causes of loss of packets in transmission are largely dependent on the protocol in use and congestion of traffic way among others.
Page 263 www.ijiras.com | Email: [email protected] DESIGN OBJECTIVE
The design objective is to examine the possible causes of packet loss as well as design and develop a system that will predict, control and eliminate packet losses in a congested network.
MOTIVATION
As congestion wastes the scarce resources and time due to a large number of retransmissions and packet drops, there is the need to attend to this problem and possibly reduced the number of retransmissions and packet losses through the effort of this research.
II. REVIEW OF RELATED WORKS
When congestion occurs in a sensor network, buffer overflows and packet collisions occur because the competition for wireless communications resources can cause dropped packets. Such data losses result in duplication due to retransmission, which is energy inefficient. Therefore, congestion detection and control techniques matched to the characteristics of sensor networks are required.[3].First-In First-Out (FIFO) is the most simple modality of queuing. The incoming packets are put in a single queue and are processed in the order of receiving them. Packets are dropped when the FIFO queue is full (tail drop).[4]
The system is composed of a server and a storage buffer (often referred to as the queue). The server can hold a single packet, and ―serves‖ the packet by performing whatever operation is necessary to process and transmit the packet to its recipient. The server can only accept a new packet when all previous packets have either completed their service (and thus have departed the system) or have had their service time preempted by a packet of higher priority (according to some pre-specified priority rule). The simplest priority rule, and the one that we shall mainly consider, is the First-In-First-Out (FIFO) priority rule. Under the FIFO rule, packets are served in the order in which they arrive, with no preemption. Packets that arrive when the server is busy are placed in the storage buffer to await service. The buffer and server together comprise the queueing station.[5]
Data loss is a problem that occurs on congested networks when users send data or contend for access to the same resources (bandwidth, buffers, and queues). It is important to avoid high data loss rate in the internet. When a packet is dropped before it reaches its destination, all of the resources it has consumed in transit have been wasted. In extreme cases, this situation can lead to congestion collapse. Finite network resources bring about unavoidable competition among transmitted packets, resulting in network congestion and hence data/packet loss. This requires the network or Internet that will guarantee no or less data/packet loss. In packet-switched networks, packets move in and out of the buffers and queues of switching devices as they traverse the network. In fact, a packet-switched network is often referred to as a "network of queues." A characteristic of packet-switched networks is that packets may arrive in bursts from one or more sources.
Buffers help routers absorb bursts until they can catch up. If traffic is excessive, buffers fill up and new incoming packets are dropped which leads to packet loss. Increasing the size of the buffers is not a solution, because excessive buffer size can lead to excessive delay.[2]
Loss rates are especially high during times of heavy congestion, when a large number of connections compete for scare network bandwidth. Congestion in a network may occur when users send data at a rate greater than what are acceptable by network resources. For example, congestion may occur because the switches in a network have a limited buffer size of memory to store packets for processing. Congestion management is the process of controlling congestion by determining the order in which packets are transmitted out, based on priorities assigned to those packets. Congestion management deals with the creation of queues based on the packets classification, and scheduling of the packets in the queue for transmission. [1]
Packets can be lost in a network because they may be dropped when a queue in the network node overflows. The amount of packet loss during the steady state is another important property of a congestion control scheme. The larger the value of packet loss, the more difficult it is for transport-layer protocols to maintain high bandwidths, the sensitivity to loss of individual packets, as well as to frequency and patterns of loss among longer packet sequences is strongly dependent on the application itself. [1]
A. PACKET LOSS IN A CONGESTED NETWORK
Figure 1: Input and Output out of a Queue
One factor that is of note is traffic intensity = (arrival rate)/(departure rate) where arrival rate = number of arrivals per unit time and departure rate = number of departures per unit time. Traffic intensity is a measure of the congestion of the system. If it is near to zero there is very little queuing and in general as the traffic intensity increases (to near 1 or even greater than 1) the amount of queuing increases. For the system we have considered above the arrival rate is 0.5 and the departure rate is 4 so the traffic intensity is 0.5/4 = 0.125
Packets from different flows arrive at a switch or router for processing. A good scheduling technique treats the different flows in a fair and appropriate manner. Several scheduling techniques are designed to improve the quality of service. Three of them are here discussed: FIFO queuing, priority queuing, and weighted fair queuing.
The standard packet queueing mechanism is First-In-First-Out, or First-Come-First-Served. Packets are removed from the retransmit queue (and retransmitted) in the same order that they are queued. FIFO is flow-neutral; it does not distinguish between flows with different characteristics.
Page 264 www.ijiras.com | Email: [email protected] noise. Packets can be lost in a network because they may be
dropped when a queue in the network node overflows. The amount of packet loss during the steady state is another important property of a congestion control scheme. The larger the value of packet loss, the more difficult it is for transport-layer protocols to maintain high bandwidths, the sensitivity to loss of individual packets, as well as to frequency and patterns of loss among longer packet sequences is strongly dependent on the application itself.
B. COMMON CAUSES OF PACKET LOSS
There are many potential causes of packet loss in a natwork. This section outlines some of the common ones among them.
a. DUPLEX MISMATCH
This occurs when two ends of a link are using different speed/duplex settings, such as 100Mbps/half-duplex and 1000Mbps/full-duplex. When this occurs, some or all traffic will be lost on the link. To correct this, ensure both sides of the link have identical settings. Ideally, both ends of the connection should be set to "Auto" for both speed and duplex. If a speed or duplex setting must be manually set of one end, ensure that it has been set to the same values on the other end as well.
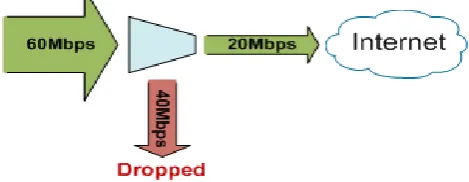
b. LINK CONGESTION (TOO MUCH TRAFFIC)
This occurs when more traffic is attempting to go over a network link than it can support. Such as 60Mbps of traffic passing over the same 20Mbps link. This creates a bottleneck, resulting in some traffic being dropped.
Figure 2: Demonstrating drops at link
There are multiple ways to solve this, including:
Increase the capacity of the link being overwhelmed to allow for all traffic.
Apply traffic shaping rules on MX security appliances or MR access points to limit the volume of traffic. Particularly decreasing the volume of undesirable traffic.
Apply traffic shaping rules on MX security appliances or MR access points to prioritize more important traffic.
c. FIREWALL BLOCKING CERTAIN TRAFFIC
Even if packet loss isn't occurring for all types of traffic, an upstream firewall may be filtering certain types of traffic. This can result in some websites loading and others failing, or some services being accessible, while others are not. If a firewall exists between two devices/locations experiencing these symptoms, ensure that the firewall is not blocking the traffic that is experiencing the problem.
d. BAD CABLE OR LOOSE CONNECTION
A cable that has been poorly/incorrectly terminated or damaged can result in an incomplete or inaccurate electrical signal passing between devices. Swapping a cable with a new one, or performing a cable test on the one in question, can help to eliminate this as a possibility. Similarly, a cable that has not been fully seated in the port, or has been seated in a port with dust or other non-conductive debris on the pins, can result in an incomplete electrical signal. Be sure to keep all ports free of dust or build-up and ensure cables are securely connected.
Also, Network congestion is caused by the fact that packets produced at each node must be forwarded to a sink. In other words, because each node cannot send data directly to the sink, transfers are accomplished through multiple nodes by using a variety of routing protocols. Thus, network congestion occurs as a result of attempting to meet the demand to move these data.
Factors that affect data transfer between the nodes in a WSN are as follows:
Location of the Source Node Location of the Sink Node
Packet type (Text/Image/Sound Data…) Number of transmission paths
Periodic/Event Data incidence
Path change in case of the occurrence of Periodic Data/Event Data
Sink Node change in case of the occurrence of Periodic Data/Event Data
Transfer method (Protocol) Resource of Sensor Node [6]
C. HOW TO CALCULATE PACKET LOSS RATIO
STEP 1
Open a DOS command prompt by navigating to the Start screen and typing "cmd." Press "Enter."
STEP 2
Page 265 www.ijiras.com | Email: [email protected] location such as www.google.com. The return text from the
ping request will look similar to this: Packets: Sent = 4, Received = 3, Lost = 1 (25% loss), Approximate round trip times in milli-seconds: Minimum = 130ms, Maximum = 143ms, Average = 137ms
STEP 3
Verify or calculate the packet loss ratio using the following formula: Number of lost packets / Number of received packets In this example, the formula is calculated below:1/4 = 0.25 = .25%
That is
Figure 3: Viewing Packet Loss
III. COMPUTER BASED FORECASTING TECHNIQUES Technology forecasting is ―the prediction of the invention, timing, characteristics, dimensions, performance, or rate of diffusion of a machine, material, technique, or process serving some useful purpose using technology. [12] which the computer is major.
A. TYPES OF FORECASTING METHODS
QUALITATIVE METHODS
These types of forecasting methods are based on judgments, opinions, intuition, emotions, or personal experiences and are subjective in nature. They do not rely on any rigorous mathematical computations.
QUANTITATIVE METHODS
These types of forecasting methods are based on mathematical (quantitative) models, and are objective in nature. They rely heavily on mathematical computations. [11]
SIMPLE MOVING AVERAGES (SMA)
Simple Moving Average (SMA) is the most common type of average used by experts and it is calculated by dividing the sum of a set of data by the total number of data found in the series. For example, a seven-period moving average can be
calculated by adding the following seven data items together and then dividing the result by seven.
For Example: Given the following series of data: 5, 4, 8, 9, 10, 13, 17
The SMA calculation would look like this: 5 + 4 + 8 + 9 + 10 + 13 + 17 = 66
7-period SMA = 66/7 = 9.428571[9]
EXPONENTIAL MOVING AVERAGE (EMA)
The exponential moving average (EMA) is a weighted moving average (WMA) that gives more weighting, or importance, to recent price data than the simple moving average (SMA) does. The EMA responds more quickly to recent price changes than the SMA. The formula for calculating the EMA just involves using a multiplier and starting with the SMA. The calculation for the SMA is very straightforward. The SMA for any given number of time periods is simply the sum of the closing prices for that number of time periods, divided by that same number. So, for example, a 10-day SMA is just the sum of the closing prices for the last 10 days, divided by 10.
The three steps to calculating the EMA are: Calculate the SMA.
Calculate the multiplier for weighting the EMA. Calculate the current EMA.
The mathematical formula, in this case for calculating a 10-period EMA, looks like this:
SMA: 10 period sum/10
Calculating the weighting multiplier: (2/(selected time period + 1) ) = (2/(10 + 1) ) = 0.1818 (18.18%)
Calculating the EMA: (Closing data-EMA(previous data)) x multiplier + EMA(previous data) [8]
IV. METHODOLOGY
The design methodology used in this research work is the prototyping methodology. This is an approach that allows for designing and implementing an application or system effectively, as prototypes are developed and tested before the final state is reached.
V. IMPLEMENTATION
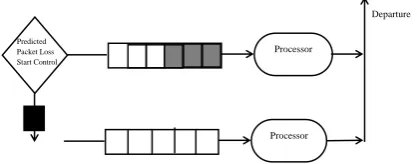
If a packet dropped is predicted on the FIFO queue, from the EMA, then an alarm is raised, which shows a very high probability of the packet being dropped; the packet loss control routine is called up or invoked for packet loss control to be implemented.
Page 266 www.ijiras.com | Email: [email protected]
Figure 5: Modified FIFO Queue for Packet Loss Control
Packets that would have been dropped or discarded are move into auxiliary queue and transmitted instead of been lost or discarded.
Algorithm for developing the System Calculate SMA
Calculate EMA Raise alarm
Start Packet loss control Start the simulation def f(size Q) def f(flowrate) Nentry = f(size Q) Nexit = f(flowrate) Nexp = Nentry + Nexit Nexp =N + Nentry – Nexit i = 1
k = 1 do
move data packet k into Main Queue k = k + 1
loop while N(k) <> length of Queue
Display Main Queue full drop packet into Auxiliary Queue
do
Nexp = N(i) + (Nentry – Nexit(i)) i = i + 1
loop until i = 2 do
move Nexp into Auxiliary Queue
loop until length of Auxiliary Queue = N(k) Call module move data
else exit
VI. DISCUSSION
Packets can be lost in a congested network when they may be dropped due to queue overflow. This shows that more arrivals of packets(Nentry) lead to overflow and network congestion. This will lead to packet drop and hence packet loss. That is, arrival of packets is greater than the exit of packets. Considering this, increasing the number of packets leaving/exiting the queue(Nexit), will definitely increase the flow in the queue. Hence, there will be no overload, no overflow, no congestion, no packet drop and no packet loss.
From the above, there is the need to predict and determine at what point congestion starts, so as to get the exact point/time to start congestion/packet loss control. A packet congestion detector/predictor that notifies the congestion state
of the network; thereby causing diversion to the second route (queue) of the system.
VII. CONCLUSION
Conclusively, network congestion in this regard is the main cause of packet loss. Also system speed, rate of transmission, bandwidth, switching device types (router or hub), transmission medium, number of arrival packets against number of processed packet and that of departure packets plays major role in congestion and hence packet drop. This implies that if packet arrival is greater than packet departure then there is bound to be network congestion hence packet drop and packet loss, and if packet arrival is less than packet departure then there is bound to be no network congestion hence no packet drop and no packet loss. The known procedure of packet drop as a solution to network congestion is not encouraged by this research. A modified FIFO Queue system is implemented, which is more reliable than the former. Hence, if packets are constantly kept below queue capacity, the congestion will be avoided and there will be no packet loss. Predicting the exact point/time for the occurrence of packet loss is key as this enables the packet loss control routine to be invoked and implemented. This research work will increase throughput and quality of service (QoS) on a network, congestion and eliminate packet loss.
REFERENCES
[1] Akiene, Promise T. K. and Kabari, Ledisi G.
(2015),Optimization of Data Packet Transmission in a Congested Network - International Journal of Computer Networks and Security, ISSN:2051-6878, Vol.25, Issue.2 1383 RECENT SCIENCE PUBLICATIONS | September 2015|$25.00 | 27704548|
[2] Akiene, Promise T. K. and Kabari, Ledisi G. (2015)
Simulation of an Optimized Data Packet Transmission in a Congested Network. Network and Complex Systems, Vol.5, No.8, 2015, www.iiste.org ISSN 2224-610X (Paper) ISSN 2225-0603 (Online)
[3] Ga-Won Lee, Sung-Young Lee, and Eui-Nam Huh,
(2014) Congestion Prediction Modeling for Quality of Service Improvement in Wireless Sensor Networks
[4] SZILÁGYI Szabolcs and ALMÁSI Béla (2012) A
Review of Congestion Management Algorithms on Cisco Routers, Journal of Computer Science and Control Systems. Volume 5, Number 1, May 2012 pp 103-107
[5] Michael Neely (2008) Lecture Notes 1 on EE 549 —
Queueing Theory, UNIVERSITY OF SOUTHERN CALIFORNIA, SPRING 2008 pp 1
[6] Ga-Won Lee, Sung-Young Lee, and Eui-Nam Huh (2014)
Congestion Prediction Modeling for Quality of Service Improvement in Wireless Sensor Networks. Sensors (Basel). 2014 May; 14(5): 7857–7880. Published online 2014 Apr 30. doi: 10.3390/s140507857 PMCID: PMC4063004 US National Library of Medicine National Institutes of Health
Processor Processor
Departure
Page 267 www.ijiras.com | Email: [email protected]
[7] J.B. Maverick (2014) What is the Exponential Moving
Average (EMA) formula and how is the EMA calculated? http://www.investopedia.com/ask/answers/122314/what- exponential-moving-average-ema-formula-and-how-ema-calculated.asp
[8] http://www.investopedia.com/ask/answers/05/smavsema.a
sp by Casey Murphy retrieved 18/01/2017
[9]
https://www.techwalla.com/articles/how-to-calculate-packet-loss-ratio retrieved 10/01/2017
[10]https://documentation.meraki.com/zGeneral_Administrati on/Tools_and_Troubleshooting/Troubleshooting_packet_l
oss_between_devices Article ID: 1805 retrieved 10/01/2017[12]
[11]http://mech.at.ua/Forecasting.pdf retrieved Wednesday
18/01/2017
[12] https://www.nap.edu/read/12557/chapter/4 retrieved Wednesday 18/01/2017