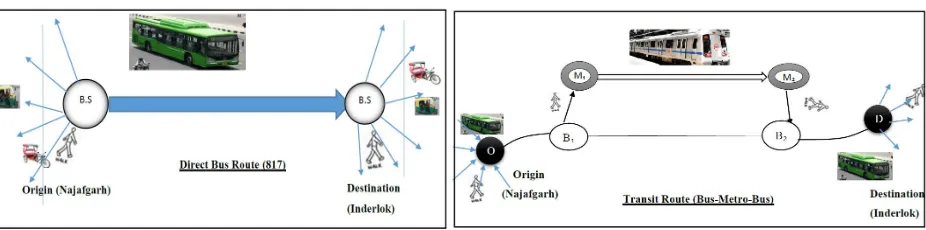
1. Performance analysis of an urban bus and metro route using commuter survey & traffic data
Full text
Figure


Related documents
What percentage of small pelagics (marine and inland) is reduced to animal feed, aquaculture feed, fish oil, etc., in South Africa and Tanzania, and what percentage is directed
unfiltered style, containing puree of white peach, full bodied & sweet. Sudachi Chu (Citrus)
- Detailed imports and exports figures for a period of five years (2007–2011) - Description and analysis of the competitive landscape and the industry structure - Analysis of
The total liabilities to third parties of companies for which Ballast Nedam holds joint and several liability, such as limited partnerships, excluding bank guarantees issued by
a) Wallpaper with symbols, pupils have to guess what comes next. d) Pile of flashcards, pupils guess card on top. e) Teams or pairs - pupils draw with finger on back of
If the results of the site visit, informant interviews, documentary research, and field testing indicate that archaeological resources potentially meeting the National
Martin (2014: 17) is clear that the ‘radical’ shift in Irish activation policy was formulated in Grubb et al.’s (2009) OECD review of Irish activation and adopted by domestic policy
In the current study the performance of a structure in a single degree of freedom system is investigated under different ground motions such as Fault normal and
