Abstract—Current construction practice is suffering from a lack of effective communication. Adopting a ubiquitous smart communication system which provides reliable information will assure operation performance. However the quality of a piece of information exchanged through project network needs to be appraised. An IT-based communication interface, the eCKiosk, has been developed and tested with the goal to improve work performance. This paper presents the Bayesian Belief Network (BBN) procedure to capture how users evaluate the information quality provided by eCKiosk. Poor data quality may lead to variety of expensive process wastes such as idleness, rework, injuries and safety violations. Using such cause-and-effect relationships, this paper will show how a trained BBN is capable of measuring quality of e-communication. Also, a practical example of one quality indicators, ease-of-use, is presented. Learning curve theory is applied to properly model the changing efficiency interacting with proposed IT-based tool.
Index Terms—Bayesian belief network, Ease of use, eCKiosk, Information quality assessment, Learning curve
I. INTRODUCTION
Construction is a large and fragmented industry and hence effective coordination among project participants is essential to achieve project objectives. Of course, key to this is information that is collected, processed and made available for use in a practical format. However, because of the unique conditions, construction suffers from a lack of communication with many islands-of-communication. Construction faces many ill-defined, complex problems with little or unclear information. Indeed, divergent frames of reference, values, and goals generate disagreement, ambiguity and uncertainty. Not surprisingly, [1] predicted drastic improvement in productivity, quality and safety through a modified information supply. Adopting a ubiquitous smart communication system which provides reliable information will improve process performance. However the quality of a piece of information communicated through the project network needs to be evaluated. This paper uses concept of information richness explores compatibility of an information fragment with actual expectation of user at the point of activity. Information richness is associated to the quality of exchanged information. Richer information reduces uncertainty and clarifies ambiguity.
An IT-based communication interface namely Electronic Construction Kiosk (eCKiosk) is introduced in this script. Then following the need to assess the quality of communicated information through the eCKiosk, Bayesian
Manuscript received February 10, 2013; revised May 17, 2013. The authors are with School of Civil and Environmental Engineering, UNSW, Sydney, NSW 2052 Australia (e-mail: [email protected]; [email protected]).
Belief Network (BBN) is used as a tool to measure the information quality (InQ). Finally results of assessing “Ease of Use” as one of the quality attributes is shared.
II. MISCOMMUNICATION
Research has shown that miscommunication in construction is not only responsible for high cost but is associated for many accidents [2], quarrels and even physical fights [3]. Lack of communication may result in faulty job, job tension and/or depression. Fig. 1 depicts a model of bidirectional communication between two persons. Shohet and Friedman [4] addressed importance of effective communication for a construction manager (CM) to aim project objectives. The authors investigated communication pattern between CM and other participants by defining some indexes. They indicate that to overcome huge amount of uncertainty in current complex construction environment, major efforts in coordination and communication between different parties are required. Results introduce interactive communication between CM and design team as the principal channel of communication.
III. The eCKIOSK PROTOTYPE
This paper aims to offer a model for a site-network consisting of a backbone linked to a tier of hubs that interact flexibly with the next tier of data sinks or sources using smart agents. eCKiosk (Fig. 2), the wireless hub, is designed in a way to be able to be moved wherever the crews are working [5]. Ensuring connectivity at all times requires a robust wireless backbone with secure two-way data interfaces. Although it basically works as information delivery tool but it also provides a data collection platform. Indeed the main advantage of eCKiosk is its interactive design. Although the eCKiosk facilitates interaction among e-communication islands, effects of implementing this new tool on quality of communicated information need to be investigated. Since the conventional paper-based information delivery is changing, recognizing the best way of information presentation which best enhances cognition level is also a matter of importance. In proposed site-network, several different sensors collect data from points of interest which after processing will be retrieved through the eCKiosk upon demand. For example, GPS i.e. one of network components provides invaluable information about real time truck mixer’s position and travel time. GPS data in combination with traffic information records provide a reliable decision making support to dispatch trucks from the batch plant and also adjust on-site crew’s productivity. The live positioning information is communicated to the on-site crew through the eCKiosk. In
Assessing the Quality of Electronically Communicated
Information at Construction Field Level
another work package, a set of sensors including but not limited to 360o camera (ladybug), wireless sensors like
thermocouples, and Kinect, track and record changes in real time. Actually construction process is fully monitored and each building element’s evolution is recorded “as-it-was-built”. Consider the value to the end user when “as-it-was-built” shows the exact place of the rebar in a
concrete wall. The other work package toward smart site is a wireless camera attached to the crane hook assisting the crane driver in blind areas. While works as safety reassurance, inserting this new tool into the work process, decrease required crew in unloading tasks and simultaneously increases crane productivity.
Fig. 1. Model of Two-Way Communication [6]
Fig. 2. The eCkiosk prototype
Evaluating the quality of provided information is a way to compare advantage of eCKiosk over paper-based information dissemination approach. To do so BBN was identified as an effective tool to discover the conception of construction laborers about information quality. Using captured users’ belief, a piece of information can be ranked as rich or poor in quality.
IV. BAYESIAN BELIEF NETWORK
A Bayesian network B= G,P , by definition, is a directed acyclic graph (DAG) G and joint probability distribution (JPD) P that together satisfy Markov condition [7]. A DAG is structured by two sets namely nodes and arrows. An arrow from parent node Xi to child node Xj
represents a statistical dependency between two nodes. The conditional probability distribution (CPD) at each node depends only on its parents. Accordingly, B defines a unique JPD over n nodes
{
X1,X2,...,Xn}
as (1).∏
= =
n
i
i i
n P X aents X X
X X P
1 2
1, ,...., ) ( Pr ( ))
( (1)
Predictive and diagnostic are two types of inferences to evaluate unknown JPDs based on evidences about connected nodes. In general B is unknown and finding its structure and parameters is referred to as learning problem.
V. INQASSESSMENT
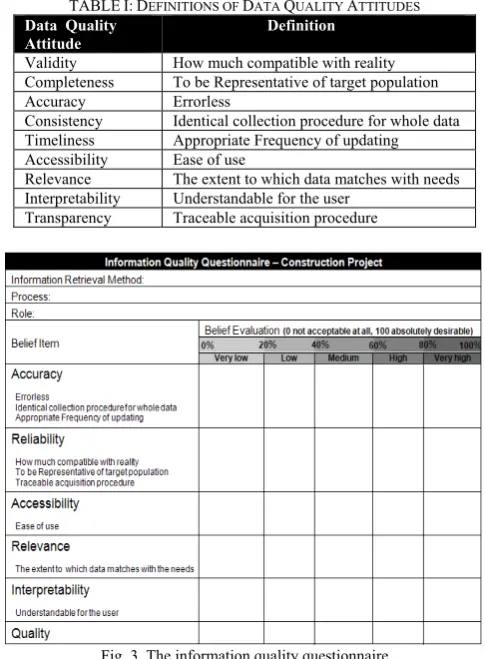
shown in the questionnaire, some of aforementioned quality features were combined to make it simpler for the respondents to decide and particularly faster to fill in order not to frustrate the process. The BBN will be trained by obtained data which means calculating and introducing the conditional probability tables (CPTs) to the BBN. Fig. 4 shows how a typical BBN looks like after training. In this case a set of random numbers where used to train the BBN. After training, the resulted BBN will be verified by checking whether it can predict the quality level of available information correctly or not. When model is verified, it can be used to measure the quality level of provided information through the eCKiosk. Before implementing BBN to measure quality of IT-based communicated information, one needs to assign each quality attributes level. These estimates will be feed to BBN to determine the probability of having high quality information. Some of quality characteristics like relevance and interpretability are judged qualitatively while some others like ease of use are decided quantitatively. As an example, the quantitative procedure to evaluate ease of use in retrieving a piece of information from eCKiosk is described below.
TABLEI:DEFINITIONS OF DATA QUALITY ATTITUDES
Data Quality Attitude
Definition
Validity How much compatible with reality Completeness To be Representative of target population Accuracy Errorless
Consistency Identical collection procedure for whole data Timeliness Appropriate Frequency of updating Accessibility Ease of use
Relevance The extent to which data matches with needs Interpretability Understandable for the user
Transparency Traceable acquisition procedure
Fig. 3. The information quality questionnaire
VI. EVALUATING “EASE-OF-USE”
Human brain’s response improves by responding to repeated stimuli. Time Reduction with each trail varies with respect to process complexity [8]. A direct correlation can be established between ease of use and this reduction rate. It means that a larger improvement potential predicted by repeating a simple process while a complex experience will allow only small improvement. Various basic mathematical models for learning curves are: 1) The straight-line power model, 2) the Stanford "B" model, 3) the cubic power model, 4) the piecewise (or stepwise) model, and 5) the exponential model. For its simplicity power law function that assumes constant learning rate through the activity duration was used in form (2).
a i
ca Tx
T = 1 −
(2)
where: Tcais cumulative average time per unit, T1 is first
cycle time, xiis cycle number, and a represents a constant that mirrors the complexity of the work;
Learning rate can be calculated using (3). As described, it can be used as a measure to evaluate ease of use. To have a better terminology from now on progress index will be used instead of learning rate.
) ( Pr
2−a = ogressIndex PI
(3)
Following paragraph, describes the procedure used to evaluate progress index for eCKiosk information retrieval. On the basis of predicted benefits a scenario was designed with the aim of evaluating information accessibility. An examinee was asked to use the eCKiosk to a) retrieve a piece of information, b) communicate to ask for complementary information and to report progress, c) save modification done and d) register his/her gained knowledge/experience in a text format. In the case of system operation assessment, information flow during a two-way slab reinforcement bar (rebar) placement was simulated. Whole project’s designs including tables and drawings were available in central database. Specifications were documented regarding each concrete component feature [9]. For example required information could be found through Concrete ComponentsÆ
Floor system Æ Slabs Æ Two-way Æ Individual Slab’s Designs. In each experiment a slab was selected randomly and the user was asked to focus on that slab. In designed scenario the user needs to find required rebar information including rebar size, length, and number of required pieces, placement pattern and specific prefabricated bundle the rebar should be picked from. During the placement the operator suspected a bundle degree of corrosion, which leads to a
multimodal communication to quality manager to get the approval before placement. At the end of placement the user report progress filling related excel tables. All mentioned information plus rebar sequential placement and weather condition was recorded in predefined as-it-was-built format. Finally valuable gained knowledge regarding different rebar placement plans according to features of rebar and concrete components and subcomponents was recorded. As explained each run consisted of five stages: 1) information retrieval, 2) quality approval communication, 3) progress report, 4) creating as-it-was-built and 5) knowledge recording. Time study results are summarized in Table II.
TABLEII:RESULTS OF EASE OF USE EVALUATION EXPERIMENTS
As shown in Fig. 5 all data points fell between 85 and 90% progress index. The best fitted trendline is:
214 . 0 6 . 562 −
= i
ca x
T (4) Using a=0.214 , progress index equals 86% which describes the percentage of reduction in total time between two cycle numbers which differ by a factor of 2. Calculated progress index assures fast competence achieving in working with the information through the eCKiosk. Oglesby and Parker [10] indicated that common range of progress index for most of construction tasks falls between 70% and 90%.
Fig. 5. Learning curve of system use
Given this fact, observed progress index places among the acceptable processes to perform. This preliminary laboratory
test can be completed with actual field measurements where harsh ambient may influence user capabilities. Actually experiments observed how fast a user got adapted to communicate with this information system using kiosk interface. It’s predicted that dust, noise, working in height, work force, fatigue and ambient temperature will affect both user preciseness and hardware functionality. Negligible faulty data entry ratio can be caused by controlled laboratory condition instead of meaning an errorless data entry method.
VII. APPLICATION EXAMPLE
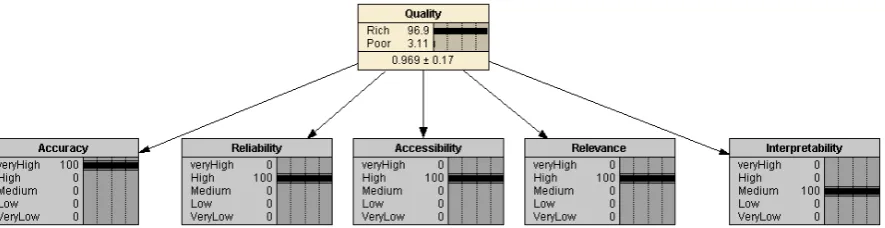
In order to demonstrate BBN capability in evaluating InQ, a set of random numbers was used to train BBN. Then user estimates of quality attitudes were feed into BBN. With random training probabilities and estimated quality attributes, the information provided by eCKiosk -with 97% probability- is rich in quality (Fig. 6).
VIII. SUMMARY AND CONCLUSION
Communication plays a key role in dynamic and large scale projects. However, conventional paper-based information flow is not capable of coping with complex, uncertain and fast track construction processes. As a consequence, there is a need for easy-to-use, reliable and fast means of communication. Based on its capabilities, field-level ICT application in the construction promises an integrated information dissemination system to add extra value to current practice.
This paper discussed how the well known Bayesian Belief Network provides a solid approach to develop a framework to measure the evolving quality of process related information. Using data retrieval from an eCKiosk, the authors demonstrated how to implement it. In this example, quality was considered as the level of user satisfaction in working with information.
Diagnostic inference implementing trained BBN was able to determine the confidence level about the quality of communicated information. To calculated diagnostic inference, some quality attributes were estimated qualitatively while the rest were calculated quantitatively. Indeed learning theory was applied to quantify the “ease of use” of provided information via eCKiosk. A progress index, quantifying the speed of learning how to operate the eCKiosk, was assessed at 86% which suggests an easy application. In summary, the test of the BBN showed that it could provide a solid foundation for assessing the quality of electronically communicated information at construction filed level.
REFERENCES
[1] T. Williams, L. E. Bernold, and H. Lu, “Adoption patterns of advanced information technologies in the construction industries of United States and Korea.” J. Constr. Eng. Manage., vol. 133, no. 10, pp. 780-790, 2007.
[2] J. W. Garrett and J. Teizer, “Hu,an factors analysis classification system relating to human error awareness taxanomy in constrvution safety,” J. Constr. Eng. Manage., vol. 135, no. 8, pp. 754–763, 2009. [3] P. Trompf, “Another brick in the wall: reasponses of the state to
workforce fatalities in the New South wales construction industry,” Ph.D. dissertation, Business School, Unisyd., Sydney, NSW, 2012. [4] I. Shohet and S. Frydman, “Communication patterns in construction at
construction manager level,” J. Constr. Eng. Manage., vol. 129, no. 5, pp. 570–577, 2003.
[5] P. R. Zekavat and L. E. Bernold, “Mobile electronic site kiosk for construction,” in Proc. the 37th AUBEA. Conf., Sydney, 2012, pp.
575-583.
[6] L. E. Bernold and S. AbouRizk, Managing Performance in Construction, 1st ed. Hoboken, New Jersey., USA.: Wiley, 2010, ch. 3, pp. 82.
[7] I. Ben-Gal, Bayesian Networkin Ruggeri F., Faltin F. & Kenett R., Encyclopedia of Statistics in Quality & Reliability, Wiley & Sons, 2007.
[8] M. Miller and L. E. Bernold, “Sensor‐integrated nailing for building construction,” J. Constr. Eng. Manage., vol. 117, no. 2, pp. 213–225, 1991.
[9] L. E. Bernold and M. Salim, “Placement-oriented design and delivery of concrete reinforcement,” Journal of Construction Engineering and Management, vol. 119, no. 2, pp. 323-335, 1993.
[10] C. H. Oglesby and H. W. Parker, Productivity Improvement in Construction, New York, USA: McGraw-Hill, 1989.
Payam R. Zekavat was born in Tehrarn , 1983. He got his bachelor degree in civil engineering from Sharif University of Technology at Tehran, Iran in 2006. He got his master of science in hydraulic structurs engineering from the same univesity in 2009.
He has lectured different courses in few undergrad programs . He is persuing his PhD study in construction manegement and engineering in University of New South Wales at Sydney, Australia. His main research intrest is information flow in construction field-level.
Mr. Zekavat has published papers regarding IT application, and education in the construction.
Leonhard E. Bernold was born in Switzerland but immigrated to USA in 1982. He got MBA from University of St. Gall (Switzerland), MS in Industrial Management and Ph.D. in Civil Engineering from Georgia Institute of Technology, Atlanta, GA.
He was a professor at the University of Maryland (5 years), North Carolina State University (16 years), Hanyang University-Korea (2.5 years) and since 2011 at UNSW-Australia. He also was founding director of Construction Automation Robotics Lab and the Buried Utility Detection Consortium at North Carolina State University.
![Fig. 1. Model of Two-Way Communication [6]](https://thumb-us.123doks.com/thumbv2/123dok_us/1363152.1645658/2.595.68.282.324.530/fig-model-way-communication.webp)