capacity spectrum graph is plotted for push x and push y from where performance point is found for each building for 15 storey building and is located in seismic zone five using sap2000 software.
The graph is plotted shear force vs. shape of building, displacement vs. shape of building, spectral displacement vs. shape of building and spectral acceleration vs. shape of building and from this the best shape of building is evaluated.
IndexTerms–Pushover Analysis, Capacity Curve, Displacement, Acceleration, Base Shear.
I. INTRODUCTION
Pushover analysis is an approximate analysis method in which the structure is subjected to monotonically increasing lateral forces with an invariant height-wise distribution until a target displacement is reached. Pushover analysis consists of a series of sequential elastic analysis, superimposed to approximate a force-displacement curve of the overall structure.
II. OBJECTIVE
The main objective of the study is to determine the performance point and capacity curve of different shape building.
III. PUSHOVER ANALYSIS METHODOLOGY IN SAP2000
The ATC 40 provides detailed guidelines about how to perform a nonlinear static pushover analysis. The most important parts of this method are the construction of the Capacity Spectrum and the design Response Spectra and finding of the point of intersection of the capacity and the response spectra [1]. The intersection defines the performance level of thestructure for the design earthquake. The following procedure is based on the ATC 40.
Make the 3D model of different shape in sap 2000 Assign all the properties and load on slab
Assign hinge properties (Beams – Default M3) and (Column – Default PM2M3) [1] Give load cases with the pushover load in X and Y direction (Push X and Push Y) [6] After Checking all the loads and properties Run the analysis
Check the deformed shape of the structure in push x and push y loads, also observe the hinge formed on beam and column
Compare the capacity curve of base shear and displacement due to push x and push y.
IV.STRUCTURAL MODELING AND ANALYSIS
Table 1 Structural Data
Type of building Educational building
Number of storey 15
Floor height 4 m
Floor area 900 m2
Slab thickness 200 mm
Column size 700x700 mm
Beam size 350x450 mm
Each Bay Length 6m
Wall thickness 300mm and 200mm
Grade of concrete M25
Steel Fe415
Live load 5kN/m2
Floor finish 1kN/m2
Seismic zone Five [6]
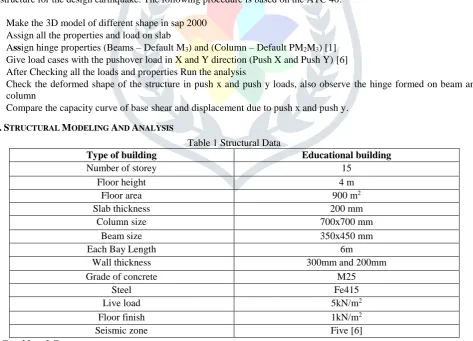
4.1Considered Geometry
Figure 1Rectangular shapeFigure 2H shapeFigure 3 Plus shape
Figure 4 Square shape Figure 5T shapeFigure 6 L shape
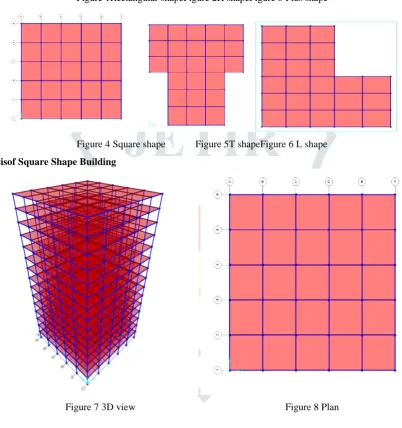
4.2 Analysisof Square Shape Building
Figure9 Hinges form Push X Figure 10 Hinges form Push Y
4.3 Performance Pointand Capacity Curve
Figure 12 Capacity Curve for Push Y
V.GRAPHICAL REPRESENTATION
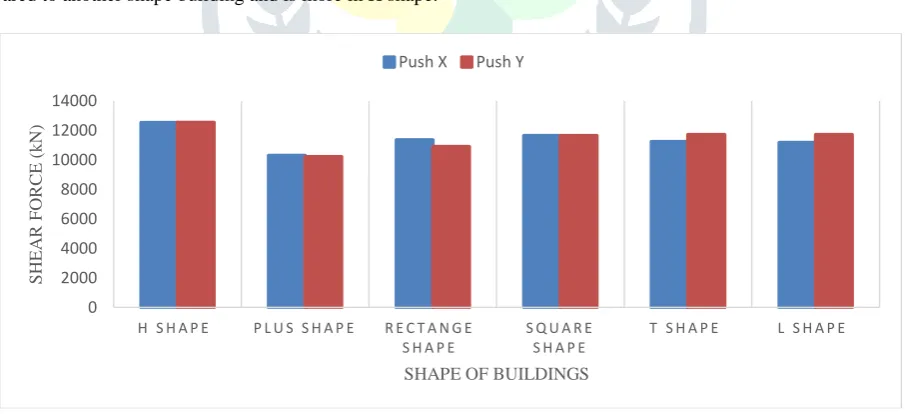
5.1 Comparisonof Shear Force
The performance point in different shape of building such as square shape, rectangular shape, L shape, T shape, H shape, plus shape and C shape has been found from sap2000 software of shear force and graph is plotted shear force vs. shape of building for push x and push y as shown as bellow. While comparing of shear force in plus shape of building is less compared to another shape building and is more in H shape.
Figure 13 Graph of Comparison of Shear Force
5.2 Comparison of Displacement
0 2000 4000 6000 8000 10000 12000 14000
H S H A P E P L U S S H A P E R E C T A N G E
S H A P E
S Q U A R E S H A P E
T S H A P E L S H A P E
S
HEA
R
F
ORCE
(k
N)
SHAPE OF BUILDINGS
Figure 14 Graph of Comparison of Displacement
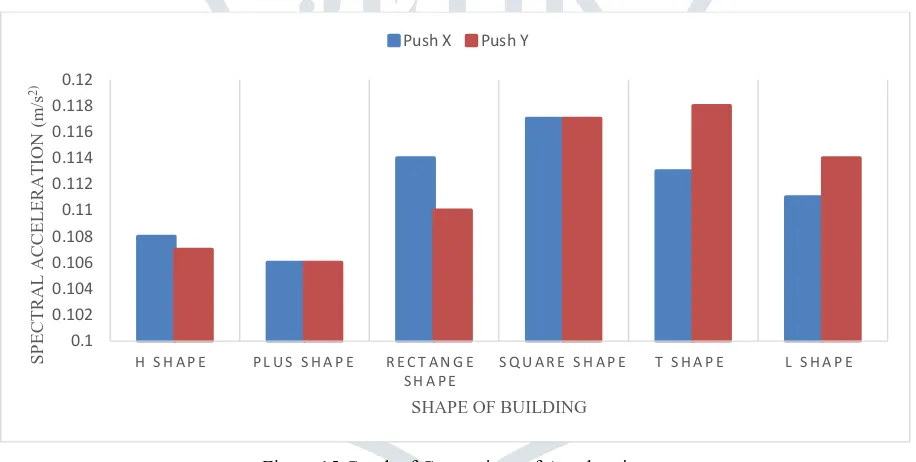
5.3 Comparison of Spectral Acceleration
The performance point in different shape of building such as square shape, rectangular shape, L shape, T shape, H shape, plus shape and C shape has been found from sap2000 software for spectral acceleration and bar graph is plotted for spectral acceleration vs. shape of building for push x and push y as shown as bellow. While comparing the spectral acceleration in plus shape of building is less compared to another shape building and is more in T shape.
Figure 15 Graph of Comparison of Acceleration
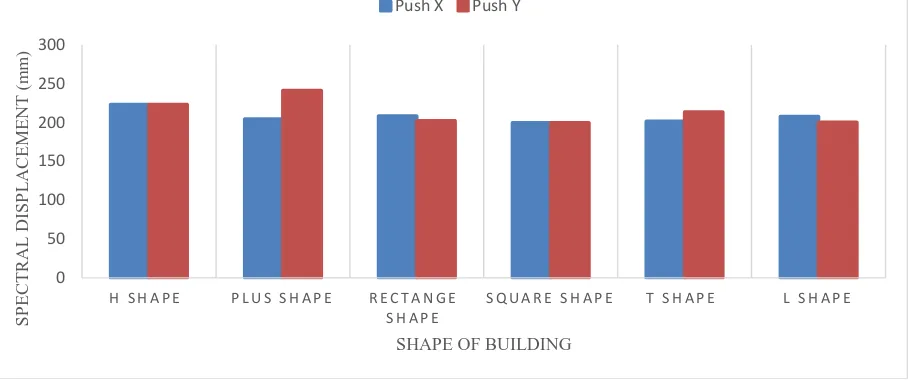
5.4 Comparison of Spectral Displacement
The performance point in different shape of building such as square shape, rectangular shape, L shape, T shape, H shape, plus shape and C shape has been found from sap2000 software of spectral displacement and bargraph is plotted spectral displacement vs. shape of building for push x and push y as shown as bellow. While comparing the spectral displacement in square shape of building is less compared to another shape building and is more in plus shape.
H S H A P E P L U S S H A P E R E C T A N G E
S H A P E
S Q U A R E S H A P E T S H A P E L S H A P E
SHAPE OF BUILDING
0.1 0.102 0.104 0.106 0.108 0.11 0.112 0.114 0.116 0.118 0.12
H S H A P E P L U S S H A P E R E C T A N G E
S H A P E
S Q U A R E S H A P E T S H A P E L S H A P E
S P ECT RA L A CCEL ERA T ION ( m /s 2 )
SHAPE OF BUILDING
Figure 16 Graph of Comparison of Displacement
VI.CONCLUSIONS
The pushover analysis the H shape has high shear capacity and plus shape has least shear capacity for both push x and push y.
The design displacement in H shape is high and least in square shape for both push x and push y.
The design spectral acceleration is high in T shape and least in plus shape for push y and it is high in square shape and least in plus shape for push x.
The design spectral displacement is high in plus shape and least in square shape for push y and it is high in H shape and least in square shape for push x and it is high in H shape and least in square shape for both push x and push y. The square shape building takes maximum shear force at minimum displacement and damping ratio is also less at
performance point than all the other shapes So, we should prefer the square shape building.
REFERENCES
[1] ATC, Seismic evaluation and retrofit of concrete buildings, 1996, Volume 1, ATC-40 Report, Applied Technology Council, Redwood City, California.
[2] Mahaney J A., Paret, T.F., Kehoe, B.E, and Freeman, S.A., “The capacity spectrum method for evaluating structural response during the Loma Prieta earthquake.”, 1993, Proc., 1993 Nat. earthquake Conf., Central U.S. Earthquake Consortium, Memphis, Tenn., 2, 501-510.
[3] IS 456: 1978 Code of practice for plain and reinforced concrete Indian Standards, New Delhi.
[4] IS 13920:1993 Code of practice for ductile detailing of reinforced concrete structures subjected to seismic forces Indian Standards, New Delhi.
[5] Habibullah. A, SAP2000 Manual (Version 7.44), Three dimensional static and dynamic analysis and design of structures, Computers and Structures, Inc. Berkeley, USA
[6] IS 1893 (Part 1):2002 Criteria for earthquake resistant design of structures (Fifth Revision) Indian Standards, New Delhi.
[7] ACI Committee 318 (1989) Building code requirements for reinforced concrete (ACI 318-89), ACI, Detroit.
0 50 100 150 200 250 300
H S H A P E P L U S S H A P E R E C T A N G E
S H A P E
S Q U A R E S H A P E T S H A P E L S H A P E
S P ECT RA L DISP L A CEM ENT ( mm )
SHAPE OF BUILDING