O R I G I N A L R E S E A R C H
External Validation Of The Surgical Mortality
Probability Model (S-MPM) In Patients Undergoing
Non-Cardiac Surgery
This article was published in the following Dove Press journal: Therapeutics and Clinical Risk Management
Sebastian Kazimierczak 1
Anita Rybicka 2
Jochen Strauss1
Malgorzata Schram3
Arkadiusz Kazimierczak 4
Elżbieta Grochans 2
1Anesthesiology, Perioperative Care and Pain Therapy Department, HELIOS Hospital, Berlin-Buch, Germany; 2Department of Nursing, Faculty of Health Sciences, Pomeranian Medical University, Szczecin, Poland; 3Department of Anesthesiology and Intensive Care Medicine, Evangelisch-Freikirchliches Krankenhaus Bernau, Bernau Bei Berlin, Germany;4Vascular Surgery Department of Pomeranian Medical University, Szczecin, Poland
Background:Preoperative risk assessment is a key issue in the process of patient
prepara-tion for surgery and the control of quality improvement in health care and certification
programs. Hence, there is a need for a prognostic tool, whose usefulness can be assessed only after validation in the center other than the home one. The aim of the study was to validate the Surgical Mortality Probability Model (S-MPM) for detecting deaths and complications in patients undergoing non-cardiac surgery and to assess its suitability for various surgical disciplines.
Methods: This retrospective study involved 38,555 adult patients undergoing non-cardiac
surgery in a single center in 2012–2015. The observation period concerned in-hospital mortality.
Results: In-hospital mortality for the total population was 0.89%. Mortality in the S-MPM I class amounted to 0.26%, S-MPM II 2.51%, and in the S-MPM III class 22.14%. This result was in line with those obtained by the authors. The discriminatory power for in-hospital mortality was
good (area under curve (AUC) = 0.852, 95% CI: 0.834–0.869, p = 0.0000). The scale was the
most accurate in general surgery (AUC = 0.89, 95% CI: 0.858–0.922) and trauma (AUC = 0.89;
95% CI: 0.87–0.915). In the logistic regression analysis, the scale showed a perfectfit/goodness
offit in the cross-validation method (v-fold cross-validation): Hosmer–Lemeshow (HL) = 7.945;
p = 0.159. This result was confirmed by the traditional derivation and validation data set method
(1:3; 9712 vs 22.748 cases): HL test = 3.073 (p = 0.546) in the teaching derivation data set and 10.77 (p = 0.029) in the test sample (validation data set).
Conclusion:The S-MPM scale by Glance et al has proven to be a useful tool to assess the risk of in-hospital death and can be taken into account when considering treatment indica-tions, patient information, planning post-operative care, and quality control.
Keywords:S-MPM, early mortality, in-hospital mortality, ASA, RCRI
Introduction
The effectiveness of quality improvement programs in healthcare and certification systems must be monitored regularly. This requires continuous monitoring of the results of surgical treatment and is the basis for pay-for-performancefinancing.1In order to compare the results of treatment (mortality, complications) between cen-ters, we need to know the exact anticipated risk that arises from the patient’s burden of accompanying diseases.
Tools for evaluating this risk must be accurate, easy to use, and be able to be used without a computer.2,3The scale of risk is considered to be effective if it has good discriminatory power (the ability to properly qualify the patient to one of the
Correspondence: Anita Rybicka Department of Nursing, Faculty of Health Sciences, Pomeranian Medical University, ul.Żołnierska 48, Szczecin 71-210, Poland Tel +48 91 48 00 910
Fax +48 91 48 00 905 Email anita.rybicka@pum.edu.pl
Therapeutics and Clinical Risk Management
Dove
press
open access to scientific and medical research
Open Access Full Text Article
Therapeutics and Clinical Risk Management downloaded from https://www.dovepress.com/ by 118.70.13.36 on 27-Aug-2020
risk groups), good calibration (matching the expected results to those observed), and is independent of the user experience.
It is important that prior to the implementation of the practice the given scale should be validated in the external environment, because the prognostic properties of any scale are best in the population on which the scale was designed (derivation group) and do not need to be
con-firmed when these scales are applied to a new population or in another resort.2
The current European Society of Cardiology/European Society of Anesthesiology (ESC/ESA) 2014 guidelines recommend two risk scales: the Surgery Risk Calculator of the American College of Surgeons-National Surgical Quality Improvement Program (ACS-NSQIP) and the Revised Cardiac Risk Index (RCRI).4 On the one hand, we have an exact, but complicated (35 variables required for calculation) ACS-NSQIP, on the other-RCRI-ineffec-tive in predicting general mortality, because only about 45% of the deaths are caused by cardiac causes.5
The authors of the Surgical Mortality Probability Model (S-MPM) attempted to realign the risk assessment before each operation in a situation of limited time,fi nan-cial and personnel resources. It contains in a simplified form the two most important risk components―patient risk and operational risk. Glance et al emphasizes that the purpose of his work was to create a simplified alter-native to the NSQIP calculator, not to replace it.6 The population, on the basis of which the S-MPM scale was created, constituted 298,772 patients operated on in more than 200 hospitals participating in the NSQIP program in the USA. According to the information available to the author, the S-MPM scale has not yet been validated in the external center.
Aim
The aim of the study was to validate the S-MPM scale in detecting deaths and complications in patients undergoing non-cardiac surgery and its suitability for various surgical disciplines.
Materials And Methods
It is a retrospective analysis of data routinely registered in hospital database with compliance of EU GDPR (eng) – European Union General Data Protection Regulation; there-fore, it does not need additional approval of Bioethical Comity. The data come from a single high reference center with an average annual plan of 30,000 operations undergoing
non-cardiac surgery over a period of 3 years. There were no any exclusion criteria. One hundred and thirty variables for each patient were collected by clinicians using the hospital information system, including interview data (concomitant diseases, risk factors, physical performance, functional status) and basic research. The observed event was in-hospital mortality.
In the case of ophthalmology, pediatric surgery, and urogynecology, no hospital-related deaths were recorded.
For validation, we have used original S-MPM devel-oped by Glance et al, which is a 9-point 30-day mortality risk index. It includes three risk factors: American Society of Anesthesiologists (ASA) physical status (PS), surgery risk class and emergency status. Patients with ASA PSI, II, III, IV, or V were assigned either 0, 2, 4, 5, or 6 points, respectively. Intermediate or high-risk procedures were assigned 1 or 2 points, respectively. Emergency procedures were assigned 1 point. Patients with risk scores less than 5 had a predicted risk of mortality less than 0.5%, whereas patients with a risk score of 5 to 6 had a risk of mortality between 1.5% and 4.0%. Patients with a risk score greater than 6 had a risk of mortality more than 10%.
All our data needed to complete the S-MPM model were the subsequently subject to statistical analysis.
Statistical Analysis
The data were analyzed using the Statistica 12 program. To determine the impact of individual components of the S-MPM scale on in-hospital mortality, a stepwise regres-sion model (unadjusted and adjusted odds ratio [OR]) was used to integrate the data into the model using the reference coding method. The discriminatory scale of the scale was evaluated using the AUC analysis, C-statistic for the entire study group and for individual treatment disciplines. The validation was performed by dividing the test group into a computational and validation (derivation and validation data set) using the validation method (v-fold cross-validation) and traditionally (1:3), the Hosmer–Lemeshow test (goodness of fit) and graphically. In addition, the expected mortality was compared based on the original work of Glance et al with observed mortality.
Results
The data cover 38,559 patients over 17 years of age (Table 1). The data refer to eleven treatment disciplines (Table 2). A total of 6080 patients were excluded from the study due to missing data necessary to calculate the S-MPM score.
Therapeutics and Clinical Risk Management downloaded from https://www.dovepress.com/ by 118.70.13.36 on 27-Aug-2020
The group included 49.5% women and 50.5% men. The average age of patients was 55 years with an inter-quartile range (IR) between 33 and 69 years, with the average age of women being 49, men being 50 years old. As high as 17.5% of the cases were declared as urgent. Almost half of the treatments were classified as low-risk operations, 30% of medium risk and 20% of high risk. In-hospital mortality in the total population was 0.89%. The average time of hospitalization among people who died was 26 days (95% CI: 23.7–28.3/min 1 day to max 101 days/median: 21 days).
Demographic data are presented inTables 3and4. In the ASA I class, in-hospital mortality rate was 0.04%, in the ASA II class 0.25%, in the ASA III class 2.01%, in the ASA IV class 13.74, and in the ASA V class 40.9%. In-hospital mortality in class I S-MPM was 0.26%,
Table 1Numbers In Risk Groups (0–9) And Risk Classes (I–III) S-MPM
S-MPM Groups
n (%) S-MPM Class n (%)
0 7472 (23%) I (0–4 points) 25,756 (79.3%)
1 2576 (7.9%)
2 6541 (20.1%)
3 5221 (16.1%)
4 3946 (12.4%)
5 3181 (9.8%) II (5–6 points) 6452 (19.86%)
6 3271 (10.1%)
7 225 (0.7%) III (7–9 points) 271 (0.83%)
8 42 (0.13%)
9 4 (0.012%)
Total 32,191 (100%)
Table 2Distribution Of Cases In Individual Treatment Disciplines
Surgical Discipline (n) % Of Total Population
Traumatology 4802 14.80
Orthopedics 3460 10.65
Neurosurgery 2470 7.60
Gynecology 4285 13.19
Vascular surgery 2111 6.50 Visceral surgery 4642 14.30
Urology 4194 12.90
Pediatric surgery (>17 years) 462 1.40
Laryngology 4021 12.38
Ophthalmology 938 2.89
Urogynecology 595 1.83
Dermatosurgery 499 1.54
Total 32,479 100%
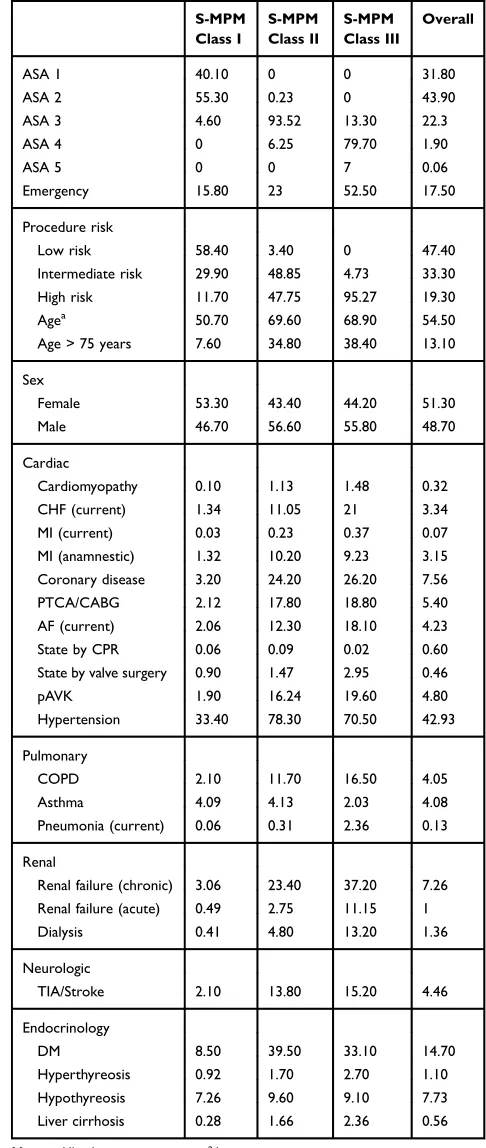
Table 3Demographic Data And Risk Factors Of The Studied Population
S-MPM Class I
S-MPM Class II
S-MPM Class III
Overall
ASA 1 40.10 0 0 31.80
ASA 2 55.30 0.23 0 43.90
ASA 3 4.60 93.52 13.30 22.3
ASA 4 0 6.25 79.70 1.90
ASA 5 0 0 7 0.06
Emergency 15.80 23 52.50 17.50
Procedure risk
Low risk 58.40 3.40 0 47.40
Intermediate risk 29.90 48.85 4.73 33.30
High risk 11.70 47.75 95.27 19.30
Agea 50.70 69.60 68.90 54.50
Age > 75 years 7.60 34.80 38.40 13.10
Sex
Female 53.30 43.40 44.20 51.30
Male 46.70 56.60 55.80 48.70
Cardiac
Cardiomyopathy 0.10 1.13 1.48 0.32
CHF (current) 1.34 11.05 21 3.34
MI (current) 0.03 0.23 0.37 0.07
MI (anamnestic) 1.32 10.20 9.23 3.15 Coronary disease 3.20 24.20 26.20 7.56
PTCA/CABG 2.12 17.80 18.80 5.40
AF (current) 2.06 12.30 18.10 4.23
State by CPR 0.06 0.09 0.02 0.60
State by valve surgery 0.90 1.47 2.95 0.46
pAVK 1.90 16.24 19.60 4.80
Hypertension 33.40 78.30 70.50 42.93
Pulmonary
COPD 2.10 11.70 16.50 4.05
Asthma 4.09 4.13 2.03 4.08
Pneumonia (current) 0.06 0.31 2.36 0.13
Renal
Renal failure (chronic) 3.06 23.40 37.20 7.26 Renal failure (acute) 0.49 2.75 11.15 1
Dialysis 0.41 4.80 13.20 1.36
Neurologic
TIA/Stroke 2.10 13.80 15.20 4.46
Endocrinology
DM 8.50 39.50 33.10 14.70
Hyperthyreosis 0.92 1.70 2.70 1.10 Hypothyreosis 7.26 9.60 9.10 7.73 Liver cirrhosis 0.28 1.66 2.36 0.56
Notes:All values in percentages.aAverage.
Abbreviations:CHF, congestive heart failure; MI, myocardial infarction; AF, atrial fibrillation; CPR, cardio-pulmonary resuscitation; PAD, peripheral artery disease; DM, type 2 diabetes mellitus (IDDM, insulin-dependent diabetes mellitus and NIDDM, non-insulin-dependent diabetes mellitus); liver cirrhosis, cirrhosis of any child-pugh level; COPD, chronic obstructive pulmonary disease; PTCA, percutaneous transluminal cor-onary angioplasty; CABG, corcor-onary artery bypass graft; TIA, transient ischemic attack.
Therapeutics and Clinical Risk Management downloaded from https://www.dovepress.com/ by 118.70.13.36 on 27-Aug-2020
in class II S-MPM 2.51%, and in class III S-MPM 22.14%. It was therefore in the ranges proposed in the original work Glance et al.6
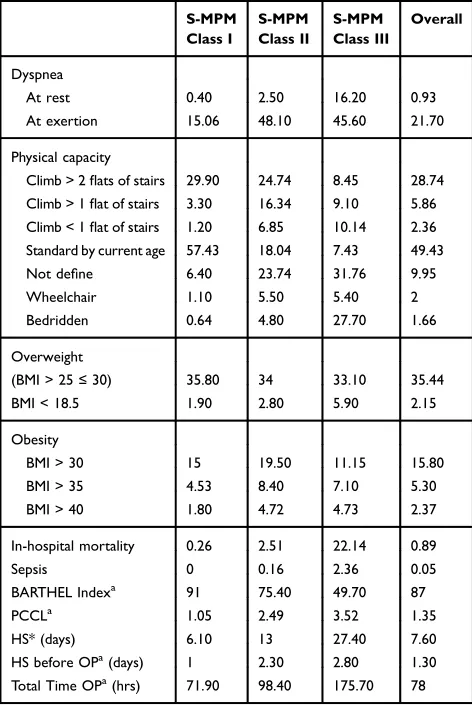
The resting dyspnea was 0.4% of the patients in class I S-MPM, 2.5% in class II S-MPM, and 16.2% in class S-MPM III. Good physical capacity, understood as the ability to enter the secondfloor without interruption, had 30% of the patients in class I, 25% in class II, and 8.5% of the patients in class III S-MPM. The patient clinical complexity level (PCCL) was on average 1.05 in class I, 2.49 in class II, and 3.52 in class III S-MPM.
Using independent variables needed to build the S-MPM model, we made our own logistic regression analysis. The obtained regression coefficients slightly differed from those estimated by Glance et al (our own log relative for ASA 2 = 1.65 vs 2.009 in Glance et al, our own logistic co-operation for urgent surgery = 1.1 vs 0.934 in Glance et al).
Only the operational risk ratios differed significantly from those proposed by the authors of S-MPM (our own logis-tical co-operation for medium-risk operations = 0.79 vs 1.25 in Glance et al and for high-risk operations = 0.91 vs 2.06 in Glance et al) (Table 5).
The ASA V class was excluded from further analysis. This is due to the fact that the presence of this class caused a mathematical error in the estimation procedure due to the incorrect distribution of the variable (small group size). The validation was performed using the cross-validation (v-fold cross-validation) method. The scale has shown a good fit/ goodness of fit/- H–L (Hosmer–Lemeshow) = 7.945; p = 0.159 (Table 6).
This result was confirmed in the second method, in which the test group was divided into a teaching and a test sample 1:3 (9712 vs 22,748 cases). The H–L test was 3.073 (p = 0.546) in the training sample and 10.77 (p = 0.029) in the test sample. This result is even better than that obtained by the authors of the S-MPM (teaching test: H–L = 5.53, p = 0.35 and test: H–L = 13.0, p = 0.023).
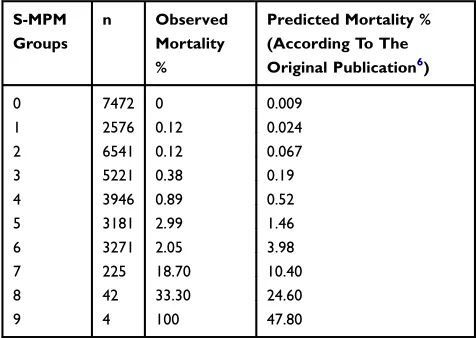
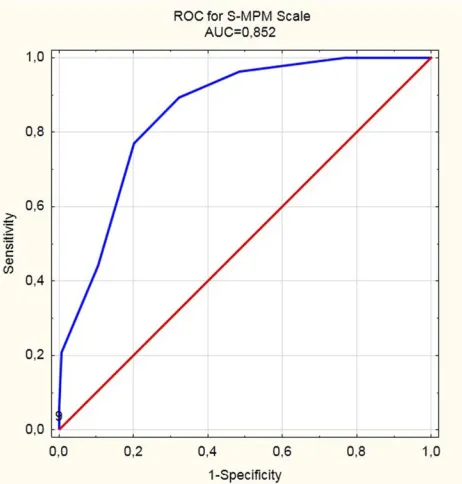
The Statistica program automatically divides the test sample into six subgroups with a similar level of risk of an event (in this case death). For each of the subgroups, the expected risk is calculated separately. The next step is comparing it with the observed risk. It should be noted that in the case of very large populations, even small differences can reach the level of statistical significance and erroneously suggest a poorfit of the model (Table 7).7 The S-MPM scale showed a good discriminatory power of in-hospital mortality in ROC (receiver operating charac-teristics) analysis in the whole study group. The AUC was 0.852 (95% CI: 0.834–0.869); p = 0.00001 (Figure 1).
The analysis of the usefulness of the S-MPM scale in individual surgical disciplines showed the best discrimina-tory force (ROC) in general and traumatic surgery (Table 8). Due to the highest number of treatments for vascular, general and traumatic surgery as well as significant differ-ences in mortality and logistics of hospital work organiza-tion, the results are presented separately (Figure 2).
Discussion
S-MPM And Other Scores
Our results confirm the S-MPM scale is the most accurate in general surgery and trauma (with high AUC=0.852) and showed a perfect fit/goodness in H–L test. Moreover, simplicity of S=MPM score is beneficial compared to other available and recommended tools.
Table 4 Demographic Data And Risk Factors Of The Studied Population
S-MPM Class I
S-MPM Class II
S-MPM Class III
Overall
Dyspnea
At rest 0.40 2.50 16.20 0.93
At exertion 15.06 48.10 45.60 21.70
Physical capacity
Climb > 2flats of stairs 29.90 24.74 8.45 28.74 Climb > 1flat of stairs 3.30 16.34 9.10 5.86 Climb < 1flat of stairs 1.20 6.85 10.14 2.36 Standard by current age 57.43 18.04 7.43 49.43 Not define 6.40 23.74 31.76 9.95
Wheelchair 1.10 5.50 5.40 2
Bedridden 0.64 4.80 27.70 1.66
Overweight
(BMI > 25≤30) 35.80 34 33.10 35.44
BMI < 18.5 1.90 2.80 5.90 2.15
Obesity
BMI > 30 15 19.50 11.15 15.80
BMI > 35 4.53 8.40 7.10 5.30
BMI > 40 1.80 4.72 4.73 2.37
In-hospital mortality 0.26 2.51 22.14 0.89
Sepsis 0 0.16 2.36 0.05
BARTHEL Indexa 91 75.40 49.70 87
PCCLa 1.05 2.49 3.52 1.35
HS* (days) 6.10 13 27.40 7.60
HS before OPa(days) 1 2.30 2.80 1.30 Total Time OPa(hrs) 71.90 98.40 175.70 78
Notes:All the percentages.a
Average. Enter > 2 p.―patient enters the 2ndfloor without interruption.
Abbreviations:PCCL, patient clinical complexity level; HS, hospital stay; HS before OP, hospital stay before operation; Total Time OP, total time of durations of operations.
Therapeutics and Clinical Risk Management downloaded from https://www.dovepress.com/ by 118.70.13.36 on 27-Aug-2020
Recommended, among others by ESA Guidelines NSQIP Surgical Risk Calculator was created at a huge cost, based on a group of over 1,400,000 patients and almost 400 hospitals included in the ACS-NSQIP.4It has an excellent discriminatory power in predicting the risk of death within 30 days of surgery (AUC = 0.944) and the
risk of typical surgical complications (AUC = 0.816).8 However, it should be remembered that the additional cost of running an NSQIP system for a participating hos-pital is estimated at $ 100,000 per year.1
Despite the costs of participation in the program, in net settlement, it brings measurable savings. Apart from the eco-nomic aspect, participation in the NSQIP program, according to the authors, means a significant reduction in complications and mortality (250–500 complications annually and 12–36 deaths less) (Source:https://www.facs.org/).
On the other hand, only 3% of the total number of hospitals in the US decides to participate in this program. The reason is the time and costs of collecting data neces-sary to calculate the risk using the NSQIP calculator.1,6
In a comprehensive meta-analysis from 2013, Moonesinghe et al analyzed 27 publications presenting 35 different risk scales from the last 30 years. Most of them are multi-centrally validated studies. Due to lack of methodology, the authors rejected further 1100 publications.3 Statistically, more than one new scoring system appears each year. The authors of the meta-analysis conclude that it is unlikely that highly precise but also complicated (>30 variables) calculators would be preferred by clinicians. From their experience, scales of similar effectiveness, but simple and adapted to be used at bed-side, have a better chance of being implemented in every-day practice.3
Despite the advantages of excellent accuracy and ver-satility, the use of the NSQIP SRC calculator takes too much time in the situation of staff limitations and the
Table 5Logistic Regression Results For S-MPM Scale Components
Reg. Coefficient Crude OR Adj. OR 95% CI adj. OR p
ASA
I Reference 1 Reference
II 1.65 5.15 5.23 2.05–13.33 0.001
III 3.45 40.16 31.50 12.8–77.20 <0.001
IV 5.33 324.34 206.70 83-514.80 <0.001
V - - - -
-Procedure risk
Low Reference 1 Reference
Intermediate 0.79 4.12 2.21 1.60–3.00 <0.001
High 0.91 5.14 2.50 1.75–3.54 <0.001
Emergency
Nonemergent Reference 1 Reference
Emergent 1.10 4.89 2.99 2.32–3.85 <0.001
Abbreviations:Crude OR, odds ratio in univariate regression analysis; adj. OR, odds ratio after adjustment relative to the rest of explanatory variables in the multivariate regression analysis; 95% CI, 95% confidence interval; Reference, benchmark in the dummy coding method for logistic regression.
Table 6Deaths Observed Vs Predicted In The H–L Test
H-L Test Groups
n Total
n Observed Mortality
n Predicted Mortality
1 6724 0 2
2 9388 6 10
3 5370 18 14
4 4234 22 24
5 3423 52 48
6 3321 183 183
Table 7Deaths Observed Vs Predicted In S-MPM Risk Groups
S-MPM Groups
n Observed
Mortality %
Predicted Mortality % (According To The Original Publication6)
0 7472 0 0.009
1 2576 0.12 0.024
2 6541 0.12 0.067
3 5221 0.38 0.19
4 3946 0.89 0.52
5 3181 2.99 1.46
6 3271 2.05 3.98
7 225 18.70 10.40
8 42 33.30 24.60
9 4 100 47.80
Therapeutics and Clinical Risk Management downloaded from https://www.dovepress.com/ by 118.70.13.36 on 27-Aug-2020
growing number of operations, especially if our goal is to evaluate each patient before each operation. NSQIP authors have left the possibility of omitting the patient’s risk factors in the calculation, which cannot be verified (difficult interview, no laboratory test results), but in this case, the prediction result may differ from the truth. With a large number of variables (>30), the probability of error grows exponentially. Glance et al tried to solve this pro-blem by bringing the variables required for estimation to a minimum. The S-MPM scale includes the key components of perioperative risk: patient-related risk factors, ASA PS, and operational risk, as the extent and urgency of surgery.
ASA As An Element Of S-MPM Score
It is widely accepted that the ASA classification is not very precise and ambiguous.9,10 It expresses a “good feeling” rather than an objective assessment. However, a “good feeling”can be very precise.11In Hartling et al, the preci-sion of the surgeon’s foreknowledge in the assessment of surgical outcomes proved to have higher sensitivity and specificity than the Physiological and Operative Severity Score for the enUmeration of Mortality and Morbidity (POSSUM) scale including pre- and intraoperative factors (“good feeling”: sensitivity 84.2%, specificity 88.1% vs POSSUM: sensitivity 42.1%, specificity 64.4%).11 This fact may be an answer to the question why the ASA scale correlates well with in-hospital and 30-day mortality, although it has not been designed for this purpose.12,13The discriminating power of the ASA scale against mortality
fluctuated in various studies between AUC = 0.59,14 0.81,150.89,16and 0.93.17In our material, the discriminat-ing power expressed by AUC in the ROC test was AUC = 0.855 (95% CI: 0.834–0.877, p = 0.00001). This result confirms its usefulness in forecasting deaths.
On the ASA PS scale, one patient (eg, the third) receives patients who have both cardiac, pulmonary, and endocrine problems, but also patients who are only bur-dened with one of these diseases. The ASA scale therefore does not guarantee sufficient risk differentiation. The RCRI scale is more precise in this respect, as is the NSQIP calculator recommended in the current ESA/ESC 2014 guidelines.4 On the RCRI scale, the probability of major accident cardiac event (MACE) and death18 increases with the number of risk factors. Despite this, the discriminating power of the RCRI scale is weak in all-cause-mortality forecasting, as only about 30–45% of
Figure 1AUC plot of mortality discrimination for the S-MPM scale.
Table 8AUC Of S-MPM Scale In Individual Surgical Disciplines
Treatment Discipline AUC AUC 95% CI p Mortality n (%) Total n
Ophthalmology — — — 0 938
Visceral surgery 0.890 0.858–0.922 <0.001 73 (1.57) 4642
Traumatology 0.890 0.870–0.915 <0.001 58 (1.20) 4802
Pediatric surgery (>17 years) — — — 0 462
Dermatosurgery 0.612 0.510–0.712 0.029 2 (0.40) 499
Gynecology 0.812 0.733–0.890 <0.001 1 (0.02) 4285
Vascular surgery 0.735 0.677–0.792 <0.001 61(2.89) 2111
Urogynecology — — — 0 659
Laryngology 0.800 0.715–0.877 <0.001 16 (0.39) 4021
Neurosurgery 0.725 0.636–0.815 <0.001 34 (1.38) 2470
Orthopedics 0.800 0.714–0.880 <0.001 23 (0.66) 3460
Urology 0.810 0.753–0.870 <0.001 20 (0.48) 4194
Therapeutics and Clinical Risk Management downloaded from https://www.dovepress.com/ by 118.70.13.36 on 27-Aug-2020
the deaths are due to cardiac reasons.2,19 This was
con-firmed by our own results, where the RCRI scale reached the average discriminatory capacity for in-hospital mortal-ity (AUC = 0.751, 95% CI: 0.015–0.721, p = 0.00001).
Severity Of The Procedure As An
Element Of S-MPM Score
By using the operation code, Glance et al performed a huge statistical work, creating subsets of treatments with similar risks. S-MPM authors have created their own model of empirical approach to data collection and divi-sion of surgical procedures into small, medium, and high risk. These procedures were classified into three categories according to logistic regression coefficients after adjust-ment to ASA PS and urgency of the disease. For this reason, in their work, for example, scout laparotomy has been included in the high-risk group, while it is tradition-ally included in the medium-risk group. In our center, the classification of the severity of surgery is based on the ESC/ESA guidelines, where operations are classified into three groups according to the risk of serious cardiovascular complications and death (<1.1–5, >5%).4This may explain the differences in regression coefficients and OR for operational risk (own companion logic for medium-risk operations = 0.79 vs 1.25 in Glance and for high-risk operations = 0.91 vs 2.06 in Glance/own OR for med-ium-risk operations = 2.21 vs 3.5 u Glance and for high-risk operations = 2.5 vs 7.9 in Glance). For example, liver resection < 3 segments is included in the middle group and >2 segments to the high-risk group. Appendectomy belongs to the group of low operational risk. As the author himself admits, the classification of the severity of the S-MPM procedure is not intuitive and the surgeon using it must recalibrate the operational risk.
Other scoring systems, such as the British United Provident Association (BUPA) used in the Surgical Risk Score by Sutton et al, include a more complex division. BUPA divides operations into five categories, where, for example, appendectomy is included in the high-risk group.17 Modified John Hopkins surgical criteria, used by Donati et al, assume, for example, that cholecystectomy belongs to the medium-risk group. In our center, this is a low-risk procedure.15
As you can see, the criteria for qualifying procedures for specific operational risk groups are heterogeneous. It is impor-tant to carefully read the criterion used in the scale that we want to use. With the advancement of surgical technique, we observe a reduction in operational risk (eg, open surgery is currently performed laparoscopically, intravascularly). For this reason, it is necessary to regularly adjust existing risk scales in order to adapt them to rapidly changing realities.
The authors of S-MPM excluded from the analysis ments under local anesthesia. We have included such treat-ments in our analysis because we are of the opinion that the mortality rate is influenced above all by the patient’s risk and the extent of the surgery, while the risk associated with the type of anesthesia goes to the second plane. The anesthetic risk associated with narcosis is negligible today (<1:20,000). Patients operated under local anesthesia were included in our study into the low risk of surgical.
The Urgency Of The Procedure As
Element Of S-MPM Score
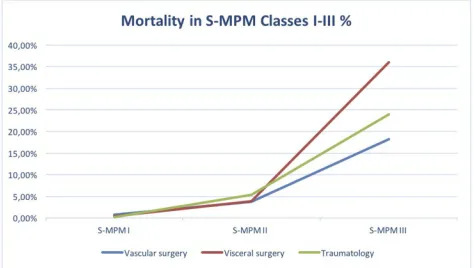
The urgency of the procedure is an important component of the risk. Found in the OR literature for urgent surgery, they are between 2.26 (95% CI: 0.8–6.4),152.5 (95% CI: 1.5–3.9),20 2.45 (95% CI: 1.65–3.25),214.6 (95% CI: 3.1–6.4),22and 6.2 (95% CI: 4.43–8.66).23After adjusting for the ASA PS status and operational risk, the urgent surgery involved a threefold increase in the risk of in-hospital death (OR = 2.99; 95% CI: 2.32–3.85). This is a result similar to the results of Glance et al (OR for urgent surgery in S-MPM = 2.54). The S-MPM scale showed the best discrimination in general and traumatic sur-gery (seeTable 8). For these two treatments, the AUC reached 0.89. In vascular surgery, the AUC of the S-MPM scale reached only 0.735 (95% CI: 0.677–0.792, p = 0.00001). This result reflects the specific risk profile of patients in this group. A similar result in our study reached ASA (AUC in vascular density = 0.072, 95% CI: 0.722–0.823) and RCRI (AUC in vascular density = 0.745, 95% CI: 0.69–0.8). This result is not a surprise, because as it is known, the RCRI scale
Figure 2Mortality in S-MPM (I–III) classes for vascular, general, and traumatic surgery.
Therapeutics and Clinical Risk Management downloaded from https://www.dovepress.com/ by 118.70.13.36 on 27-Aug-2020
does not take into account non-cardiac causes and is not suitable for the estimation of all-cause-mortality.22The accu-sation in the readers’ letters about the S-MPM scale that insufficient consideration of the nature of individual surgical disciplines is illustrated by the mortality diagram in vascular, general and traumatic surgery in S-MPM classes (class I–III).24These discrepancies can be easily mitigated by adjust-ing the logistic regression coefficients to a givenfield, as it was done, for example, for the Vascular-POSSUM (V-POSSUM) scale.25,26In this way, not one universal but several specific S-MPM scales will be created, without complicating this tool (eg, Vasc-S-MPM, Trauma-S-MPM). The difference would be only to change the score given to given S-MPM risk factors on the basis of specifically calculated regression coefficients.
Practical Use Of The Prediction Tools
Glance also admits that the use of accurate tools, including specific types of operations, specific diseases, such as the National Surgical Quality Improvement Program Surgical Clinical Reviewer (NSQIP SRC) calculator, is justified in the face of current widespread and easy access to compu-ters/smartphones. Complicated mathematical calculations are automatically performed.24However, in our opinion, it is not the availability of a computer that is a key problem. Most calculators are available in a mobile form and can be used always and everywhere at the patient’s bedside. The real problem is the time required to enter a large number of variables. Glance et al obtained the data from the NSQIP program resources. The integrity of the data is guaranteed by a system in which people specially trained for this purpose deal with the completion of data on research, interview, and conduct telephone surveys with patients after discharge. Therefore, these were high-quality data. This is evidenced by the good result of the S-MPM scale validated by us. Administration data are considered to be of low quality and maybe the reason for the poor accuracy of the scale created on their basis.24
In the case of our data, the characteristics of the admin-istration had only information about the hospital’s death in the patient. All other information, such as ASA classifi ca-tion, cardiology, endocrinology, pulmonology, exercise capacity, and current pharmacotherapy are collected during anesthesiological preparation in a systematic premedica-tion program by colleagues of anesthesiologists. These data are independent of the coding quality in the Diagnosis-Related Group system as is the case for admin-istrative data.
Conclusions
The S-MPM scale by Glance et al has proven to be a useful tool to assess the risk of in-hospital death and can be taken into account when considering treatment indications, patient infor-mation, planning post-operative care and quality control.
Summation
A simple nine-point S-MPM scale achieved a good dis-criminating power and a perfectfit in the entire population studied, with particular emphasis on general and traumatic surgery. In vascular surgery her discriminating power was weak. We are of the opinion that the authors of the S-MPM scale managed to achieve the intended goal of creating a tool that is quite accurate and at the same time uncomplicated.
In the future, one would be tempted to design several varieties of the S-MPM scale addressed to specific surgical disciplines.
Consent Of The Bioethics
Committee
There is no need to obtain the consent of the Bioethics Committee in the following situations in Germany and applies to our institution HELIOS Hospital in Berlin-Buch.
(1) Quality assurance activities without research objective. (2) Analysis of anonymized retrospective data, meaning that existing data from a patientfile without name, address or date of birth are analyzed. This means that it is no longer possible to assign a datafile to a specific patientfile at a later date.
Abbreviations
S-MPM, Surgical Mortality Probability Model; AUC, area under curve; HL test., Hosmer–Lemeshow test; ASA, American Society of Anesthesiology; RCRI, Revised Cardiac Risk Index; ESC, European Society of Cardiology; ESA, European Society of Anesthesiology; ACS-NSQIP, American College of Surgeons-National Surgical Quality Improvement Program; NSQIP, National Surgical Quality Improvement Program; NSQIP SRC, National Surgical Quality Improvement Program Surgical Clinical Reviewer; HIS, Hospital Information System; PCCL, Patient Clinical Complexity Level; BUPA, British United Provident Association; OR, odds ratio; ASA, American Society of Anesthesiology; ASA PS, American Society of Anesthesiologists physical status; V-POSSUM,
Therapeutics and Clinical Risk Management downloaded from https://www.dovepress.com/ by 118.70.13.36 on 27-Aug-2020
Vascular-Physiological and Operative Severity Score for the enUmeration of Mortality and Morbidity; Vasc-S-MPM, Vascular-Surgical Mortality Probability Model; Trauma-S-MPM, Trauma-Surgical Mortality Probability Model; SRC, Surgery Risk Calculator; DRG, Diagnosis-Related Group; IR, interval; CHF, congestive heart failure; MI, myocardial infarction; AF, atrial fibrillation; CPR, cardio-pulmonary resuscitation; PAD, peripheral artery disease; TIA, transient ischemic attack; PTCA, percutaneous transluminal coronary angioplasty; CABG, coronary Artery Bypass Graft; COPD, chronic obstructive pulmonary disease; DM, type 2 diabetes mellitus; IDDM, insulin-dependent diabetes mellitus; NIDDM, non-insulin-dependent diabetes; liver cirrhosis, cirrhosis of any Child-Pugh level; HS, length of hospitali-zation; HS before OP, length of stay before surgery; Total Time OP, total time of durations of operations; CI, confi -dence interval; ROC, receiver operation curve; MACE, major accident cardiac event; Crude OR, odds ratio in univariate regression analysis; adj. OR, odds ratio after adjustment relative to the rest of explanatory variables in the multivariate regression analysis.
Limitations
The weakness of our study is the fact that we did not have the data needed to determine the suitability of the S-MPM scale to predict death within 30 days of surgery. Also, the classification of the severity of surgical procedures was not consistent with that used in the original work. One should remember about an additional problem regarding every scale trying to predict mortality and morbidity based on pre-operative data. An escalation of the surgery that cannot be predicted raises the actual risk compared to the risk that was estimated taking into account the original plan/scope of the operation. The retrospective nature of our study from the routine data excludes the possibility of creating various types of adulteration (“bias”). This fact speaks in favor of the tested scale, which worked well in the conditions of everyday routine in the external center. An ambiguous way of qualifying surgery for three risk classes, another in Glance’s work and in our study, did not significantly reduce the suitability of this scale to assess the risk of in-hospital death.
Data Availability
Thefirst author has the data supporting the results reported in the manuscript and will make them available at the editor’s or readers’request.
Author Contributions
All the authors approve of the version of the manuscript to be published and agree to be accountable for all aspects of the work in ensuring that questions related to the accuracy or integrity of the work are appropriately investigated and resolved. The specific contributions (conditions 1 and 2) of the authors is as follows:
Sebastian Kazimierczak: the conception and design of the work; the acquisition, analysis, and interpretation of data for the work; drafting the work. Anita Rybicka: the acquisition, analysis, and interpretation of data for the work; drafting the work. Jochen Strauss: the design of the work; the interpretation of data for the work; revising the work critically for important intellectual content. Malgorzata Schram: the acquisition and analysis of data for the work; drafting the work. Arkadiusz Kazimierczak: the conception or design of the work; the analysis and interpretation of data for the work; drafting the work. Elżbieta Grochans: the analysis and interpretation of data for the work; revising the work critically for important intellectual content.
Disclosure
The authors declare no competing interests of any kind in this work.
References
1. Birkmeyer JD, Shahian DM, Dimick JB, et al. Blueprint for a new American College of Surgeons: national quality improvement pro-gram. J Am Coll Surg. 2008;207(5):777–782. doi:10.1016/j. jamcollsurg.2008.07.018
2. Wijeysundera DN. Predicting outcomes: is there utility in risk scores?
Can J Anaesth.2016;63(2):148–158. doi:10.1007/s12630-016-0620-3 3. Moonesinghe SR, Mythen MG, Das P, Rowan KM, Grocott MP. Risk
stratification tools for predicting morbidity and mortality in adult patients undergoing major surgery: qualitative systematic review.Anesthesiology. 2013;119(4):959–981. doi:10.1097/ALN.0b013e3182a10fbf
4. Esa A, Knuuti J, Anker S, et al. 2014 ESC/ESA guidelines on non-cardiac surgery: cardiovascular assessment and management. Eur Heart J.2014;35(35):2383–2431. doi:10.1093/eurheartj/ehu152 5. Devereaux MPJ, Chan MTV, Alonso-Coello P, Walsh M, Berwanger
O. Association between postoperative troponin levels and 30-day mortality among patients undergoing noncardiac surgery. JAMA. 2012;307(21):2295–2304. doi:10.1001/jama.2012.5502
6. Glance LG, Lustik SJ, Hannan EL, et al. The surgical mortality probability model. Ann Surg. 2012;255(4):696–702. doi:10.1097/ SLA.0b013e31824b45af
7. Paul P, Pennell ML, Lemeshow S. Standardizing the power of the Hosmer-Lemeshow goodness offit test in large data sets.Stat Med. 2013;32(1):67–80. doi:10.1002/sim.5525
8. Bilimoria KY, Liu Y, Paruch JL, et al. Development and evaluation of the universal ACS NSQIP surgical risk calculator: a decision aid and informed consent tool for patients and surgeons. J Am Coll Surg. 2013;217(5):833–842. doi:10.1016/j.jamcollsurg.2013.07.385
Therapeutics and Clinical Risk Management downloaded from https://www.dovepress.com/ by 118.70.13.36 on 27-Aug-2020
9. Sankar A, Johnson SR, Beattie WS, Tait G, Wijeysundera DN. Reliability of the American Society of Anesthesiologists physical status scale in clinical practice.Br J Anaesth.2014;113(3):424–432. doi:10.1093/bja/aeu202
10. Owens WD, Felts JA, Spitznagel EL. ASA physical status classifi ca-tions: a study of consistency of ratings. Anesthesiology. 1978;49 (4):239–243. doi:10.1097/00000542-197810000-00003
11. Hartley MN, Sagar PM. The surgeon’s‘gut feeling’as a predictor of post-operative outcome.Ann R Coll Surg Engl.1994;76(6):277–278. 12. Saklad M. Grading of patients for surgical procedures.
Anesthesiology.1941;2:281–284. doi:10.1097/00000542-194105000-00004
13. Prause G, Ratzenhofer-Comenda B. Can ASA grade or Goldman’s cardiac risk index predict peri-operative mortality? A study of 16 227 patients.Anaesthesia.1997;52:203–206.
14. Wolters U, Wolf T, Stützer H, Schröder T. ASA classification and perioperative variables as predictors of postoperative outcome.Br J Anaesth.1996;77(2):217–222. doi:10.1093/bja/77.2.217
15. Donati A, Ruzzi M, Adrario E, et al. A new and feasible model for predicting operative risk. Br J Anaesth. 2004;93(3):393–399. doi:10.1093/bja/aeh210
16. Davenport DL, Bowe EA, Henderson WG, Khuri SF, Mentzer RM. National Surgical Quality Improvement Program (NSQIP) risk fac-tors can be used to validate American Society of Anesthesiologists Physical Status Classification (ASA PS) levels.Ann Surg.2006;243 (5):636–641. doi:10.1097/01.sla.0000216508.95556.cc
17. Sutton R, Bann S, Brooks M, Sarin S. The surgical risk scale as an improved tool for risk-adjusted analysis in comparative surgical audit.
Br J Surg.2002;89(6):763–768. doi:10.1046/j.1365-2168.2002.02080.x
18. Ford MK, Beattie WS, Wijeysundera DN. Systematic review: pre-diction of perioperative cardiac complications and mortality by the revised cardiac risk index. Ann Intern Med. 2010;152(1):26–35. doi:10.7326/0003-4819-152-1-201001050-00007
19. Sultan P. The vascular events in noncardiac surgery patients cohort evaluation (VISION) study investigators. Anesthesiology. 2014;120 (3):564.
20. Pillai SB, Van Rij AM, Williams S, Thomson IA, Putterill MJ, Greig S. Complexity- and risk-adjusted model for measuring surgical outcome.Br J Surg.1999;86(12):1567–1572. doi:10.1046/j.1365-2168.1999.01286.x 21. Protopapa KL, Simpson JC, Smith NCE, Moonesinghe SR. Development
and validation of the Surgical Outcome Risk Tool (SORT).Br J Surg. 2014;101(13):1774–1783. doi:10.1002/bjs.2014.101.issue-13
22. Boersma E, Kertai MD, Schouten O, et al. Perioperative cardiovas-cular mortality in noncardiac surgery: validation of the Lee cardiac risk index. Am J Med. 2005;118(10):1134–1141. doi:10.1016/j. amjmed.2004.04.032
23. Hadjianastassiou VG, Tekkis PP, Poloniecki JD, Gavalas MC, Goldhill DR. Surgical mortality score: risk management tool for auditing surgical performance. World J Surg. 2004;28(2):193–200. doi:10.1007/s00268-003-7174-6
24. Trencheva K, Morrissey KP, Wells M, et al. Reply to Letter.Ann Surg.2015;261(4):e94–e95. doi:10.1097/SLA.0000000000000756 25. Mosquera D, Chiang N, Gibberd R. Evaluation of surgical
perfor-mance using V-POSSUM risk-adjusted mortality rates.ANZ J Surg. 2008;78(7):535–539. doi:10.1111/j.1445-2197.2008.04429.x 26. Neary JJ, Heather WD, Earnshaw BP. The Physiological and Operative
Severity Score for the enUmeration of Mortality and morbidity (POSSUM).Br J Surg.2003;90(5):157–165. doi:10.1002/bjs.4041
Therapeutics and Clinical Risk Management
Dove
press
Publish your work in this journal
Therapeutics and Clinical Risk Management is an international, peer-reviewed journal of clinical therapeutics and risk management, focusing on concise rapid reporting of clinical studies in all therapeutic areas, outcomes, safety, and programs for the effective, safe, and sustained use of medicines. This journal is indexed on PubMed Central, CAS,
EMBase, Scopus and the Elsevier Bibliographic databases. The manuscript management system is completely online and includes a very quick and fair peer-review system, which is all easy to use. Visit http://www.dovepress.com/testimonials.php to read real quotes from published authors.
Submit your manuscript here:https://www.dovepress.com/therapeutics-and-clinical-risk-management-journal
Therapeutics and Clinical Risk Management downloaded from https://www.dovepress.com/ by 118.70.13.36 on 27-Aug-2020