ANISOTROPIC DIFFUSION
WEIGHTED CONTRAST IN
MAGNETIC RESONANCE IMAGES
OF THE HUMAN SUBJECT.
by Mark Doran B.Sc.,Ph.D.,M.B.B.S.,M.R.C.P.
All rights reserved
INFORMATION TO ALL USERS
The quality of this reproduction is dependent upon the quality of the copy submitted.
In the unlikely event that the author did not send a complete manuscript and there are missing pages, these will be noted. Also, if material had to be removed,
a note will indicate the deletion.
uest.
ProQuest 10044392
Published by ProQuest LLC(2016). Copyright of the Dissertation is held by the Author.
All rights reserved.
This work is protected against unauthorized copying under Title 17, United States Code. Microform Edition © ProQuest LLC.
ProQuest LLC
789 East Eisenhower Parkway P.O. Box 1346
ACKNOWLEDGEMENTS
I would like to express my gratitude to my colleagues and co-workers without whose help and encouragement this thesis would not have been written.
In particular I am deeply indebted to Dr J Hajnal for both the development of the sequences and for theoretical discussions; to Drs N Van Bruggen and M King for the early experiments on the small bore systems and to Angela Oatridge for her extremely efficient radiographic management of the patients and the imager.
Many others have contributed to this thesis through their discussions, support and encouragement; in particular I would like to thank Professor Steiner for supervising this project and Professor Gadian for his help in many aspects of the development of the work and the thesis.
Other colleagues have taught me a great deal about the practical aspects of Magnetic Resonance Imaging, in particular Drs A Collins, D Bryant, G Coutts and Professor IR Young.
I am very grateful to the Wellcome Trust for granting me a Clinical Fellowship and for the financial support to carry out this research.
4 ABSTRACT
The proton nuclear magnetic resonance signal of biological systems arises mainly from water. Its intensity is time dependent and varies with a number of physical properties of water. The resulting contrast (or signal difference between two tissues) displayed in an image varies with the proton density, the relaxation times T1 and T2 of the tissues as well as the mobility of the protons. This thesis considers the clinical development of the use of the pulsed gradient spin echo (PGSE) sequence, designed to detect microscopic molecular motion. However motion sensitization itself leads to grave practical difficulties with image artefact. Motion artefact suppression methods are discussed in detail. Despite the difficulties, it was possible to produce images that represented the relative mobility of water in differing defined directions i.e. directional contrast.
Application of this imaging technique to normal subjects allowed direct visualisation of the fibre tracts within the white matter. Evidence is advanced to support the contention that directional contrast arises from the properties of the myelin sheath. Small scale studies of different diseases were undertaken to assess the type of change that might be expected with this type of imaging. It is shown that some anisotropy of
It is concluded that diffusion weighted imaging will have a role in clinical practice as a method to increase the specificity of magnetic resonance as an imaging technique. However the practical problems of motion artefact control need to be much
6 NICHOLAS STENO (1638-1686)
If as I have just said the substance of the brain is little known to us, the true manner of dissecting it is not any better known, I do not speak of those who cut the brain into slices; it has been recognised for a long time that this does not provide any anatomical elucidation. The other (method of) dissection in which the gyri are unfolded is a little more artistic; but it only shows us the outside of what we are interested in and even that imperfectly.
The third which adds to the development of the gyri, a separation of the grey (cortex) from the white substance, goes a little further, it does not penetrate, however, beyond the surface of the medulla. Various combinations of these three methods of dissection have been used, and various types of longitudinal and transverse sections can be added.
INTRODUCTION ... 13
HISTORICAL BACKGROUND ... 14
DIFFUSION WEIGHTED IMAGING VERSUS DIFFUSION MEASUREMENTS ... 15
REFERENCES... 16
CHAPTER 1 ... 17
BACKGROUND AND PRINCIPLES OF NUCLEAR MAGNETIC RESONANCE (NMR) ... 17
INTRODUCTION ... 17
NUCLEAR MAGNETISM ... 17
RELAXATION TIMES ... 21
FREE INDUCTION D E C A Y ... 25
SPIN E C H O E S ... 25
PULSED GRADIENT SPIN ECHO SEQUENCE (PGSE) ... 2 6 MAGNETIC RESONANCE IMAGING ... 27
SPATIAL LOCALISATION ... 29
MAGNETIC FIELD GRADIENTS ... 29
RADIOFREQUENCY ... 32
S E Q U E N C E S ... 34
MOTION ARTIFACT ... 35
DIFFUSION IN PHYSIOLOGY AND N M R ... 35
DETAILS OF THE IMAGING EQUIPMENT ... 37
CONTROL OF MOTION ARTIFACT ... 39
NOVEL RADIOLOGICAL CONCEPTS ... 41
C O N C L U S I O N S ... 41
8
CHAPTER 2 ... 47
DIFFUSION; THEORY AND MEASUREMENT USING NMR ... 47
INTRODUCTION ... 47
RESTRICTED DIFFUSION ... 50
DIFFUSION SENSITIVE SEQUENCES ... 53
APPLICATIONS TO BIOLOGICAL MATERIALS... 57
CONCLUSION... 58
R EFERENCES... 59
CHAPTER 3 ... 61
PLANT PHANTOM. ANIMAL AND EARLY HUMAN STUDIES ... 61
INTRODUCTION ... 61
M E T H O D ... 61
MRI S E Q U E N C E S ... 62
CELERY PHANTOM EXPERIMENT 63 R E S U L T S ... 63
ANISOTROPY IN RODENT BRAIN ... 65
R E S U L T S ... 66
ANISOTROPY IN THE HUMAN B R A I N ... 67
C O N C L U S I O N S ... 77
CHAPTER 4 ... 100
ANISOTROPICALLY RESTRICTED DIFFUSION IMAGING ... 100
INTRODUCTION ... 100
T H E O R Y ... 100
VARIATION OF T d ... 101
VARIATION OF T p ... 102
VARIATION OF ECHO T I M E ... 103
SEQUENCE VARIATIONS ... 104
DIFFUSION TIME T d ... 110
DIFFUSION SENSITIVITY FACTOR (b) 110
CHOICE OF GRADIENT DIRECTION ... Ill MOTION ARTIFACT CONTROL ... 113
USE OF SPECIAL GRADIENT C O I L ... 114
DISCUSSION... 116
C O N C L U S I O N S ... 118
REFERENCES... 120
CHAPTER 5 ... 123
NORMAL WHITE MATTER TRACT ANATOMY ... 123
INTRODUCTION ... 123
M E T H O D ... 128
R E S U L T S ... 132
DISCUSSION... 148
C O N C L U S I O N S ... 149
10
CHAPTER 6 ... 153
ANISOTROPIC DIFFUSION AND MULTIPLE SCLEROSIS ... 153
INTRODUCTION ... 153
P A T H O L O G Y ... 154
PREVIOUS DIFFUSION MRI STUDIES ... 158
OBJECTIVES OF S T U D Y ... 159
ARDI MULTIPLE SCLEROSIS STUDY ... 159
PATIENT POPULATION ... 160
IMAGING METHOD ... 160
PATIENT POPULATION CHARACTERISTICS ... 162
R E S U L T S ... 172
DISCUSSION... 174
DIFFUSION IMAGING AND PREVIOUS MRI STUDIES OF M S . . 177
C O N C L U S I O N S ... 179
REFERENCES... 182
CHAPTER 7 ... 187
ANISOTROPIC DIFFUSION AND CEREBROVASCULAR DISEASE . . . 187
INTRODUCTION ... 187
P A T I E N T S ... 187
ISCHAEMIC STROKES ... 188
HAEMORRHAGIC LESIONS ... 194
SUBDURAL HAEMATOMA ... 198
DISCUSSION... 199
CHAPTER 8 ... 206
ANISOTROPIC DIFFUSION AND A I D S ... 206
INTRODUCTION ... 206
PATIENT POPULATION ... 207
R E S U L T S ... 207
DISCUSSION... 213
CONCLUSION... 214
R EFERENCES ... 216
CHAPTER 9 ... 218
ANISOTROPIC DIFFUSION AND TUMOURS ... 218
INTRODUCTION ... 218
P A T I E N T S ... 219
DISCUSSION... 229
C O N C L U S I O N S ... 230
REFERENCES... 233
CHAPTER 1 0 ... 234
ANISOTROPIC DIFFUSION AND EPILEPSY ... 234
INTRODUCTION ... 234
M E T H O D ... 235
P A T I E N T S ... 235
R E S U L T S ... 239
DISCUSSION... 239
C O N C L U S I O N S ... 241
12 SUMMARY AND CONCLUSION ... 244
APPENDIX 1 ... 254 THE EFFECTS OF DIFFUSION ON SPIN ECHO AMPLITUDES. . 254
INTRODUCTION
This thesis describes the application of a novel Magnetic Resonance Imaging (MRI) method to study diffusion in normal and diseased brain of man.
The first three chapters outline the physical theory of MR and the diffusion process. I outline the technical application
of the NMR method from its inception in the 1960's to the first attempts to use it as an imaging method the^early 1970's in the first chapter. The technological application of MR to generate images is discussed at some length. The work of Hahn and others on the effects of diffusion processes on the MR signal is then discussed. The methods of incorporating diffusion sensitivity are detailed in the final section of Chapter one. Chapter two continues with this topic and discusses the details of the pulsed gradient spin echo sequence (PGSE which is the term used to describe the method) and goes on to discuss other workers' findings on simple chemical and biological systems. In Chapter
three the results of the animal work done to develop the method is outlined together with the first human image obtained with the sequences used in this study.
14 radiological appearances result when the method is applied to a number of different diseases.
HISTORICAL BACKGROUND
The first demonstration of the variation of calculated apparent diffusion coefficients^within the white matter of man was by Thompson et al (1) . They showed that the values of D*
from two point derived diffusion maps of axial sections were different in the frontal and occipital lobe white matter. They suggested that this may be either due to variation in the local diffusion coefficient or may reflect directional effects imposed on the diffusion process by the underlying anatomy. (The term anisotropy can be applied to a property of a system exhibiting unequal physical properties or actions in one or more directions.)
Moseley et al (2) in 1990 showed that it was possible to obtain images of the cat brain that reflected relative water mobility or diffusion in differing directions. The images had
areas of varying signal intensity in the white matter which altered as a function of the orientation of the axis along which diffusion was being observed. Moseley correlated these changes
with the directionality of the white matter tracts. It was proposed that the effect arose from directional differences in
water mobility. This was considered in a recent editorial to be a scientific curiosity (3) and was believed to have no clinical
It will be shown, in this thesis, that directionally differing diffusion changes can indeed be seen in images of the human brain. Furthermore these images are affected by disease processes which affect the diffusion properties of human tissue. Much more study of pathophysiology will now be needed to appreciate the implication of these changes. One advantage of diffusion as an imaging method is that it is more easily related to the biology of the system than the more usual imaging parameters T1 and T2 which will defined later in the text.
This thesis illustrates for the first time some of the imaging features seen in a wide range of neurological diseases when the PGSE method is used and concludes with suggestions for a number of avenues of new research prompted by our results. Prior to this study the pattern of diffusion changes seen in a wide range of diseases was unknown and much still remains to be described.
DIFFUSION WEIGHTED IMAGING VERSUS DIFFUSION MEASUREMENTS
16 REFERENCES
1. Thompsen C, Henriksen O, Ring P. In vivo measurement of water self diffusion in the human brain by magnetic resonance imaging. Acta Radiologica Scand. 1987; 28: 3 53- 361.
2. Moseley ME, Cohen Y, Mintorovitch J, Chileuitt 1, Shimizu H, Kucharczyk J, Wendland MF, Weinstein PR. Early detection of regional cerebral ischemia in cats: comparison of diffusion and T2 weighted MRI and spectroscopy. Magn. Reson. Med.
1990; 14:330-346.
3. Henkelman RM. Diffusion- weighted mr imaging; A useful adjunct to clinical diagnosis or a scientific curiosity. A.J.N.R. 1990; 11:931-934.
CHAPTER 1
BACKGROUND AND PRINCIPLES OF NUCLEAR MAGNETIC RESONANCE (NMR) INTRODUCTION
The phenomenon of nuclear magnetic resonance (NMR or just MR) was described independently by Bloch's and Purcell's research groups in 1946 (1,2). It had been known for some time that the nuclei of certain isotopes had magnetic properties resulting in them behaving like tiny bar magnets (or dipoles) when placed in a magnetic field. The magnitude of the effect was very weak and difficult to detect. These groups developed a resonance technique to increase the sensitivity of detection of the effect (3). However interest in the method may well have waned had not the effect of chemical shift been observed. The local magnetic field at a given nucleus is affected by the local chemical environment leading to a small change in the resonance frequency. Chemical shift was used to develop NMR as sophisticated tool for chemical analysis.
The concept of using MR to study living human subjects has been attributed to Jasper Jackson in 1967 after he produced NMR
signals from living subjects. The first two dimensional image of a phantom was produced by Lauterbur in 1972 followed within two years by an image of a live animal.
NUCLEAR MAGNETISM
Wolfgang Pauli in 1924 was the first to suggest that certain
18 demonstrated in 1922 by Stern and Gerlach using molecular beam experiments. The nuclei can therefore be considered as spinning spheres which act as if they were microscopic bar magnets.
In the absence of an applied magnetic field the spinning nuclear magnets are randomly orientated in space. Application of a magnetic field (Bq) leads to a tendency for the nuclear magnetic dipoles to align along the direction of the field. This magnetic interaction is counterbalanced by thermal fluctuations in the sample which will tend to knock the magnetic dipoles out of alignment. Quantisation of the spins constrains the possible number of allowed spin orientations. For spin values of 1/2 only two states are allowed i.e. aligned with or against Bq. However
the alignment will not be parallel to Bq due to quantisation effects. The relative proportion of nuclei in the two states depends on their energy difference and the temperature and can be calculated using Boltzman statistics.
The quantisation of the spin states prevents the magnetic moments from aligning fully parallel to Bq. The magnetic moment
vector is therefore subject to a torque which causes it to process around Bq at the so called Larmor angular frequency (w).
The energy difference of the two states is directly proportional to the strength of the applied magnetic field, which is conventionally measured in units called Tesla T ) . The energy can be calculated from the relationship between the energy and frequency of electromagnetic radiation i.e.
and from the Larmor relationship which relates precessional frequency v to the magnetic field strength
&=7B ... 1.2a
u=cu/ 27T... 1. 2 b
The constant of proportionality is the gyromagnetic ratio y , the value of which depends on the nucleus under consideration. For the hydrogen nucleus 7=2.65197x10* rad s T'^. It is instructive to calculate the energy difference between the two states for a single nucleus in order to relate its value to chemical energies. This value of the energy difference is obtained by multiplying y
by Planck's constant h/27r (6.626x10^^ J s) to give a value of 4.486x10^7 J/Tesla for an isolated nucleus. Further
multiplication by Avogadro's number gives its molar value of 2.692x10^ J/mole/Tesla . This value demonstrates that at 1.5T the energy difference between the two states is 4.038x10'* J/Mole which is minute compared to chemical energies. For example a hydrogen bond has «2x10* J/mole.
For a macroscopic sample in a homogeneous magnetic field the individual magnetic moment vectors of each nucleus can be summed.
This can be considered either as two vectors which represent the net magnetisation in either the parallel and antiparallel states or as a single net magnetisation vector which is their sum. There will be fractionally more spins aligned with the field Bq,
as this provides the lowest energy states and this results in a net magnetisation vector aligned with Bq. For hydrogen nuclei
20 equilibrium with equal numbers of transitions from the higher to lower energy state as visa versa.
If the sample, e.g. the human body, is irradiated with electromagnetic radiation at a frequency which exactly matches the energy difference between these two states (i.e. at the Larmor frequency) a resonant interaction can take place. This induces transitions from one state to the other. These transitions result in the absorption and emission of photons of the same energy i.e. the same frequency. The small net excess of the magnetic dipoles aligned with the applied magnetic field results in a detectable absorption of the radiation at the resonance frequency. From the calculated energy separation of the two states it can be seen that the appropriate frequency of electromagnetic radiation required is in the radiowave frequency range i.e. megahertz.
Exploitation of this resonant phenomenon using low-energy radiowaves which can be generated with a well defined narrow band of frequencies lies at the heart of the magnetic resonance imaging (MRI) technique. Furthermore the very weak interaction between physical materials and radiowaves makes it very suitable for non-invasive imaging of the human subject without an ionising radiation hazard.
orthogonal to Bq it is possible to rotate the nuclear magnetism away from its equilibrium orientation parallel to Bq. When the
Bi field is removed, nuclear magnetism precesses around an axis parallel to Bq at the Larmour frequency. The magnitude of the
induced signal depends on the number of nuclei contributing to it and for this reason the density (p) of water protons in tissues
u
is an important parameter^in^vitro MR.
This rotating vector is able to induce an rf signal at the resonance or Larmor frequency in a suitably tuned rf coil. The process of perturbing the angle of orientation of the net magnetisation vector can be most simply envisaged using a coordinate system in which has the Z axis is aligned along Bq but
the X and Y axes rotate at the resonance frequency. This so- called rotating frame of reference depicts the net effect of perturbing the magnetisation vector into the transverse plan as a simple rotation about the X or Y axis rather than the spiralling trajectory it actually circumscribes.
RELAXATION TIMES
Historically it was noted that if the induced magnetic moment of a simple system, e.g. water, was perturbed it would decay back to its equilibrium value with two characteristic time constants. This behaviour was first described by Bloch using a
22 Bq, i.e. the longitudinal magnetisation, the other in a plane at
right angles to this i.e. the transverse magnetisation.
Two time decay constants were considered to describe the relaxation of the system back to the unperturbed state and were denoted by the terms T1 for the longitudinal or spin lattice and T2 for the transverse or spin-spin relaxation times. The molecular basis of the relaxation processes in biological tissues remains incompletely understood. It is believed that a coupling between the magnetic moments of the nuclei and local electric and magnetic fields allows the relaxation process to take place. Coupling refers to^process of linking of the motions of one particle to another. This can be best conceptualised by considering the behaviour of two compass needles that are placed side by side. Perturbation of one needle would cause the second to move. There is thus an energy transfer from one to the other as they are a coupled system.
imperfections in the applied magnetic field leads to further T2 type decay and is denoted by T2*. T2* is related to T2 via
1/T2* = 1/T2 + 1/T2'... 1.4
where 1/T2' is the line broadening effect from the magnetic field inhomogeneity.
A key observation by Edzes and Samulski (4) was that there is a cross relaxation process between hydrophillic macromolecules and water. The bound water molecules tumble at slow rates (i.e. relative to the Larmor frequency) compared with free water and are efficient at causing T2 relaxation. It is believed that
protein molecules play a key role in determining the observed relaxation rates of biological tissues.
In proton NMR the major coupling mechanism is between the magnetic dipoles of adjacent protons within the water molecule.
It can be shown that if the water molecule is held fixed, as in ice, then the local field homogeneity would be ±2 mT. This would cause a rapid loss of the phase coherence of a cohort of spins resulting in a shortening of T2 to 12^sec without affecting Tl.
In the liquid state the water molecules are constantly tumbling. The rate of tumbling is characterised by the correlation time (rj which defines the time taken for the
24 inhomogeneity to zero. The addition of slowly tumbling protein molecules such as globular proteins (Tj.«10'^-10‘* sec) leads to a
static local field inhomogeneity on the NMR time scale and shortens T2 relative to Tl. Additionally with anisotropic molecular motion the static contribution to T2 does not average to zero and this is a further mechanism for dephasing.
The rapid molecular tumbling is a source of local magnetic field fluctuation via dynamic magnetic dipole-dipole coupling and contributes to both the Tl and T2 decays. In any sample there will be a distribution of tumbling rates, a proportion of which will lead to an oscillating magnetic field at the resonance frequency. The oscillating magnetic field allows transitions between magnetic moments aligned along or against and results
in spin exchange between protons. Spin exchange leads to random dephasing and hence spin-spin or T2 relaxation as well as providing a mechanism for dissipating the spin energy into the thermal motions of the system (or lattice), i.e spin lattice relaxation.
are important determinants of T2 and are related to the lifetime
of the water molecule in its bound state to macromolecules.
FREE INDUCTION DECAY
The simplest MR signal can be generated by rotating the net magnetisation through 90°. The precessing magnetisation vector
decays away exponentially. The net voltage generated in the receive coil is a damped cosine wave. This signal is called the free induction decay (FID).
SPIN ECHOES
The application of more than one pulse of rf to the sample results in the spin echo phenomenon. This effect was described in a paper by Hahn (6) published in 1950. After rotating a cohort of magnetic dipoles through 90° (using a 90° pulse) , it was noted that the FID of the sample decayed away with a decay constant T2*
which was shorter than T 2 . This is due to the spabial inhomogeneity of the magnetic field leading to phase incoherence. Hahn showed that a second pulse of 180° applied to the sample at
a time TE/2 later can re-establish phase coherence of the cohort of spins at a time TE from the 90° pulse, giving a second smaller
emission of rf. This effect arises from the spin like behaviour of the nuclei and is similar to the echo effect obtained with sound waves in a cavity. The term spin echo was used to denote this phenomenon and TE was named the echo time.
26 amplitude of the echo as a function of echo time. Carr and Purcell (7) further analyzed the mathematical basis of the effect of diffusion on both the Hahn echo and a novel sequence of rf pulses of their own (the Carr-Purcell sequence). (See Appendix 1 page 254 for details.) These methods were initially used to measure the diffusion constant of water molecules in pure water; the so called self diffusion coefficient (D). Experiments were performed on small samples of pure liquid without any image formation. This continues to be applied in physics and chemistry for the measurement of diffusion coefficients in pure liquids, solutions and colloidal systems.
An additional refinement to this technique was devised by Woessner (8), who applied a linear magnetic field gradient across his sample i.e. an additional magnetic field which varied in a linear fashion across the bore of the magnet. The magnetic field gradient resulted in a more rapid attenuation of the amplitude of the spin echo from the movement of molecules along its direction, i.e. it sensitized the experiment to molecular motion.
PULSED GRADIENT SPIN ECHO SEQUENCE (PGSE)
In physical terms the sequence uses the pulsed gradients to mark the starting and final positions of the protons at the time of the application of the pulsed gradients. The first pulse gradient changes the precessional frequency in a position dependent fashion. This adds an additional phase angle to each
proton. During the interval between the pulsed gradients molecules may move from their original position depending on the diffusional properties and the local environment. The second pulsed gradient again imposes a position dependent phase shift on the spins and can be used to detect translational motion during the interval between the pulses. If the molecule has not moved the phase changes produced by the first and second pulsed gradients will exactly cancel and the echo will have an unattenuated amplitude. However the effect of diffusion is to ensure that there is a net dephasing of the signal leading to a reduction in the amplitude of the spin echo.
MAGNETIC RESONANCE IMAGING
28
F I G 1.1
C O M P O N E N T S OF A S T A N D A R D I M A G E R
SU PE R C O N D U C T I N G
MA G NE T
Z AMP.
A M P
A M P L I F I E R
RF
X AMP.
Y AMP.
ADC
D I S P L A Y P R O C E S S O R
A R R A Y CP U
T R A N S M I T C O I L
G R A D I E N T C O I L S
R E C E I V E C O I L
RF = RF S Y N T H E S I S E R
C P U = C E N T R A L P R O C E S S I N G U N I T
The main magnetic field (Bq) is generally generated by a wide-bore super-conducting magnet; for these experiments a field of 0.15T was employed (11). The magnetic field was homogeneous over a 50cm sphere to
»50ppm.
SPATIAL LOCALISATION
The requirements of any imaging method are that the signal varies with a property of the sample and that the location of signals from differing regions can be determined. The most commonly used method of spatial localisation relies on the application of three orthogonal magnetic field gradients (12). The term sequence is applied to a combination of rf pulses and field gradients used to generate an image. The exact timings of the components of the MR I sequence and the order in which the gradients are used determine the plane of the image and its dependency on the standard NMR variables i.e. p , Tl, T2 etc. Sequences are applied repeatedly with systematic variation of the field gradients to build up an image. The data is usually acquired on a line by line basis and then transformed into an image using a mathematical technique called a Fourier transform. Typically 128 or 256 lines of data are acquired for each image.
MAGNETIC FIELD GRADIENTS
30 Y are transverse to this direction and are across the bore of the magnet.
CO O R D I N A T E SCHEME FOR A R DI
licitno-ùi
Y
Figure 1.2 Axis system for imaging.
The gradients are generated by coils that are set within the bore of the machine and surround the subject. The machine used for this work had a modified gradient coil set which generated up to 16mT/m. Commercial machines generally operate with gradient strengths of only lOmT/m. The stronger gradients are however crucial for the study of diffusion effects (vide infra). This modification narrowed the bore of the magnet limiting the space
for the subject.
which destroy the homogeneity of Bq and may adversely affect the
image.
Although a number of techniques are available for compensating for this effect such as gradient sets with additional coils to shield against these fields i.e. self shielded gradients. The scanner employed in this study did not incorporate any eddy current control measures. The eddy current effect depends on the rate at which the gradients are powered up and hence imposes constraints on the rise times of gradient profiles and the pulse gradient durations used.
For a two dimensional image a slice from the sample needs to be selected. This is achieved by exciting only the nuclei of one slice by the application of a narrow band rf pulse simultaneously with a magnetic gradient. The slice selection gradient results in a spatial variation of resonance frequencies, only part of which can be excited by the narrow band of rf. Slice selection has to be applied for each line of data used to build up the
image.
32 imaging information on a line by line basis. An appropriate selection of the slice, frequency and phase encoding gradients results in differing imaging planes which may be orthogonal or oblique to the principal axis system as well as the spacial
resolution.
RADIOFREOÜENCY
The rf signal is generated by an rf synthesizer that can be accurately tuned. It must be able to generate well defined short rf pulses of adequate power with a relatively narrow band of frequencies. The rf is transmitted to the subject via a transmit coil that is fitted within the bore of the magnet. This coil has to be decoupled from the receive coil to prevent interference.
The emitted rf signal from the subject is picked up by a receive coil. This can be built into the bore of the machine. However at 0.15T the signal strength is low and sensitive detection coils closely applied to the subject were required. A quasi-spherical head coil was used (13). The receiver allows the X (or real) and Y (or imaginary) components of the signal to be detected independently. This allows the angle of rotation (or phase angle (0)) of the magnetic vector in the transverse plane to be determined; 0= tan'^ (Y /% . The resulting signal is
For a two dimensional image, multiple applications of the pulse sequence are generally required. The number of applications depends on the degree of spatial resolution required and the size or field of view of the object.
A plot of these data in one to three dimensions displayed on
a grey or colour scale will then form an image. An image is thus just a visual representation of an array of data values.
A typical two dimensional imaging sequence therefore uses all three gradients along three orthogonal axes plus rf pulses to generate rf signals from the sample. The range of resonance frequencies in the frequency encoding direction are generally divided into 128 or 256 intervals. Modern computing power (the CPU) is needed to coordinate each of the individual units and to handle the imaging data
The Fourier transform, which is a mathematical method that can break down the complex radio-signal into its sub-component frequencies, is the usual method to convert the raw data into an image. An even number of data points in the phase encoding direction is required. If the signal intensity is low compared with the background noise then each application of the sequence with a given phase encoding gradient strength may be repeated several times and the data averaged. If n signals are averaged the image will look less noisy and the ratio of the signal from the sample to the inevitable background noise (S/N ratio) will
34
SEQUENCES
The clinical development of MRI started with pulse sequences that detected local changes in proton density (p) . As this variable only alters slightly between healthy tissues and in disease states other MR variables were sought.
Most clinical MR studies use spin echoes and Tl or T2 weighted contrast for imaging. The spin echo imaging sequences were developed to detect changes in either the Tl or T2 of pathological tissues. This approach was adopted following the demonstration by Damadian (15) that malignant tissue had a prolongation of the normal values of Tl and T2 for any given tissue (15).
The development of MRI from then on has resulted from an explosion of imaging sequences. These were designed to exploit other facets of MR behaviour that had been developed by physical scientists to probe molecular physics. Interest in pulsed gradient spin echo sequence as a clinical imaging technique started with Le Bihan in 1985 (16) . He applied the techniques of Stejskal and Tanner to phantoms, animals and man. The original theory suggested a logarithmic plot of the ratio of signal intensity versus the degree of motion sensitization of the sequence should give a straight line graph, the gradient of the line being proportional to the diffusion coefficient. Le Bihans's results did not give a straight line however. The data
fluid circulation demonstrated with MR velocity imaging.
35 phantom experiments lent support to this interpretation.) The intercept was believed to determine the volume fraction of the perfusate. These early papers determined that perfusion was the major area of imaging research with the pulsed gradient sequence
until 1990.
This thesis outlines the use of the pulsed gradient sequence with MRI in man to detect diffusion-weighted radiological contrast in differing directions and to look at its future role in clinical practice.
MOTION ARTIFACT
MR is generally a slow imaging method compared with X-ray methods. During the collection of the imaging data, motion of part or all of the patient will lead to artifactual changes in the image. If severe enough the resulting image will be un interpretable. The use of the pulsed gradient spin echo sequence compounds this problem. As the sequence is deliberately designed to detect microscopic motion it is very sensitive to any involuntary or voluntary motion. In particular even with a compliant volunteer, the normal brain pulsation is sufficient to
degrade the image.^
DIFFUSION IN PHYSIOLOGY AND NMR
concentration gradient will have a process of diffusion which will tend to equalise the concentrations of the relevant species. This concept of a transport process that leads to equilibration can be applied to other physical properties such as temperature, momentum, rotational energy or spin temperature (17). A second
facet of the diffusion process is the description of the transport process which exists in the absence of a concentration gradient to drive it i.e. self diffusion. In general the two processes can be characterised by a diffusion coefficient with the same value in the limit of a dilute solution.
The term diffusion is widely used in physiological sciences and is applied to a variety of transport processes (18). It is generally applied to one of the mechanisms whereby a particular substance such as an amino acid or oxygen is transported from regions of high to low concentration. This non-equilibrium behaviour, termed passive diffusion, is governed by the first Fick equation which relates the rate of change of concentration of the substance to the magnitude of the concentration gradient
and the diffusion coefficient; i.e. substances diffuse down their concentration gradients.
— .
le t. l>^L/yhuwi
^ ^
ùrU\i
jp<\iJ%i/^
lining for example. This can be tested by observing the effect of poisons such as cyanide on the observed rate of transport.
Passive diffusion can itself saturate if for example only
certain number of pores in an endothelial lining allow the transport process. In this case poisoning the system with metabolic poisons will not alter the observed rate.
The term self diffusion as used in NMR refers to the random motions of molecules arising from intermolecular collisions. This is an equilibrium process i.e. there is no concentration gradient and it results in a random walk by the test molecule through the surrounding medium. For pure liquids this will be purely related to the self diffusion constant D. The more complicated case of diffusion through a heterogeneous medium will be considered in some detail in Chapter 2 (page 47). NMR allows
the measurement of the so called apparent diffusion coefficient D* in a selected direction. To our knowledge no other technique
is capable of making a similar directional measurement.
DETAILS OF THE IMAGING EQUIPMENT
All the images of human subjects were obtained on a prototype Picker 0.15T super-conducting wide bore magnet. A modified gradient set with gradient strengths of 16mT/m was used
for most images. However a small gradient set was also employed at the end of the study to investigate the results of using larger pulsed gradient strengths, shorter pulse durations and
38 gradient set away from the bulk of the magnet is that eddy current problems are significantly reduced.
A quasi-spherical head receiver coil was used. The signal was amplified and the real and imaginary components filtered prior to sampling and digitising. With the longer echo times (130 and 200ms) maximum pre-amplification and machine gain were needed to observe the signal. The data could be displayed as magnitude data or as the real (X) and imaginary (Y) parts
separately.
Head fixation was of crucial importance as the pulsed gradient spin echo sequence is deliberately highly sensitized to motion in order to detect the diffusion effect. Fixation was initially achieved with firm foam pads placed between the head and the receiver coil. The coil itself was fixed in a moulded head rest with firm padding and velcro straps. Subsequently a deeper head rest was made and a Vacpak (evacuated polythene bag filled with polystyrene balls ) and restraining straps were used. The objective was to restrain the head without any undue pressure which would produce discomfort over the hour and a half of scanning time routinely employed for patients and volunteers.
Further modifications were considered. One option was to use a dental mould applied to the upper teeth and fixed to a bar across the head rest. This method had been developed for the purposes of producing a re-locatable stereotactic frame (19). It had been shown to fixate and relocate to high degrees of accuracy
CONTROL OF MOTION ARTIFACT
All sources of motion artefact had to be carefully assessed and measures taken to control the worst effects. All the scans were cardiac gated from the R wave with a delay that was adjusted to the heart rate. For a normal adult with a rate of 70-100min*’ a delay of 3 00 ms was used to ensure the data collection coincided with late diastole when the ballistic motion imparted to the brain was least. The sequence was triggered after two or more beats to bring the repetition time to more than 1,500ms to ensure enough time for Tl relaxation processes to be completed. For children and patients with a tachycardia these requirements necessitated triggering off every fourth beat with short delays from the R wave. Patients with atrial fibrillation or significant arrhythmias were unsuitable for scanning.
A number of motion control and compensation techniques have been developed for improving the quality of MR images (20-24), but none of them was available for this initial clinical study of ARDI. The proportion of examinations that resulted in technical
failure attributable to uncontrolled subject motion was therefore high («40%). Not withstanding this difficulty a substantial number of successful examinations were achieved and these enabled an initial assessment of the radiological potential of ARDI to be conducted.
GRADING OF MOTION ARTIFACT
40 were graded from 1-5. Grade 5 was little or no ghosting
artefact, grade 4 was moderate ghosting artefact but the image! was still interpretable, grade 3 was severe motion artefact and the image was not interpretable, grade 2 was the outline of the image could be discerned and grade 1 was no discernable image. At the end of each clinical chapter in this thesis the tables of gradings for the images used are given. Technical modifications to the sequences, machine, head restraint and gating procedures were quickly developing throughout the period of the clinical studies. These changes imposed constraints on the nature and form of the clinical studies. Overall there was a trend to better motion control with each modification to the head restraint was implemented which was reflected in a higher success rate in the number of interpretable images obtained. Particular problems with motion in the caudo-cephalic direction were discovered which will be discussed in more detail in the final conclusion.
IMAGE DISTORTION
NOVEL RADIOLOGICAL CONCEPTS
Three new radiological concepts are needed to interpret the images; molecular diffusion, directional contrast and anisotropy. Molecular diffusion or the intrinsic mobility alters the signal intensity of a spin echo. Increased molecular mobility results in a larger diffusion coefficient. The pulsed gradient spin echo sequence generates diffusion weighted images by detecting the movement of water molecules along specified directions. This leads to the second concept of directional contrast. The contrast between two tissues within a given diffusion weighted image depends on the direction of the applied pulsed gradients. No other radiological technique demonstrates such a property
The reciprocal of directional contrast is the property of anisotropy. This applies to quantities that vary with direction. Thus if one is in a moving crowd then walking with it is quicker than walking either against or across its prevailing direction. Ones speed of movement is anisotropic depending on which direction one chooses to go. In molecular terms the resistance to motion experiences by protons attached to water molecules depends on the permeability of cellular membranes and other intracellular constituents. This resistance depends on the underlying cellular structure and hence gives rise to directional contrast.
CONCLUSIONS
42 molecular diffusion is outlined. The physical basis of translational diffusion and the use of the same term in a physiological context is emphasised.
It is evident that the technical demands of the pulsed
gradient spin echo sequence require modifications to most imaging machines, particularly to the gradient coil system. The details of the whole body machine used in this thesis have been given. Despite the low value of its main field strength, and hence the signal, it was possible to detect diffusion weighted contrast. This was all the more remarkable as the application of the diffusion gradients both required the use of long echo times
(i.e. 130-200ms) and results in significant signal attenuation.
mobility in aqueous bovine serum albumen solutions. Biochim
43 REFERENCES
1. Purcell EM, Torrey HC, Pound RV. Resonance absorption by nuclear magnetic moment in a solid. Phy. Rev. 194 6; 69:37- 38.
2. Bloch F, Hansen WW, Packard M. The nuclear induction experiment. Phy. Rev. 1946; 70:474-485.
3. Abragam A. in The principles of nuclear magnetism. Oxford University press (Clarendon) London and New York 1961 p 4 .
4. Edzes HT, Samulski ET. Cross relaxation and spin diffusion in the proton nmr of hydrated collagen. Nature (London) 1977 ;265:521-522.
6. Hahn EL. Spin echoes. Phys. Rev. 1950; 80:580-594.
7. Carr HY, Purcell EM. Effects of diffusion on free
precession in nuclear magnetic resonance experiments. Phys. Rev. 1954; 94(3):630-638.
8. Woessner J. Constant gradient method. J. Phys. Chem. 1959;
23;231-245.
10. Stark DD, Bradley WG. Magnetic resonance imaging. The CV Mosby Company, St. Lewis, 1988 p3-21
11. Young IR, Bailes DR, Burl M et al. Initial clinical evaluation of a whole body nuclear magnetic resonance(NMR) tomograph. J. Comput. Assist. Tomogr. 1982; 6:1-18.
12. Lauterbur PC. Image formation by inducted local interactions; examples employing nuclear magnetic resonance. Nature 1973; 242:190-191.
13. Bydder GM, Butson PR, Harman RR, Gilderdale DJ, Young IR. Technical note Use of spherical receiver coils in magnetic resonance imaging of the brain. J. Comput. Assist. Tomogr. 1985; 9:413-414.
14. Damadian R, Zaner K, Hor D, Di Maio R. Human tumours detected by nuclear magnetic resonance. Proc. Natl. Acad. Sci. USA 1974 ,*71:1471-1473.
15. Just M Thale M. Tissue characterisation with Tl, T2 and proton density values: results in 160 patients with brain tumours. Radiology 1988; 169:779-785.
45
17. Moore WJ. In Physical Chemistry 5th Edition 1972 Longman (London) pl59-164.
18. Thomas DG, Gill SS, Wilson GB, Darling JL, Parkins CS. Use of re-locatable stereotactic frame to integrate positron emission tomography and computed tomography. Applications in human malignant brain tumours. Stereotact. Funct. Neurosurg. 1990 ;54-55:388-92.
19. Selkurt EE In Physiology 4th Edition 1976 Little Brown and Company Boston. plO-13.
20. Feinberg DA,Mark AS. Human brain motion and cerebrospinal fluid circulation demonstrated with mr velocity imaging Radiology 1987; 163:793-799.
21. Bailes DR, Gilderdale DJ, Bydder GM, Collins AG, Firmin DN. Respiratory ordered phase encoding (ROPE): A method for reducing respiratory motion artefact in MR imaging. JCAT 1985 ;9:835-838.
22. Pattany PM, Phillips JJ, Chiu LC, Lipcamon JD, Duerk JL, McNally JM, Mohapatra SN. Motion artefact suppression technique (MAST) for MR imaging. JCAT 1987;11:369-377.
23. Chenevert TL. Motion artifacts. I n : L e B i h a n D , e d . F u t u r e
D i r e c t i o n s i n M R I o f D i f f u s i o n a n d M i c r o c i r c u l a t i o n .
47 CHAPTER 2
DIFFUSION; THEORY AND MEASUREMENT USING NMR INTRODUCTION
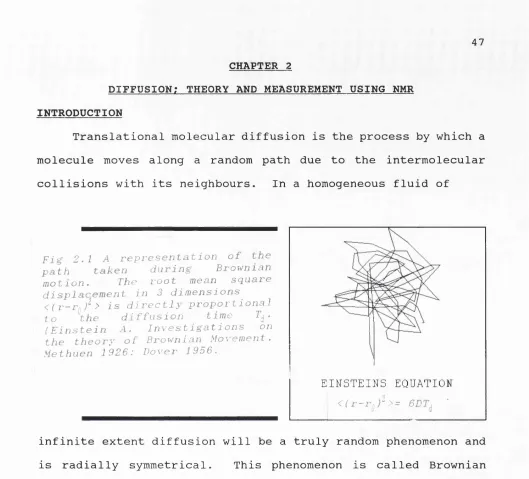
Translational molecular diffusion is the process by which a molecule moves along a random path due to the intermolecular collisions with its neighbours. In a homogeneous fluid of
Fig 2.1 A representation of the
path taken during Brownian
motion. The root mean square
displacement in 3 dimensions
< ( r - r r , ) ' h is directly proportional
to the diffusion time T^.
(Einstein A . Investigations on
the theory of Brownian M o v e m e n t . Methuen 1926: Dover 1956.
EI N S T E I N S E Q U A T I O N
< ( r - r J ‘^>= 6DT
considerations can be developed for other modes of molecular motion such as rotation and vibration.
In heterogeneous media such as solutions or in systems with more than one state of matter present, the analysis becomes more complicated and a number of molecular mechanisms may influence the observed diffusion coefficient. The extent to which water molecules diffuse in tissues is affected not just by the properties of the cytosol itself but also by the presence of cellular structures such as lipid membranes which provide barriers to free movement. Diffusion in these circumstances is said to be restricted as the molecules appear not to have moved as far as one would expect from consideration of the value of the self diffusion coefficient D(H2O) of pure water. It should be noted that the cytosol is not a dilute solution; hence some minor deviation from D(H2O) would be expected. In colloidal systems or
gels, diffusion may be vary markedly in different directions. A mathematical representation of this would require a tensor analysis for a full description of the diffusion behaviour.
In tissues which have a highly organised but asymmetric structure, diffusion may similarly be more restricted in one
direction than in another. The magnitude of this effect probably depends on the impedance to the mobility of water molecules.
49 ground substance as
well as the cell membranes that line the extracellu^ space.
\
There has been much debate about the capability of cell membranes to form an effective barrier to water d i f f u s i o n (2) . Analysis of this problem has used the T2 relaxation curves to determine if the
Dx= Derestricted)
Dy- Derestricted)
F i g 2 . 2 T h e p a t h w a y o f a t e s t m o l e c u l e i s s h o w n m o v i n g w i t h i n a w a t e r f i l l e d t u b e w i t h i m p e r m e a b l e w a l l s . D i f f u s i o n i s r e s t r i c t e d i n t h e X a n d Y b u t n o t t h e Z d i r e c t i o n .
signal arises from a single or multiple compartments in normal tissues. Neutron scattering studies of muscle by Hazelwood et al (3) have suggested that for this tissue any restriction if present must be small, at least for free translational diffusion of water, although the effect was probably larger for rotational
diffusion.
However in chronic multiple sclerotic plaques where water in the extracelluar space can be up to 68% of the total tissue water a clear bi-exponential decay of T2 has been observed (4). It is evident that exchange between the intracellular and extracelluar
the calculated apparent diffusion coefficient within the white matter of the central nervous system in man (5).
In this thesis it is demonstrated that the diffusion of water molecules across the axons of white matter tracts in man is more restricted than that along fibres i.e. the diffusion of water appears anisotropic. This property is used for the first
time as a radiological technique to map out both the normal and abnormal tracts within the human central nervous system by highlighting the constituent parts of the white matter. It is suggested that the site of restriction is probably the myelin sheath in normal brain and that this offers an opportunity to investigate demyelinating and dysmyelinating conditions. Additionally, in a number of pathologies, restricted diffusion or an apparent reduction in diffusion coefficient accompanies the changes.
RESTRICTED DIFFUSION
Diffusion is most appropriately described in statistical terms. We can define the conditional probability P(r„;r,t) as
the probability that a molecule initially at position r„ arrives at another position r after a time t. In a homogeneous fluid of infinite extent, P is a Gaussian function such that
P = (4#Dt)^^ exp {-(r-r„)^/4Dt} ... 2.1
P i c k ’s s e c o n d l aw of d i f f u s i o n s t a t e s that
C/f
*
i a%
'
J
u
M
u m
L X.
.
Solution of this equation, with the boundary conditions that C(t) is defined at all times t for the boundary of the domain through which the diffusion is taking place and the initial condition that C(x) is a specific value at t=0, leads to the distribution function given in equation 2.1 (page 50).
calculating the mean square distance from the integral
gives the Einstein equation for Brownian motion given in figure 2.1. (see Moore W J . Physical Chemistry 5th edition Longman pl61- 163.)
-I
mobility at the molecular level and varies inversely with viscosity. For pure water at 37°C, D=3. 4xlO'^mm^/s (7).
Since each molecule follows a random path, the distance travelled in any given time as a result of diffusion varies widely for different molecules. However it is useful to calculate the average distance 1 which molecules travel in a time t , and this is given by the solution of the " . equation in three dimensions, i.e.
1 = V e ^ ... 2.2
if motion in three dimensions is considered, and
1 = V2Dt ... 2.3
if movement in only one direction is considered.
When diffusion is restricted by barriers such as cell boundaries, P(r„;r,t) becomes geometry dependent and ceases to
be a pure Gaussian function of distance. In consequence the conventional definition of the diffusion coefficient breaks down since it is no longer simply a property of the diffusing medium. On very short time scales molecules diffuse as if they were in a homogeneous fluid, but over progressively longer times more and
^()re of them diffuse encounter a h a i f ^ ( I V l \ I C 1%
52 diffusion time) over which diffusion is monitored. Depending on the symmetry of the barriers to diffusion, D* may or may not be
directionally dependent. Whilst this phenomenon had been inferred from early measurements by Stejskal and Tanner using very strong gradients and extremely short duration pulses, it had not been demonstrated using an imaging instrument. It is the variation of D* as a function of direction within the MRI image
that allows the anisotropy of the lesion to be detected and white matter tracts to be identified.
The manner in which D* varies with Td depends on the nature
of the barriers including their geometry, permeability and spacing. However, in general D* is smaller than the unrestricted value of D and decreases monotonically from a value close to D for values of Td close to zero, to a small limiting value as Td tends to infinity. This decrease in D* with Td is the basic contrast mechanism in restricted diffusion imaging. By choosing the pulse timing of diffusion sensitive imaging sequences appropriately, Td can be selected to reveal highly restricted diffusion in some tissues or in a particular direction within a
tissue (D* small) while still retaining much less restricted
diffusion (D* relatively large) in other tissues or another
A P P A R E N T
D I F F U S I O N
C O N S T A N T
D e r e s t r i c t e d )
D I F F U S I O N T I M E T
F i g 2 , 3 T h e v a r i a t i o n o f a p p a r e n t d i f f u s i o n c o e f f i c i e n t w i t h t h e d i f f u s i o n t i m e T d . A t t h e s h o r t T d l i m i t D* = D ( H p ) , A t t h e l o n g T d l i m i t D* i s r e s t r i c t e d .
It should be noted that if restriction varies with direction it follows that anisotropic effects can be expected though they may be difficult to demonstrate.
DIFFUSION SENSITIVE SEQUENCES
Early measurements of diffusion employed a Hahn spin echo
collected in the presence of a constant applied gradient (Appendix 1 see page 254) . For a homogeneous liquid the amplitude of the echo is reduced by a factor R, (in addition to the usual Tj and T2 effects) given by (7)
54 where 7 is the magnetogyric ratio, G is the applied constant
field gradient, TE is the echo time and D* the apparent diffusion
coefficient. The nominal diffusion time (Td) is equal to TE/3 with this sequence, forming an undesirable link between signal attenuation due to restricted diffusion and that due to T2
relaxation.
In 1965 Stejskal and Tanner (8) introduced the pulsed gradient spin echo (PGSE) technique, in which sensitivity to diffusion was provided by magnetic field gradient pulses placed
EGG DELAY
EGG TRIGGER
/ / / — / / —
/ /
PULSED GRADIENT SEQUENCE
Te
Tp
À
180Tp
ECHO
TIME
F i g . 2 . 4 T h e p u l s e d g r a d i e n t s e q u e n c e w i t h t h e t i m i n g p a r a m e t e r s a n d p u l s e a m p l i t u d e s .
During the interval Td the molecules move by the process of diffusion. The 180° pulse is applied to generate a spin echo.
A second gradient pulse will introduce a phase shift in the opposite sense to that of the first pulse. If no motion takes place the two phase shifts are equal and opposite and there will be no resultant signal attenuation. Any movement of the nuclei during the interval Td will result in a failure of complete cancellation of the phase shifts and hence signal attenuation.
In the presence of any spatially varying magnetic field, random motion of protons in diffusing water molecules results in irreversible dephasing of the magnetic resonance signal producing a reduction in its amplitude. Since spatially varying magnetic fields are used for slice selection and spatial encoding in all magnetic resonance images, diffusion of water molecules results in a reduction in signal intensity in all images, although the effect is normally quite small. By deliberately applying large magnetic field gradients in particular directions, diffusion can be made the dominant image contrast mechanism, enabling
variations in diffusion to be visualised including their directional dependence.
Neglecting terms due to small conventional slice selecting and spatial encoding gradients, the diffusion attenuation factor R with this sequence is given by
R = exp {-y^^T^(A-Tp/3)D*} 2.4
56 where G is the amplitude of the gradient pulses, Tp is their duration and A is the time between their leading edges. For the POSE sequence Td=A-Tp/3. The composite parameter b (the diffusion sensitivity parameter) determines the overall signal attenuation (in conjunction with D*) and has units of s/mm^. This expression was used as the basis for the development of the Intravoxel Incoherent Motion (IVIM) (see page 70) method developed by Le Bihan et al (9).
The PGSE technique has a number of advantages over the constant gradient methods. It decouples diffusion contrast from T2 dependent contrast, since R no longer depends on TE. In addition, by using very narrow field gradient pulses (making Tp small in comparison to the average time required to diffuse between barriers) it enables the diffusion time to be determined precisely. This may be useful for measurement of barrier spacing and apparent diffusion coefficients (8).
Finally the use of pulsed gradients separates the diffusion sensitization from the applied radio-frequency (rf) pulses and the data acquisition, so allowing the diffusion weighting to be
changed without affecting other sequence properties such as slice thickness and pixel size. In clinical applications this is
perhaps the most significant advantage. Since the gradient available on standard imaging machines (typically up to about lOmT/m) necessitates the use of broad gradient pulses to achieve the required sensitivity, the PGSE may however in practice appear
APPLICATIONS TO BIOLOGICAL MATERIALS.
Spin echo methods have been used to look at self-diffusion in pure liquids and anisotropic diffusion of simple chemical systems such as benzene and other simple organic liquids (10). The method was then applied to a number of simple systems with restriction such as mica, yeast, apple, tobacco pith and octanol in water emulsion (8) . In their analysis Stejskal and Tanner (8) demonstrated that for simple systems the apparent diffusion coefficient varied predictably with the diffusion time. In the limit, as long as the pulse duration was small, a barrier spacing could be calculated. It is of interest that they demonstrated a degree of restricted diffusion in the octanol-water emulsion even though the permeability barrier was not insurmountable. It may be possible therefore that the biological cell membrane, though permeable, constitutes a sufficient barrier to diffusion of water molecules to give the appearance of restriction.
This is substantiated to a degree in a later paper by Tanner (11) who used the pulsed gradient sequence to look at the intra cellular diffusion coefficient of water and cell membrane permeabilities in human red blood cells, brine shrimps and lipid in human breast adipose tissue. He used a plot of D* versus Td to
58 A more sophisticated analysis of the effect of impermeable barriers of differing geometries on the constant gradient spin echo sequence has been developed by Neuman (12) who showed that for a spherical or cylindrical boundary to diffusion the attenuation factor depended on the fourth power of the radius. Thus NMR has considerable sensitivity to the spatial dimensions of the restriction environment. This analysis may need modification if the barriers are only partly impermeable.
CONCLUSION
This chapter has outlined the molecular basis of translational diffusion. It has considered the effect on the measured diffusion coefficient of barriers to free water mobility which may well be present in the biological system. It then outlined the reason for the development of the pulsed gradient sequence by Stejskal and Tanner in the early 1960's. Their theoretical analysis is discussed and outlined in Appendix 2 (see page 259) in which their expression for the diffusion time (Td)
REFERENCES
1. Feynman RP, Leighton RB, Sands M. In The Feynman lectures on physics. Addison Wesley 5th printing 1983 Vol 1 p6-5.
2. Le Bihan D, Turner R, Douek P. Is diffusion restricted in human brain. In: Abstracts of the 9th annual meeting of the Society of Magnetic Resonance in Medicine. Berkeley Calif.: Society of Magnetic Resonance in Medicine, 1990;p377.
3. Chang DC, Hazelwood BL, Nichols BL, Rorschach HE. Spin echo studies in cellular water. Nature(London) 1972; 235:170-171.
4. Barnes D, Munro PMG, Youl BD, Prineas JW, McDonald WI. The longstanding MS lesion: a quantitative MRI and electron microscopic study. Brain 1991 ,*114:1271-1280.
5. Thompson C, Henriksen O, Ring P. In vivo measurement of water self diffusion in the human brain by magnetic resonance imaging. Acta Radiologica Scand. 1987; 28: 353- 361.
6 . Moore W. In Physical Chemistry 5th Edition 1972 Longman (London) pl59-164.
60 8 . Stejskal EO, Tanner JE. Use of spin echo in pulsed magnetic
field gradient to study anisotropic restricted diffusion and flow. J. Chem. Phys. 1965; 43:3579-3603.
9. Le Bihan D, Lallemand D, Grenier P, Cabanis E, Laval-Jeantet M. MR imaging of intravoxel incoherent motions. Application to diffusion and perfusion in neurologic disorders. Radiology 1986; 161:401-407.
10. McCall JWM. Diffusion in liquids. J. Chem. Phys. 1959;55 :257-259.
11. Tanner JE. Intracellular diffusion of water. Arch. Biochem. and Biophys. 1983; 224:416-428.
CHAPTER 3
PLANT PHANTOM. ANIMAL AND EARLY HUMAN STUDIES INTRODUCTION
The potential of diffusion imaging became evident from the demonstration of unusual image contrast obtained in plant phantoms such as celery and in animal studies (1,2) using the pulsed gradient sequence. Moseley et al (2) demonstrated that diffusion weighted magnitude images showed two unusual effects. Firstly the vascular pattern of the plant material and the white matter of the cat could be selectively highlighted depending on the direction of the applied pulsed gradient. Secondly in the cat model of middle cerebral artery occlusion the images obtained using this sequence seemed to be more sensitive to the early development of the lesion than the T2 weighted image. Both these results were attributed to diffusion effects of water within the test tissue.
In order to confirm these findings and to obtain experience with the technique, in preparation for in vivo studies of human
subjects, the experiments on celery were reproduced on a 2.35 T small bore machine. Subsequently similar methods were used to see if directional contrast could be detected in man on the low field 0.15T whole body human imaging machine.
METHOD
MR proton imaging was performed using a Bruker AM-100 spectrometer in conjunction with an Oxford Instruments 2.35T