907 | P a g e
HYBRID MODELS FOR EFFICIENT CALCULATION
OF OMITTED VALUES
K.V.Prasad
1, G Sanjay Gandhi
2, Ch Kiran Kumar
3 1Professor, Dept of Computer Science and Engineering, TKRCET- Hyderabad
2Professor, Dept of Computer Science and Engineering,
Priyadarshini Institute of Technology and Management-Gunturu
3Asst. Professor, Dept of Computer Science and Engineering, Svist - Tiruvuru
ABSTRACT
Much work has studied the effect of different treatments of missing values on model induction, but little work has analyzed treatments for the common case of omitted values at prediction time. The previous models results show that for the two most popular treatments, each is preferable under different conditions. Strikingly the reduced-models approach, seldom mentioned or used, consistently outperforms the other two methods, sometimes by a large margin. The lack of attention to reduced modeling may be due in part to its (perceived) expense in terms of computation or storage. Therefore, we then introduce and evaluate alternative, hybrid approaches that allow users to balance between more accurate but computationally expensive reduced modeling and the other, less accurate but less computationally expensive treatments. The results show that the hybrid methods can scale gracefully to the amount of investment in computation/storage, and that they outperform imputation even for small investments.
Keywords: missing data, classification, classification trees, decision trees, imputation
I. INTRODUCTION OF HYBRID MODELS FOR EFFICIENT CALCULATION OF
OMITTED VALUES
The increase in accuracy of reduced modeling comes at a cost, either in terms of storage or of prediction-time computation (or both). Either a new model must be induced for every (novel) pattern of Omitted values encountered, or a large number of models must be stored. Storing many classification models has become standard practice, for example, for improving accuracy with classifier ensembles. Unfortunately, the storage requirements for full-blown reduced modeling become impracticably large as soon as the possible number of (simultaneous) Omitted values exceeds a dozen or so. The strength of reduced modeling in the empirical results presented above suggests its tactical use to improve imputation, for example by creating hybrid models that trade off efficiency for improved accuracy.
1.1 Likelihood-based Hybrid Solutions
One approach for reducing the computational cost of reduced modeling is to induce and store models for some subset of the possible patterns of Omitted features. When a test case is encountered, the corresponding reduced model is queried. If no corresponding model has been stored, the hybrid would call on a fallback technique: either incurring the expense of prediction-time reduced modeling, or invoking an imputation method (and possibly incurring reduced accuracy).
908 | P a g e
precompute parts of the network that pertain to a subset of frequently encountered cases so as to increase the expected speed of inference.
The horizontal, dashed line in Figure 1 shows the performance of pure predictive value imputation for the CalHouse data set. The lower of the two curves in Figure 1 shows the performance of a likelihood-based reduced-models/imputation hybrid. The hybrid approach allows one to choose an appropriate space-usage/accuracy tradeoff, and the figure shows that storing even a few reduced models can result in considerable improvement. The curve was generated as follows. Given enough space to store k models, the hybrid induces and stores reduced models for the top-k most likely Omitted -feature patterns, and uses distribution-based imputation for the rest. The Calhouse data set has eight attributes, corresponding to 256 patterns of Omitted features. We assigned a random probability of occurrence for each pattern as follows. The frequency of each pattern was drawn at random from the unit uniform distribution and subsequently normalized so that the frequencies added up to one. For each test instance we sampled a pattern from the resulting distribution and removed the values of features specified by the pattern.
Notice that for the likelihood-based hybrid the marginal improvement in accuracy does not de-crease monotonically with increasing model storage: the most frequent patterns are not necessarily the patterns that lead to the largest accuracy increases. Choosing the best set of models to store is a complicated optimization problem. One must consider not only the likelihood of a pattern of Omitted features, but also the expected improvement in accuracy that will result from including the corresponding model in the ―model base.‖ Calculating the expected improvement is complicated by the fact that the patterns of Omitted values form a lattice. For an optimal solution, the expected improvement for a given pattern should not be based on the improvement over using the default strategy (e.g., imputation), but should be based on using the next-best already-stored pattern. Determining the next-best pattern is a non-trivial estimation problem, and,
79
78
Reduced Models/Imputation Hybrid Prediction with Imputation
77 Expected Utility
A cc u ra cy 76 75 74 Cl as sif ic at io n 73 72 71 70 69 68
0 50 100 150 200 250 300
Number of models induced (for hybrid approaches)
Figure 1: Accuracies of hybrid strategies for combining reduced modeling and imputation. Storing
even a small fraction of the possible reduced models can improve accuracy considerably.
even if it weren't, the optimization problem is hard. Specifically, the optimal set of reduced models M
corresponds to solving the following optimization task:
!
argmax
M[
p
(
f
)
U
(
f
j
M
)]
f
s
:
t
:
t
(
f
m)
T
,
fm2M
where M is the subset of Omitted patterns for which reduced models are induced, t( f ) is the (marginal) resource usage (time or space) for reduced modeling with pattern f , T is the maxi-mum total resource usage allocated for reduced model induction, and U( f jM) denotes the utility from inference for an instance with pattern f given the set of reduced models in the subset M (when f 2 M the utility is derived from inference via the respective reduced model, otherwise the utility is derived from inference using the next-best already-stored pattern).
The upper curve in Figure 11 shows the performance of a heuristic approximation to a utility-maximizing hybrid. We estimate the marginal utility of adding a Omitted -feature pattern f as u( f ) = p( f ) (aˆrm( f ) aˆi( f )),
909 | P a g e
for f and aˆi( f ) is the estimated accuracy of a predictive value imputation model for Omitted pattern f . We
estimate aˆrm( f ) and aˆi( f ) based on cross-validation using the training data. The figure shows that even a
heuristic expected-utility approach can improve considerably over the pure likelihood-based approach.
1.2 Reduced-Feature Ensembles
The reduced-feature approach involves either on-line computation or the storing of multiple models, and storing multiple models naturally motivates using ensemble classifiers. Consider a simple
Reduced-Feature Ensemble (ReFE), based on a set R of models each induced by excluding a single attribute, where the cardinality of R is the number of attributes. Model i 2 R tries to capture an alternative hypothesis that can be used for prediction when the value for attribute vi, perhaps among others, is unknown. Because the
models exclude only a single attribute, a ReFE avoids the combinatorial space requirement of full-blown reduced modeling. When multiple values are Omitted , ReFE ensemble members rely on imputation for the additional Omitted values. We employ DBI.
More precisely, a ReFE classifier works as follows. For each attribute vi a model mi is induced with vi removed
from the training data. For a given test example in which the values for the set of attributes V are Omitted , for each attribute vi 2 V whose value is Omitted , the corresponding model mi is applied to estimate the (probability
of) class membership. To generate a prediction, the predictions of all models applied to a test example are averaged. When a single feature is Omitted , ReFE is identical to the reduced-model approach. The application of ReFE for test instances with two or more Omitted features results in an ensemble. Hence, in order to achieve variance reduction as with bagging, in our experiments training data are resampled with replacement for each member of the ensemble.
Table 1 summarizes the relative improvements in accuracy as compared to a single model using predictive value imputation. For comparison we show the improvements obtained by bagging alone (with imputation), and by the full-blown reduced-model approach. For these experiments we fixed the number of Omitted features to be three. The accuracies of ReFE and bagging are also plotted in Figure 2 to highlight the difference in performance across domains. Bagging uses the same number of models as employed by ReFE, allowing us to separate the advantage that can be attributed to the reduced modeling and that attributable to variance reduction. We see that ReFE consistently improves over both a single model with imputation (positive en-tries in the ReFE column) and over bagging with imputation. In both comparisons, ReFE results in higher accuracy on all data sets, shown in bold in Table 1, except Car; the 14-1 win-loss record is statistically significant with p < 0:01. The magnitudes of ReFE's improvements vary widely, but on average they split the difference between bagging with imputation and the full-blown reduced modeling. Note that although full-blown reduced modeling usually is more accurate, ReFE sometimes shows better accuracy, indicating that the variance reduction of bagging complements the (partial) reduced modeling.
The motivation for employing ReFE instead of the full-blown reduced-feature modeling is the substantially lower computational burden of ReFE as compared to that of reduced modeling. For a domain with N attributes, (2N 1) models must be induced by reduced modeling in order to match each possible Omitted pattern. ReFE induces only N models—one for each attribute. For example, the Calhouse data set, which includes only 8 attributes, required more than one-half hour to produce all the 256 models for full-blown reduced modeling. It took about a minute to produce the 8 models for the ReFE.
1.3 Larger Ensembles
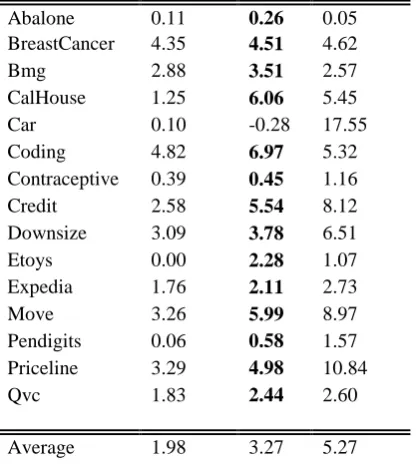
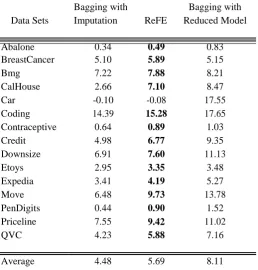
The previous results do not take full advantage of the variance reduction possible with large ensembles. Table 2 shows the percentage improvement in accuracy over a single model with imputation, for ReFE, bagging with imputation, and bagging of reduced models, each using thirty ensemble members. The ReFE ensembles comprise 10 reduced models for each Omitted feature, where each individual model is generated using sampling with replacement as in bagging.
Reduced
910 | P a g e
Abalone 0.11 0.26 0.05
BreastCancer 4.35 4.51 4.62
Bmg 2.88 3.51 2.57
CalHouse 1.25 6.06 5.45
Car 0.10 -0.28 17.55
Coding 4.82 6.97 5.32
Contraceptive 0.39 0.45 1.16
Credit 2.58 5.54 8.12
Downsize 3.09 3.78 6.51
Etoys 0.00 2.28 1.07
Expedia 1.76 2.11 2.73
Move 3.26 5.99 8.97
Pendigits 0.06 0.58 1.57
Priceline 3.29 4.98 10.84
Qvc 1.83 2.44 2.60
Average 1.98 3.27 5.27
Table 1: Relative improvements in accuracy for bagging with imputation and ReFE, as compared to a single model with imputation. Bold entries show the cases where ReFE improves both over using a single model with imputation and over bagging with imputation. For compar-ison, the rightmost column shows the improvements of full-blown reduced modeling. The ReFEs are more accurate than either a single model with imputation, or bagging with im-putation, while being much more efficient than reduced modeling in terms of computation and/or storage.
For control, for any given number of Omitted features in a test example, we evaluate the performance of bagging with the same number of individual models. Similarly, we generate a bagged version of the full-blown reduced model, with the same number of models as in the other approaches. As before, we fix the number of Omitted values in each test instance to three.
As expected, including a larger number of models in each ensemble results in improved perfor-mance for all treatments, for almost all data sets. The advantage exhibited by ReFE over bagging with imputation is maintained. As shown in Table 2. ReFE results in higher accuracy than bagging with imputation for all 15 data sets (statistically significant at p 0:01).
1.4 ReFEs with Increasing Numbers of Omitted Values
911 | P a g e
Figure 2: Relative improvement in accuracy (%) as obtained for bagging with imputation and ReFE, with respect to a single model with imputation
Bagging with Bagging with
Data Sets Imputation ReFE Reduced Model
Abalone 0.34 0.49 0.83
BreastCancer 5.10 5.89 5.15
Bmg 7.22 7.88 8.21
CalHouse 2.66 7.10 8.47
Car -0.10 -0.08 17.55
Coding 14.39 15.28 17.65
Contraceptive 0.64 0.89 1.03
Credit 4.98 6.77 9.35
Downsize 6.91 7.60 11.13
Etoys 2.95 3.35 3.48
Expedia 3.41 4.19 5.27
Move 6.48 9.73 13.78
PenDigits 0.44 0.90 1.52
Priceline 7.55 9.42 11.02
QVC 4.23 5.88 7.16
Average 4.48 5.69 8.11
912 | P a g e
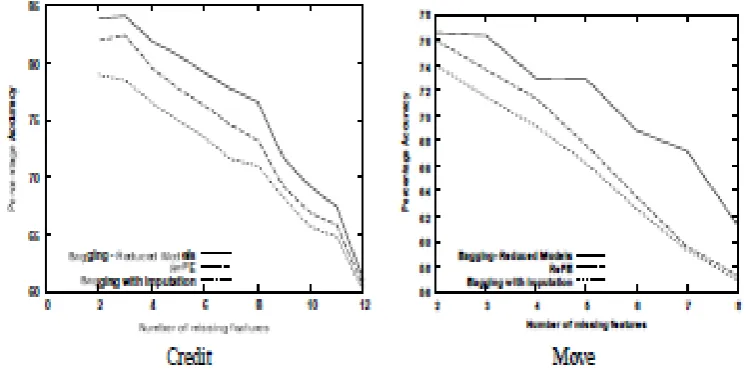
Figure 3: Performance of Omitted value treatments for small ensemble models as the number of Omitted values increases.
Figure 4: Performance of treatments for Omitted values for large ensemble models as the
number of Omitted values increases.
In sum, while using no more storage space than standard bagging, ReFE offers significantly better performance than imputation and than bagging with imputation for small numbers of Omitted values and hence provides another alternative for domains where full-blown reduced modeling (and especially reduced modeling with bagging) is impracticably expensive. Thus, in domains in which test instances with few Omitted values are frequent it may be beneficial to consider the use of ReFE, resorting to reduced modeling only for (infrequent) cases with many Omitted values.
Finally, as desired the ReFE accuracies clearly are between the extremes, trading off accuracy and storage/computation. Clearly, ReFE models could be parameterized to allow additional points on the tradeoff spectrum, by incorporating more reduced models. As in Section 1.1 we face a difficult optimization problem, and various heuristic approximations come to mind (e.g., somehow combining the models selected for storage in Section 1.1 ).
II. CONCLUSION
913 | P a g e
patterns. If run-time computation simply is not an option, then storage could be allocated to the most advantageous reduced models, and an imputation technique used otherwise. In the former case, the full accuracy of reduced modeling is maintained but both storage and run-time requirements are reduced from their extremes. In the latter case, accuracy is traded off for decreased storage and/or run time. The results show that even heuristic techniques for selecting the most advantageous reduced models can improve accuracy considerably. The issue of how best to choose the most advantageous reduced models is open. We also showed how ensemble methods can be modified to help deal with missing values—Reduced-Feature Ensembles—incorporating different reduced models.
Researchers and practitioners often face missing values when applying learned models. We hope this study provides a valuable step toward understanding how best to deal with them, and why.
REFERENCES
[1.] Gustavo E. A. P. A. Batista and Maria Carolina Monard. An analysis of four missing data treatment methods for supervised learning. Applied Artificial Intelligence, 17(5-6):519–533, 2003.
[2.] E. Bauer and R. Kohavi. An empirical comparison of voting classification algorithms: Bagging, boosting and variants. Machine Learning, 36(1-2):105–139.
A. Blum and T. Mitchell. Combining labeled and unlabeled data with co-training. In Proc. of the 11th Annual Conf. on Computational Learning Theory, pages 92–100, Madison, WI.
[3.] L. Breiman. Bagging predictors. Machine Learning, 24(2):123–140.
[4.] L. Breiman, J. H. Friedman, R. Olshen, and C. Stone. Classification and Regression Trees. Wadsworth and Brooks, Monterey, CA.
A. P. Dempster, N. M. Laird, and D. B. Rubin. Maximum likelihood from incomplete data via the EM algorithm. Journal of the Royal Statistical Society B, 39:1–38.
[5.] Y. Ding and J. Simonoff. An investigation of missing data methods for classification trees. Working paper 2006-SOR-3, Stern School of Business, New York University, 2006.
[6.] L. Getoor, N. Friedman, D. Koller, and B. Taskar. Learning probabilistic models of link structure. Journal of Machine Learning Research, 3:679–707, 2002.