Hydroxyurea and Growth in Young Children With
Sickle Cell Disease
WHAT’S KNOWN ON THIS SUBJECT: Growth impairment in sickle disease has been a consistentfinding in published reports. Hydroxyurea (HU) decreases vasoocclusive events and increases hemoglobin levels, which may improve growth. However, HU may adversely affect growth in young children by its effect on DNA synthesis.
WHAT THIS STUDY ADDS: Height, weight, and head circumference were normal in HU-treated children in the study as compared with the World Health Organization standards. Height, weight, and BMIzscores were similar in placebo and treatment groups. There were no harmful effects of HU on growth.
abstract
BACKGROUND:Growth impairment is a known complication of sickle cell disease. Effects of hydroxyurea (HU) on growth in very young chil-dren are not known.
METHODS: Height, weight, BMI, and head circumference (HC) were compared with World Health Organization (WHO) standards in BABY HUG, a multicenter, randomized, double-blinded, placebo-controlled 2-year clinical trial of HU in 193 children 9 to 18 months of age. An-thropometric data were closely monitored and converted toz scores by using WHO standardized algorithms for descriptive analyses. The treatment and placebo groups were compared longitudinally by using a mixed model analysis.
RESULTS:At entry, thezscores of BABY HUG children were higher than WHO norms. After 2 years of HU or placebo treatment, there were no significant differences between the groups, except for the mean HC
zscores at study exit (HU: +0.8 versus placebo: +1.0,P= .05). Baseline
z scores were the best predictors of z scores at study exit. The absolute neutrophil count, absolute reticulocyte count, and total white blood cell count had significant negative correlations with growth measures.
CONCLUSIONS:Both groups had normal or near normal anthropomet-ric measures during the study. The HCzscores at study entry and exit were slightly greater than WHO norms. Higher baseline white blood cell count, absolute reticulocyte count, and absolute neutrophil count were associated with poorer growth. The significance of the slightly lower HC in the treatment group at study exit is not clear. Trends toward normalization of weight and height and effects on HC will be monitored in ongoing BABY HUG follow-up studies. Pediatrics
2014;134:465–472
AUTHORS:Sohail Rana, MD,aPatricia E. Houston, MS,a
Winfred C. Wang, MD,bRathi V. Iyer, MD,cJonathan
Goldsmith, MD,dJames F. Casella, MD,eCaroline K. Reed,
MSN, FNP-BC,aZora R. Rogers, MD,fMyron A. Waclawiw,
PhD,dand Bruce Thompson, PhD,gfor the BABY HUG
Investigators
aDepartment of Pediatrics and Child Health, Howard University,
Washington, District of Columbia;bSt. Jude Children’s Research
Hospital, Memphis, Tennessee;cUniversity of Mississippi Medical
Center, Jackson, Mississippi;dNational Heart, Lung, and Blood
Institute, Bethesda, Maryland;eDivision of Hematology,
Department of Pediatrics, Johns Hopkins University, Baltimore, Maryland;fUT Southwestern Medical Center, Dallas, Texas; and gClinical Trials & Surveys Corporation, Owings Mills, Maryland
KEY WORDS
sickle cell disease, growth, hydroxyurea, children, height, weight, head circumference, BMI
ABBREVIATIONS
ANC—absolute neutrophil count ARC—absolute reticulocyte count
CSSCD—Cooperative Study of Sickle Cell Disease Hb—hemoglobin
HC—head circumference HU—hydroxyurea SCD—sickle cell disease WBC—white blood cell WHO—World Health Organization
(Continued on last page)
factors interact with influences from internal and external environments to regulate growth and account for a ma-jor portion of variation in growth within populations. The effects of sickle cell disease (SCD) on weight and height in children werefirst described more than half a century ago.1,2Previous studies
have revealed a consistent pattern of diminished growth among individuals with SCD from all regions of the world, with evidence linking growth failure to endocrine dysfunction, metabolic de-rangement, and nutrient deficiencies.3
The Cooperative Study of Sickle Cell Disease (CSSCD) data on growth and sexual maturation of more than 2000 children and young adults with various sickle genotypes revealed that individ-uals with HbSS and HbSb0thalassemia were smaller compared with those with HbSC and HbSb+ thalassemia. All 4 genotypes were below norms for Afri-can AmeriAfri-cans.4 Growth differences
were evident even in the youngest group of children (2–4 years old). Numerous other studies have confirmed these observations.1,2,5–16 Al-Saqladi et al3
reviewed 46 studies of anthropometric parameters, body composition, energy metabolism, micronutrient deficiency, and endocrine dysfunction in individu-als with SCD. There was a consistent pattern of growth failure among af-fected individuals from all geographic areas. In a recent prospective longitu-dinal study of 148 children with SCD who were evaluated for 4 years, height, weight, or BMI declined in 84% of sub-jects; 38% fell below thefifth percentile on Centers for Disease Control and Prevention growth curves in 1 or more measures.17
In the Stroke Prevention Clinical Trial for Sickle Cell Anemia, individuals receiving chronic transfusion therapy for 2 years had improved growth velocities that were
Hydroxyurea (HU) decreases the fre-quency of acute vasoocclusive events and improves hematologic parameters in SCD; however, it is not clear if it also improves growth. A phase I-II safety study of HU (HUG KIDS) compared 68 children ages 5 to 16 years at baseline with historical controls from the CSSCD and revealed improvement in weight, but no significant improvement in height percentiles.19 In a comparison between
healthy controls and 41 children with SCD who had received HU for at least 2 years, there was significant improvement in aerobic exercise tolerance, but the mean values for weight, height, and lean body mass were all lower in the children with SCD.20 Most studies have either used
controls from the local population or NHANES data. Only 1 recent study used World Health Organization (WHO) growth data as a comparison group.9
BABY HUG was a clinical trial of treat-ment with HU in young children with SCD. Careful serial growth measure-ments were included as a safety out-come because of concerns regarding potential adverse effects of HU on growth in very young children. These concerns stemmed from unpublished but widely disseminated animal data suggesting that HU may have a delete-rious effect on the growth and de-velopment of the brain.
METHODS
In 2003, the BABY HUG study, a double-blind, multicenter, placebo-controlled clinical trial of HU, was initiated, and 193 eligible infants 9 to 18 months of age with HbSS or HbSb0 thalassemia (en-rolled from 2003 to 2007) were ran-domly assigned to 24 months of treatment with HU or placebo. The primary end points of the study were preservation of spleen and renal func-tion. Evaluation of growth parameters
signing this trial, and main results of the study have been reported in de-tail.21,22 This article summarizes the
analyses of the anthropometric data collected from the children enrolled in BABY HUG.
All measurements were obtained in duplicate by trained study coordinators using standardized techniques. Mea-surements were obtained at screening, treatment initiation, 2 weeks, 4 weeks, 6 weeks, and 8 weeks, and then every 4 weeks thereafter. If predefined tox-icities occurred, study visits were conducted every 2 weeks.
Weight, without clothing, was measured in study participants up to 12 months of age by using a pan-type balance scale, with a beam balance or electronic re-cording. Subjects older than 12 months who could stand were weighed on a lev-eled platform scale, without clothing or in light clothing. Two measurements were made, with a third being obtained if the first 2 differed by more than 100 g. Recumbent length was obtained in children up to 18 months of age, with standing height measured after 18 months. Recumbent length was mea-sured by using a measuring board with afixed headboard and moveable foot-board, with centimeter markings. Two measurements were made, with a third being obtained, if thefirst 2 differed by more than 0.5 cm.
A plastic measuring tape that was not subject to stretching was used in the study to measure head circumference (HC). Two measurements were made, with a third being obtained if thefirst 2 differed by more than 0.4 cm. Every effort was made to circumvent the problems associated with braiding or other hair styles.
American Academy of Pediatrics for children younger than 2 years of age.23
The WHO data are intended to reflect optimal growth and are based on a high quality study from selected ethnically diverse communities world-wide. Growth charts such as those based on NHANES are actually refer-ences and not standards, and describe how certain children grew in a partic-ular place and time, whereas WHO normative data are intended to provide universal standards.
Zscores for height, weight, BMI, and HC were calculated by using SAS (SAS In-stitute, Inc, Cary, NC) macros down-loaded from the WHO Web site.24Each Zscore calculation was controlled for gender and age (in days) when making the calculation from the WHO standard population. BABY HUG growth data were averaged within each 3-month interval after treatment assignment (eg, 0–3 months, 3–6 months, etc), with the baseline measurement being used as the time 0 measurement.
Baselinezscores were compared with the WHO norms by testing whether the meanzscore was equal to zero, versus the alternative that it was not equal to zero, using student’sttest. All longitu-dinal data were analyzed by using Proc MIXED, with an autoregressive co-variance structure used to account for the covariance between each serial measurement. Covariables included in each analysis were the baseline measurements of the following: the outcome being reviewed, time in months since enrollment, hemoglobin (Hb) level, absolute reticulocyte count (ARC), total white blood cell (WBC) count, and absolute neutrophil count (ANC). Backward elimination (using 0.05 as the significance level) for the Hb, ARC, WBC count, and ANC covari-ables was used to arrive at the final model for each outcome measure.
Simple Pearson correlations between each outcome measure (at each time
point) and the corresponding baseline measurement of Hb, ARC, WBC count, and ANC were made by using Proc CORR. All analyses used SAS version 9.2.
RESULTS
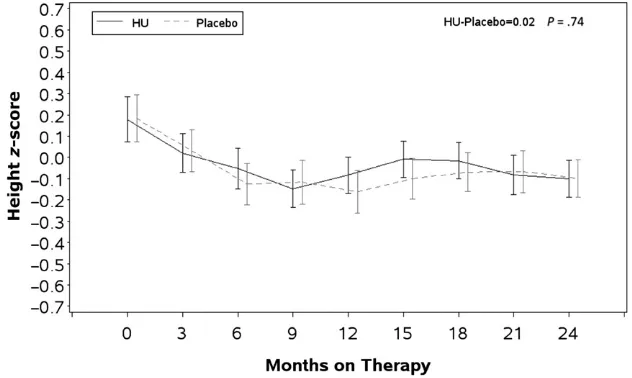
All 193 randomized children were in-cluded in the analysis. See Table 1 for demographic information. Unadjusted mean Z scores and SEs for height at baseline and for each 3-month interval are presented by randomized study as-signment in Fig 1. There was no signifi -cant difference in growth trajectories between the 2 treatment groups (P= .7). The baseline heightzscores were slightly, but significantly greater than the WHO norm and were positively correlated with all subsequently measured height z
scores. The baseline ANC in both groups was negatively correlated with height over the course of the study (P= .004).
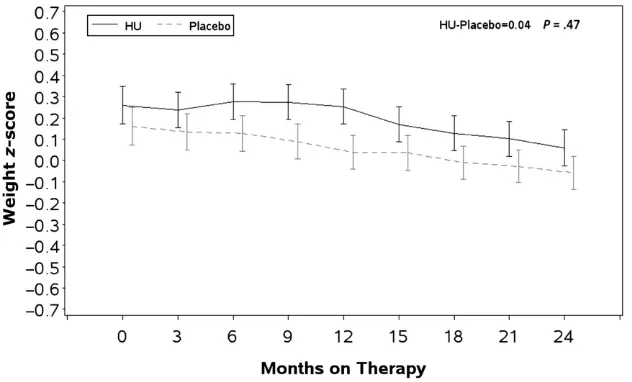
Baseline weight zscores in both treat-ment groups were also higher than the WHO norms and were positively
corre-lated with all subsequent measure-ments. Unadjusted meanz scores and SEs for weight at baseline and for each 3-month interval are presented by study group in Fig 2. There were no significant differences in the HU and placebo tra-jectories over time (P= .43). Higher WBC count and ARC were negatively corre-lated with weightzscores.
The mean baseline BMI z score was higher in the HU treatment group compared with the placebo group, and both measurements were greater than the WHO norm (HU: +0.220 and placebo: +0.086). Unadjusted meanzscores and SEs for BMI at baseline and for each 3-month interval are presented by study group in Fig 3. In both groups, the baseline BMI was positively and the WBC count and ARC were negatively correlated to the BMIz scores during and at the end of treatment. A general quadratic trend (with a single concav-ity as compared with linear) was ap-parent for the BMI z scores. Once
FIGURE 1
Longitudinal comparison of WHO standardized heightzscores between children treated with HU and placebo.Zscores for height, weight, BMI, and HC were calculated by using SAS macros downloaded from the WHO Web site and controlled for gender and age. Data were averaged within each 3-month interval after treatment assignments with the baseline measurement used as the time 0. Student’s ttest was used for comparison with the WHO normal population. Proc MIXED was used to analyze longitudinal data. BABY HUG children were larger than the WHO population on all parameters at the beginning of the study, and there was no difference between the treatment groups except for the BMI that was larger at each observation point in the HU group (trend not significant). There were no significant differences between the treatment groups for height, weight, and BMI at exit. The HC in the treatment group was slightly smaller but still within normal limit at the end of the study. Baseline zscores were the best predictors ofzscores for all growth parameters.
adjusted for the difference in the baseline measurements, there was no statistically significant difference in the 2 trajectories (P= .7).
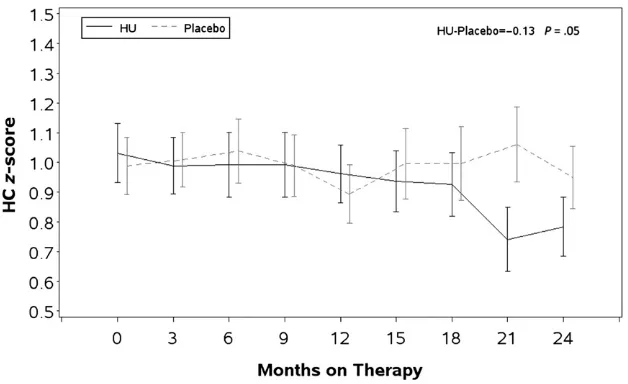
Unadjusted meanzscores and SEs for HC at baseline and for each 3-month interval are presented by study group in Fig 4. The mean HCz scores were higher than the WHO standards in both groups at baseline (HU: 1.031 and pla-cebo: 0.989). The baseline HCz score was the most significant predictor of HC during and at the end of treatment. The trajectory of HCzscores was lower in the HU treatment group compared with placebo (HU: 0.852 versus placebo: 0.968,P= .05) after adjusting for the baseline difference in HCzscores be-tween the HU and placebo groups. The ANC was negatively correlated with HC
zscores during and after treatment.
On average, children enrolled in BABY HUG were larger than the WHO refer-ence population with respect to height,
weight, BMI, and HC at the beginning of the study. HU treatment was associated with a slightly lower HC over the time course of treatment. The analysis of variance for each of the above analyses is presented in Supplemental Tables 5– 8 for this article. During the trial, each child was evaluated to determine if he or she ever crossed downward over 2 major percentiles of the WHO growth curves (defined as the 95, 75, 50, 25, 10, 5, and 1.5th percentiles) or crossed below the 1.5th percentile. In all, one-quarter to one-fifth of the children were observed to have one of these events (height: 27%; weight: 19%; and HC: 21%), with most occurrences at-tributable to crossing 2 major percen-tiles of the growth curves. There was no statistically significant difference between HU and placebo-treated chil-dren in the number of times a major percentile was crossed.
In addition,“normal”growth curves for height, weight, BMI, and HC of 1- to
3-year-cebo group and are presented in the Supplemental Materials.25These growth
curves may be useful as historical con-trols for future comparisons of thera-peutic interventions.
DISCUSSION
Growth impairment is a known compli-cation of SCD. The CSSCD growth curves for individuals with sickle hemoglobin-opathies were significantly different from the published norms for African Ameri-cans, and HbSS and HbSb0thalassemia individuals were smaller than those with HbSC and HbSb+ thalassemia. Since publication of the CSSCD data, several other studies have revealed that children and adolescents with SCD had signifi -cantly lower height, weight, and BMI com-pared with reference growth curves.9–16
In general the adverse influence of SCD has been more pronounced for weight than height. Endocrine dysfunction, poor nutrient intake, micronutrient defi cien-cies, hypermetabolism, and high protein turnover have been described in individ-uals with SCD and growth failure.26–31
Growth hormone deficiency may ac-count for a small percentage of chil-dren with SCD who have severe growth delay.32 Hemolysis, chronic anemia,
and a high metabolic rate appear to be the most significant adverse factors for growth in SCD. Resting energy ex-penditure was increased in several studies of children with SCD and is probably related to anemia, chronic inflammation, high cardiac output, and high protein turnover.33–35Interventions
that decrease anemia and inflammation may have a beneficial effect on growth as well. HU has modest effects on the severity of hemolysis and anemia and may also decrease inflammation. Therefore, it is reasonable to hypothe-size that HU could have a positive in-fluence on growth.36
FIGURE 2
Although spleen and kidney function were the primary end points of the BABY HUG trial, assessments of growth were important secondary end points and a safety measure due to concerns that HU might have an adverse effect on growth.22 At study entry, BABY HUG
children were generally similar but slightly larger than the WHO standard population for height, weight, and BMI, while having significantly larger HC. During the study, there was a downward percentile trend for weight in both treatment and placebo groups; none-theless, the mean z scores remained close to the WHO norms, suggesting that there was no significant impairment of overall growth in either group by study end. In addition, there were no signifi -cant differences for height, weight, and BMI based on study treatment.
The HC was significantly larger in children enrolled in BABY HUG and remained so throughout the study pe-riod. Measurement of HC in African American children is challenging, be-cause of hair styles that may include braids, dreadlocks, beads, etc. It is possible that the overall larger HC throughout the study may have resulted from these hair styles, although ex-aminers were specifically trained to minimize the effect of hair style on HC. Oro-facial and cranio-skeletal abnor-malities that may contribute to HC have been described in individuals with SCD and are frequently the result of marrow hyperplasia.37–39 Even though the
dif-ference was small, the HC percentile was lower in the HU treatment group by the end of the study, possibly as a result of suppression of bone mar-row hyperplasia. Nonetheless, the HC remained well above the WHO 50th percentile standard. Further evalua-tion of children in the ongoing BABY HUG follow-up studies will be neces-sary to determine if this effect persists and assess its significance.
FIGURE 3
Longitudinal comparison of WHO standardized BMIzscores between children treated with HU and placebo.Zscores for height, weight, BMI, and HC were calculated by using SAS macros downloaded from the WHO Web site and controlled for gender and age. Data were averaged within each 3-month interval after treatment assignments with the baseline measurement used as the time 0. Student’s ttest was used for comparison with the WHO normal population. Proc MIXED was used to analyze longitudinal data. BABY HUG children were larger than the WHO population on all parameters at the beginning of the study, and there was no difference between the treatment groups except for the BMI that was larger at each observation point in the HU group (trend not significant). There were no significant differences between the treatment groups for height, weight, and BMI at exit. The HC in the treatment group was slightly smaller but still within normal limit at the end of the study. Baseline zscores were the best predictors ofzscores for all growth parameters.
FIGURE 4
Longitudinal comparison of WHO standardized HCzscores between children treated with HU and placebo.Zscores for height, weight, BMI, and HC were calculated by using SAS macros downloaded from the WHO Web site and controlled for gender and age. Data were averaged within each 3-month interval after treatment assignments with the baseline measurement used as the time 0. Student’s ttest was used for comparison with the WHO normal population. Proc MIXED was used to analyze longitudinal data. BABY HUG children were larger than the WHO population on all parameters at the beginning of the study, and there was no difference between the treatment groups except for the BMI that was larger at each observation point in the HU group (trend not significant). There were no significant differences between the treatment groups for height, weight, and BMI at exit. The HC in the treatment group was slightly smaller but still within normal limit at the end of the study. Baseline zscores were the best predictors ofzscores for all growth parameters.
weight or linear growth of infants. Their growth parameters were normal and comparable to the WHO standards. Al-though our preliminary analysis dem-onstrated higher weightzscores in the treatment group compared with the placebo group, this difference lost significance after accounting for dif-ferences in weight at baseline.
In the BABY HUG trial, HU treatment was associated with a decreased rate of clinical events and improved hemato-logic profile.21Clinical events and
dis-ease severity have been considered an important reason for poor growth in children with SCD; however, in this study, the decrease in clinical events with HU treatment did not produce a significant difference in growth parameters between the 2 treatment arms.17The association of high ANC and
WBC counts with lower height and weight in this study potentially supports an important role of inflammation as both increased WBC count and ANC are associated with inflammation and a higher rate of complications in per-sons with SCD. Alternatively, these parameters may simply be markers of more severe disease.40
This study has several limitations. A standard dose of HU of 20 mg/kg was used throughout the BABY HUG study. This dose was chosen because of its demonstrated safety in this age group in preliminary studies and because a rel-atively lowfixed dose was expected to reduce the likelihood of toxicity.41Many
pediatric hematologists in the United States treat children with SCD with higher doses of HU, up to 35 mg/kg. A higher dose is more likely to increase HbF, decrease chronic hemolysis, and possibly reduce inflammation as well; therefore, it is possible that a higher dose of HU may have greater impact on growth parameters. Also, the better
are puzzling. BABY HUG children were seen frequently, and there was intense monitoring of growth parameters at the central study coordinating site, because of concerns regarding safety. These repeated measurements could have raised awareness of parents and care-takers regarding the potential of early growth failure and thus produced an increased focus on nutrition. Perhaps this dampened any growth differences between those in the 2 arms of the trial. We are not aware of any studies that have looked at the effects of frequent clinic visits and close central monitor-ing of growth parameters in individuals with chronic illness; however, frequent visits have been shown to have favor-able effects on other health outcomes, such as improved HbA1c levels in indi-viduals with type 2 diabetes and hy-pertension.42–44 More frequent study
visits (required for dosage titration in some subjects) were associated with better adherence to medications in BABY HUG.45
CONCLUSIONS
We saw no clinically significant differ-ences in height, weight, or BMI between the HU and placebo treated groups demonstrating the lack of harmful effects on growth due to HU treatment of 2 years starting at a young age. It is important to note that the height, weight, BMI, and HC were all either normal or close to normal in both treatment groups compared with the WHO standards, possibly impeding any demonstration of additional benefit from HU. There were no significant differences between treatment groups for any of the growth measures, except for HC. Increased WBC count, ARC, and ANC that have been associated with more severe disease in other studies were associated with significantly
de-up of these children is continuing, and it remains to be seen if normal growth patterns will persist in these ongoing studies, which are characterized by less frequent visits, but generally higher milligram per kilogram doses of HU.
ACKNOWLEDGMENTS
We thank the following BABY HUG per-sonnel at the participating clinical cen-ters and the Medical Coordinating Center: Children’s National Medical Cen-ter: Catherine Driscoll, MD, Caterina Minniti, MD, Brenda Martin, MSN, CPNP,
Barbara Speller-Brown, MSN, and
Kimberly Whelan, MD, and Roy McDonald, MPH; Drexel University: Carlton Dampier, MD, Lori Luck, MD, Mary Lou MacDermott, CRNP, Maureen Meier, RN, and Michele Cahill; Emory University School of Medi-cine: R. Clark Brown, MD, PhD, Ifeyinwa Osunkwo, MD, MPH, Ellen Debenham, RN,
Leann Hassen, MPH, and Terrell Faircloth; Children’s Hospital of Michigan: Sharada Sarniak, MD, Wanda Whitten-Shurney, MD, Mary Murphy, MSN, CNP, Madhvi Pajpurkar, MD, and Kristin Storie-Kennedy, RN; and Clinical Trials & Surveys Corp: Zhibao Mi, PhD, Zhaoyu Luo, PhD, Xiangke
Huang, MS, Billie Fish, CCRP, and Anne Martien, MBA, CCRP, CRCP.
We acknowledge the efforts of the BABY HUG subjects and their families and the contributions of all who participated in BABY HUG (http://www.c-tasc.com/cms/ StudySites/babyhug.htm).
REFERENCES
1. Jimenez CT, Scott RB, Henry HL, Sampson CC, Ferguson AD. Studies in sickle cell anemia. XXVI. The effects of homozygous sickle cell disease on the onset of menarche, pregnancy, fertility, pubescent changes, and body growth in Negro subjects.Am J Dis Child. 1966;111:497–504
2. Scott RB, Ferguson AD, Jenkins ME, Clark HM. Studies in sickle-cell anemia. VIII. Fur-ther observations on the clinical manifes-tations of sickle-cell anemia in children. AMA Am J Dis Child. 1955;90(6):682–691
3. Al-Saqladi AW, Cipolotti R, Fijnvandraat K, Brabin BJ. Growth and nutritional status of children with homozygous sickle cell dis-ease.Ann Trop Paediatr. 2008;28(3):165–189
4. Platt OS, Rosenstock W, Espeland MA.
In-fluence of sickle hemoglobinopathies on growth and development. N Engl J Med. 1984;311(1):7–12
5. Whitten CF. Growth status of children with sickle-cell anemia.Am J Dis Child. 1961;102: 355–364
6. McCormack MK, Dicker L, Katz SH, et al. Growth patterns of children with sickle-cell disease.Hum Biol. 1976;48(3):429–437
7. Lowry MF, Desai P, Ashcroft MT, Serjeant BF, Serjeant GR. Heights and weights of Jamaican children with homozygous sickle cell disease.Hum Biol. 1977;49(3):429–436
8. Luban NLC, Leikin SL, August GA. Growth and development in sickle cell anemia. Preliminary report.Am J Pediatr Hematol Oncol. 1982;4(1):61–65
9. Al-Saqladi AW, Bin-Gadeen HA, Brabin BJ. Growth in children and adolescents with sickle cell disease in Yemen. Ann Trop Paediatr. 2010;30(4):287–298
10. Mukherjee MB, Gangnkhedkar RR. Physical growth of children with sickle cell disease. Indian J Hum Genet. 2004;10:70–72
11. Osei-Yeboah C, Rodrigues O, Enweronu-Laryea C. Nutritional status of children with sickle cell disease at Korle Bu Teaching Hospital, Accra, Ghana. West Afr J Med. 2011;30(4):262–267
12. Thomas PW, Singhal A, Hemmings-Kelly M, Serjeant GR. Height and weight reference
curves for homozygous sickle cell disease. Arch Dis Child. 2000;82(3):204–208
13. Silva CM, Viana MB. Growth deficits in children with sickle cell disease.Arch Med Res. 2002;33(3):308–312
14. Singhal A, Thomas P, Cook R, Wierenga K, Serjeant G. Delayed adolescent growth in homozygous sickle cell disease. Arch Dis Child. 1994;71(5):404–408
15. Rhodes M, Akohoue SA, Shankar SM, et al. Growth patterns in children with sickle cell anemia during puberty.Pediatr Blood Can-cer. 2009;53(4):635–641
16. Isah HO, Oche MO, Ibrahim KO, Gande-Isa S. Anthropomorphic profiles of homozygous sickle cell children in north-western Nigeria: findings from Usmanu Danfoiyo University Teaching Hospital, Sokoto, Nigeria. Sahel Med Journal. 2008;11(2):45–48
17. Zemel BS, Kawchak DA, Ohene-Frempong K, Schall JI, Stallings VA. Effects of delayed pubertal development, nutritional status, and disease severity on longitudinal pat-terns of growth failure in children with sickle cell disease.Pediatr Res. 2007;61(5 pt 1):607–613
18. Wang WC, Morales KH, Scher CD, et al; STOP Investigators. Effect of long-term trans-fusion on growth in children with sickle cell anemia: results of the STOP trial. J Pediatr. 2005;147(2):244–247
19. Wang WC, Helms RW, Lynn HS, et al. Effect of hydroxyurea on growth in children with sickle cell anemia: results of the HUG-KIDS Study.J Pediatr. 2002;140(2):225–229
20. Wali YA, Moheeb H. Effect of hydroxyurea on physical fitness indices in children with sickle cell anemia.Pediatr Hematol Oncol. 2011;28(1):43–50
21. Wang WC, Ware RE, Miller ST, et al; BABY HUG investigators. Hydroxycarbamide in very young children with sickle-cell anae-mia: a multicentre, randomised, controlled trial (BABY HUG). Lancet. 2011;377(9778): 1663–1672
22. Thompson BW, Miller ST, Rogers ZR, et al. The pediatric hydroxyurea phase III clinical trial (BABY HUG): challenges of study
de-sign.Pediatr Blood Cancer. 2010;54(2):250– 255
23. Grummer-Strawn LM, Reinold C, Krebs NF;
Centers for Disease Control and Prevention (CDC). Use of World Health Organization
and CDC growth charts for children aged 0-59 months in the United States. MMWR Recomm Rep. 2010;59(RR-9):1–15
24. World Health Organization. SAS macros.
Avail-able at: www.who.int/childgrowth/softward/ en/. Accessed July 7, 2014
25. Cole TJ, Green PJ. Smoothing reference centile curves: the LMS method and
pe-nalized likelihood. Stat Med. 1992;11(10): 1305–1319
26. Luporini SM, Bendit I, Manhani R, Bracco OL, Manzella L, Giannella-Neto D. Growth
hormone and insulin-like growth factor I axis and growth of children with different
sickle cell anemia haplotypes. J Pediatr Hematol Oncol. 2001;23(6):357–363
27. Kawchak DA, Schall JI, Zemel BS, Ohene-Frempong K, Stallings VA. Adequacy of
di-etary intake declines with age in children with sickle cell disease. J Am Diet Assoc.
2007;107(5):843–848
28. Barden EM, Kawchak DA, Ohene-Frempong K, Stallings VA, Zemel BS. Body composition in children with sickle cell disease. Am J
Clin Nutr. 2002;76(1):218–225
29. Dekker LH, Fijnvandraat K, Brabin BJ, van Hensbroek MB. Micronutrients and sickle cell disease, effects on growth, infection and
vaso-occlusive crisis: a systematic review. Pediatr Blood Cancer. 2012;59(2):211–215
30. Prasad AS. Discovery of human zinc
de-ficiency: 50 years later.J Trace Elem Med Biol. 2012;26(2–3):66–69
31. Cox SE, Makani J, Fulford AJ, et al. Nutritional status, hospitalization and mortality among
patients with sickle cell anemia in Tanzania. Haematologica. 2011;96(7):948–953
32. Nunlee-Bland G, Rana SR, Houston-Yu PE, Odonkor W. Growth hormone deficiency in patients with sickle cell disease and growth failure.J Pediatr Endocrinol Metab.
2004;17(4):601–606
energy expenditure in sickle cell disease. Am J Physiol. 1998;274(2 pt 1):E357–E364
34. Akohoue SA, Shankar S, Milne GL, et al. Energy expenditure, inflammation, and oxidative stress in steady-state adolescents with sickle cell anemia.Pediatr Res. 2007;61(2):233–238
35. Hibbert JM, Creary MS, Gee BE, Buchanan ID, Quarshie A, Hsu LL. Erythropoiesis and myocardial energy requirements contrib-ute to the hypermetabolism of childhood sickle cell anemia.J Pediatr Gastroenterol Nutr. 2006;43(5):680–687
36. Fung EB, Barden EM, Kawchak DA, Zemel BS, Ohene-Frempong K, Stallings VA. Effect of hydroxyurea therapy on resting energy ex-penditure in children with sickle cell disease. J Pediatr Hematol Oncol. 2001;23(9):604–608
794283
38. Javed F, Correa FO, Nooh N, Almas K, Romanos GE, Al-Hezaimi K. Orofacial mani-festations in patients with sickle cell dis-ease.Am J Med Sci. 2013;345(3):234–237
39. Martinoli C, Bacigalupo L, Forni GL, Balocco M, Garlaschi G, Tagliafico A. Musculoskele-tal manifestations of chronic anemias. Semin Musculoskelet Radiol. 2011;15(3): 269–280
40. Miller ST, Sleeper LA, Pegelow CH, et al. Prediction of adverse outcomes in children with sickle cell disease.N Engl J Med. 2000; 342(2):83–89
41. Wang WC, Wynn LW, Rogers ZR, Scott JP, Lane PA, Ware RE. A two-year pilot trial of hydroxyurea in very young children with
ter frequency and serum glucose level, blood pressure, and cholesterol level con-trol in patients with diabetes mellitus.Arch Intern Med. 2011;171(17):1542–1550
43. Turchin A, Goldberg SI, Shubina M, Einbinder JS, Conlin PR. Encounter frequency and blood pressure in hypertensive patients with diabetes mellitus.Hypertension. 2010; 56(1):68–74
44. Guthmann R, Davis N, Brown M, Elizondo J. Visit frequency and hypertension. J Clin Hypertens (Greenwich). 2005;7(6):327–332
45. Thornburg CD, Rogers ZR, Jeng MR, et al; BABY HUG Investigators. Adherence to study medication and visits: data from the BABY HUG trial.Pediatr Blood Cancer. 2010;54(2): 260–264
(Continued fromfirst page)
Dr Rana contributed to the design of the BABY HUG study, acquisition of data, analysis and interpretation of data, drafting and revising the manuscript, and approval and accountability for the work; Ms Houston contributed to the study design, data acquisition, regulatory matters, drafting and revising the manuscript, and accountability for the work; Dr Wang and Dr Iyer contributed to the design of the BABY HUG study, acquisition of data, analysis and interpretation of data, revising the manuscript,final approval, and accountability for the work; Dr Goldsmith contributed to data analysis and interpretation of data, numerous critical revisions/ critiques of the article,final approval, and agreed to be accountable for all aspects of the work including resolution of queries; Dr Casella contributed to the design of the BABY HUG study, acquisition of data, analysis and interpretation of data, revising the manuscript,final approval, and accountability for the work; Ms Reed contributed to the conduct of the study, acquisition of data, interpretation of data, revising the manuscript,final approval, and accountability for the work; Dr Rogers contributed to the conception and design, acquisition and interpretation of data, drafting and revision of the manuscript,final approval, and accountability for the work; Dr Waclawiw contributed to designing the study, data analysis and interpretation of the results, assistance with substantial review and revision of the manuscript,final approval, and accountability for the work; and Dr Thompson made substantial contributions to the statistical design of the study and the manuscript, and he was responsible for the longitudinal analyses and for several drafts of this manuscript.
www.pediatrics.org/cgi/doi/10.1542/peds.2014-0917
doi:10.1542/peds.2014-0917
Accepted for publication Jun 19, 2014
Address correspondence to Sohail Rana, MD, Department of Pediatrics and Child Health, Howard University, 2041 Georgia Ave, NW, Washington, DC 20060. E-mail: srana@howard.edu
PEDIATRICS (ISSN Numbers: Print, 0031-4005; Online, 1098-4275).
Copyright © 2014 by the American Academy of Pediatrics
FINANCIAL DISCLOSURE:Dr Casella has received an honorarium and travel expenses in the past and presently receives salary support through Johns Hopkins for providing consultative advice to Mast Pharmaceuticals (previously Adventrx Pharmaceuticals) regarding a proposed clinical trial of an agent for treating vaso-occlusive crisis in sickle cell disease. He is an inventor and a named party on a patent and licensing agreement to ImmunArray for a panel of brain biomarkers for the detection of brain injury. He hasfiled a provisional patent for a potential treatment of sickle cell disease; the other authors have indicated they have no
financial relationships relevant to this article to disclose.
DOI: 10.1542/peds.2014-0917 originally published online August 25, 2014;
2014;134;465
Pediatrics
and Bruce Thompson
Waclawiw
Goldsmith, James F. Casella, Caroline K. Reed, Zora R. Rogers, Myron A.
Sohail Rana, Patricia E. Houston, Winfred C. Wang, Rathi V. Iyer, Jonathan
Hydroxyurea and Growth in Young Children With Sickle Cell Disease
Services
Updated Information &
http://pediatrics.aappublications.org/content/134/3/465 including high resolution figures, can be found at:
References
http://pediatrics.aappublications.org/content/134/3/465#BIBL This article cites 44 articles, 4 of which you can access for free at:
Subspecialty Collections
http://www.aappublications.org/cgi/collection/blood_disorders_sub Blood Disorders
_sub
http://www.aappublications.org/cgi/collection/hematology:oncology Hematology/Oncology
following collection(s):
This article, along with others on similar topics, appears in the
Permissions & Licensing
http://www.aappublications.org/site/misc/Permissions.xhtml in its entirety can be found online at:
Information about reproducing this article in parts (figures, tables) or
Reprints
DOI: 10.1542/peds.2014-0917 originally published online August 25, 2014;
2014;134;465
Pediatrics
and Bruce Thompson
http://pediatrics.aappublications.org/content/134/3/465
located on the World Wide Web at:
The online version of this article, along with updated information and services, is
http://pediatrics.aappublications.org/content/suppl/2014/08/20/peds.2014-0917.DCSupplemental Data Supplement at:
by the American Academy of Pediatrics. All rights reserved. Print ISSN: 1073-0397.