© Author(s) 2011. CC Attribution 3.0 License.
System Sciences
The CATDAT damaging earthquakes database
J. E. Daniell1,2,3,4, B. Khazai2,3, F. Wenzel2,3, and A. Vervaeck4
1General Sir John Monash Scholar, The General Sir John Monash Foundation, Level 5, 30 Collins Street, Melbourne,
Victoria, 3000, Australia
2Center for Disaster Management and Risk Reduction Technology (CEDIM), Hertzstrasse 16, 76187, Karlsruhe, Germany 3Geophysical Institute, Karlsruhe Institute of Technology, Hertzstrasse 16, 76187, Karlsruhe, Germany
4SOS Earthquakes, Earthquake-Report.com web service, Cederstraat 21, 2800 Mechelen, Belgium
Received: 6 May 2011 – Accepted: 24 June 2011 – Published: 18 August 2011
Abstract. The global CATDAT damaging earthquakes and secondary effects (tsunami, fire, landslides, liquefaction and fault rupture) database was developed to validate, re-move discrepancies, and expand greatly upon existing global databases; and to better understand the trends in vulnerabil-ity, exposure, and possible future impacts of such historic earthquakes.
Lack of consistency and errors in other earthquake loss databases frequently cited and used in analyses was a major shortcoming in the view of the authors which needed to be improved upon.
Over 17 000 sources of information have been utilised, primarily in the last few years, to present data from over 12 200 damaging earthquakes historically, with over 7000 earthquakes since 1900 examined and validated before in-sertion into the database. Each validated earthquake includes seismological information, building damage, ranges of social losses to account for varying sources (deaths, injuries, home-less, and affected), and economic losses (direct, indirect, aid, and insured).
Globally, a slightly increasing trend in economic dam-age due to earthquakes is not consistent with the greatly increasing exposure. The 1923 Great Kanto ($214 billion USD damage; 2011 HNDECI-adjusted dollars) compared to the 2011 Tohoku (>$300 billion USD at time of writing), 2008 Sichuan and 1995 Kobe earthquakes show the increas-ing concern for economic loss in urban areas as the trend should be expected to increase. Many economic and social loss values not reported in existing databases have been col-lected. Historical GDP (Gross Domestic Product), exchange rate, wage information, population, HDI (Human Develop-ment Index), and insurance information have been collected globally to form comparisons.
Correspondence to: J. E. Daniell
(j.e.daniell@gmail.com)
This catalogue is the largest known cross-checked global historic damaging earthquake database and should have far-reaching consequences for earthquake loss estimation, socio-economic analysis, and the global reinsurance field.
1 Introduction
The infrequent but devastating nature of earthquakes can cause rapid stresses on a country’s ability to function and to cope with the impacts, whether they be due to economic, so-cial, or disaster management reasons. Through history, there have been numerous earthquakes that have affected nations.
Globally, depending on the source looked at, a large range in death toll estimates results one example being the Xin-ing earthquake that affected China in 1927, which can be found to have caused anywhere between 40 000 and 200 000 deaths. It is difficult to quantify the exact number of deaths after an earthquake due to the often chaotic post-disaster situ-ation such as quick burials, ad-hoc and uncoordinated count-ing of bodies, inaccurate countcount-ing, and other reasons; how-ever, with careful analysis of all sources detailing effects re-lating to an earthquake, an educated judgement can be made as to a range of fatalities. The 2010 Haiti earthquake is a good example of this, with death toll estimates ranging from 46 000 to 316 000, 18 months after the disaster. This can be similarly undertaken for estimates of injured, homeless, affected, building damage, economic losses, and other socio-economic consequences of earthquakes.
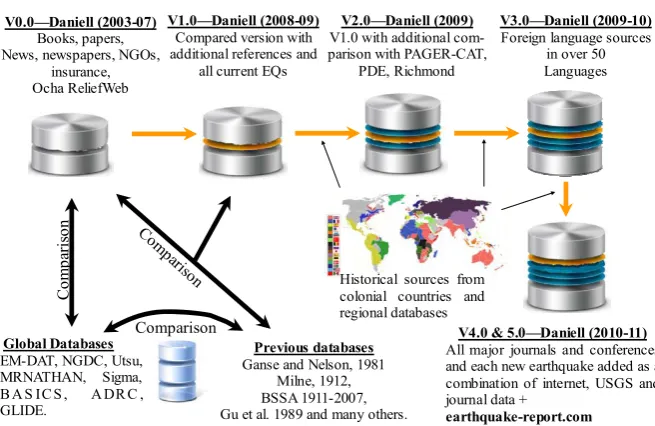
V0.0—Daniell (2003-07) Books, papers, News, newspapers, NGOs,
insurance, Ocha ReliefWeb
The process used to create the earthquake database
Global Databases EM-DAT, NGDC, Utsu, MRNATHAN, Sigma, B A S IC S , A DR C , GLIDE.
Historical sources from colonial countries and regional databases
Previous databases Ganse and Nelson, 1981
Milne, 1912, BSSA 1911-2007, Gu et al. 1989 and many others.
V3.0—Daniell (2009-10) Foreign language sources
in over 50 Languages
Co
m
p
ar
is
o
n
Comparison V4.0 & 5.0—Daniell (2010-11) All major journals and conferences and each new earthquake added as a combination of internet, USGS and journal data +
earthquake-report.com Com
pa rison
V1.0—Daniell (2008-09) Compared version with additional references and
all current EQs
V2.0—Daniell (2009) V1.0 with additional com-parison with PAGER-CAT,
PDE, Richmond
Fig. 1. Flowchart of the process to create the various versions (v0.0 to v5.02) of the CATDAT Damaging Earthquake Database from 2003 to 2011.
2 Development and methodology of the database
The need for a global database for calibration of loss esti-mation models has been called for by experts in the field for many years (e.g. Mileti 1999; National Research Council, 2006). Inventory databases are especially needed to develop and calibrate social consequence functions.
The first step (V0.0, Fig. 1) was a list of socio-economic details from a variety of sources for various earthquakes that the author had collected over a number of years since 2003 due to the author’s interest in natural disaster effects: on-line (OCHA ReliefWeb archives, NGOs (Non-government organisations), insurance companies), from news reports (globally and historical), from earthquake-related books (Stein and Wysession, 2003; Kramer, 1996; Gutenberg, and Richter, 1948), and from papers (Ambraseys et al., 1982, 1991, etc.; Samardjieva and Badal, 2002, BSSA, 1911– 2010), as well as integrating entries from many older non-digital databases. A major effort was undertaken to har-monize a process for data gathering and validation on post-earthquake damage and socio-economic impacts such as number of fatalities, injuries, homeless persons, allocated hu-manitarian aid, and direct economic and insured losses from disparate sources of data for the last 100 yr. Thus, develop-ment of a comprehensive and cross-validated post-event data serves for underpinning and calibrating of models of social and economic losses of earthquakes in the future was initi-ated.
It was then realised that a detailed review and compar-ison was needed with other existing global databases. A review of existing global earthquake socio-economic effect
databases (e.g. EM-DAT, NGDC, UTSU, MRNATHAN) was undertaken to investigate the completeness and consistency between these earthquake databases as well as to source all the known lists of earthquake data worldwide. A review of existing global earthquake socio-economic effect databases was undertaken to see the completeness of these earthquake databases as well as to source all the known lists of earth-quake data worldwide. During this process, a report by Tschoegl et al. (2006) was very useful detailing informa-tion about existing Natural Disaster databases globally. It contains information on 6 international databases (EM-DAT, MunichRe NatCat, SwissRe Sigma, ADRC: GLIDE, Uni-versity of Richmond Disaster Database Project, and BA-SICS) and a number of regional, national, and sub-national databases. In addition, a comparison of 3 of these – EM-DAT, MunichRe, Sigma – revealed that there were major gaps in these databases (Guha-Sapir et al., 2002). Also re-viewed were many other global earthquake catalogues that have been created around the world, including the Utsu cata-logue (2002), NGDC/NOAA (2010 searchable version), EM-DAT, and a comparison of 8 of these databases for certain earthquakes through PAGER-CAT (2008). However, it was found that these earthquake databases lacked consistency and omitted or had erroneous earthquake details pre-1980. Since the return period of most earthquake sources is much more than 30 yr, increased knowledge of socio-economic effects pre-1980 was deemed to be required.
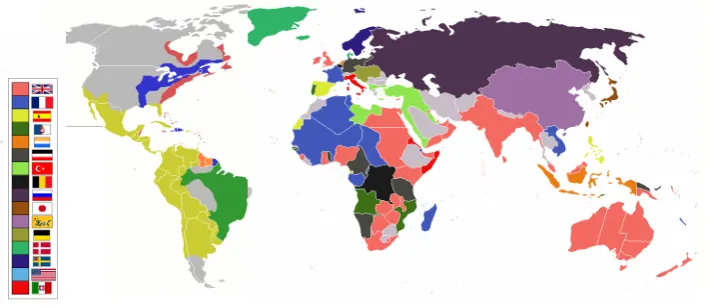
Fig. 2. The colonisation of countries used to determine languages required for searching for historic earthquake records (adapted from Wikipedia Commons 2010).
remove discrepancies, and expand greatly upon the existing global databases; thereupon better understanding the trends in vulnerability, exposure and possible future impacts of such historical earthquakes.
Four main databases (PAGER-CAT, NGDC, UTSU and MRNATHAN) were compared and checked earthquake-by-earthquake against an initial version of the CATDAT database (V1.0, Fig. 1). Although PAGER-CAT uses some UTSU and NGDC values, it was decided that a check was needed due to the possibilities of transmitting errors and misprints from these databases. To delve further into the databases, where possible, the precursors to the databases were explored. In the case of the 2010 NGDC “Signif-icant Earthquakes Database”, the precursor was the Dun-bar et al. (1992) catalogue, which was based on the Ganse and Nelson (1981) catalogue. These two databases com-bined PDE and USGS (2010a and 2010b) data with fa-mous databases, which included Mallet (1852), Montan-don (1953), Milne (1912), Sieberg (1932), Karnik (1969) and many regional databases like Gu et al. (1989), Kondorskaya and Shebalin (1982), and Coffman et al. (1982).
NGDC is similar to the Utsu catalogue that reviewed the Dunbar et al. (1992) catalogue and added to the database us-ing additional sources (CERESIS, 1985; Papazachos et al., 1997; Gu et al., 1989 etc.). Utsu also noted the erroneous nature of figures and locations in the NGDC database. The Utsu database has a number of errors and is limited to deaths, injuries, and a word description of damage and seismolog-ical information. However, it does have the largest num-ber of damaging earthquakes out of all databases, includ-ing over 10 000 up to 2002. Many of these were doubt-ful, repeated and erroneous and thus were not added to the CATDAT database. Each earthquake was audited with the original sources or other sources where found. It was dis-covered through this study, when going back to the original sources, that many errors in copying, values and assumptions had been made for many earthquakes worldwide.
Perhaps a good example of this is the Shemakha earth-quake of 1902 in Azerbaijan in the NGDC, MunichRe NATHAN, UTSU, EM-DAT and PAGER-CAT databases. EM-DAT does not include this earthquake in its database, having only the El Salvador, Guatemala and Uzbekistan (An-dizhan) earthquakes for 1902. Utsu includes 86 deaths and 60 injured as its main estimate but does have a note that it could have caused 10 000 or 20 000 deaths. PAGER-CAT uses the Utsu catalogue value of 86 deaths and 60 injured due to the algorithm that they use to choose between databases. NGDC also gives a value of 86 deaths and 60 injured. Thus, in the process of cross-validating CATDAT, a large number of different sources are used, including the initial source in the database (in this case that of Ganse and Nelson (1979) and Kondorskaya and Shebalin (1982), where the value of 86 deaths comes about by only including deaths from vil-lages around Shemakha and not the city Shemakha itself). 20 000 deaths is a probable exaggeration from newspapers combining the number of homeless with deaths and people injured. An acceptable death toll range is anywhere from 2000–5000 deaths, which has been quoted by many sources (Kondorskaya and Shebalin, 1982; London Times, 1902; New York Times 1902; Russian and Azerbaijani websites) and is allocated as the CATDAT accepted death toll for this event.
discovered earthquakes, social losses, economic loss values, and building damage was significantly increased when com-pared to other databases. Colonisation through time was ex-amined to view in what language the old earthquake records of certain countries could be archived (Fig. 2). Searches were made in both the language of colonisation as well as the of-ficial current languages of the respective countries. In this way, many old records were sourced.
The entire CATDAT Damaging Earthquakes database is contained in a Microsoft Excel framework with external links to other resources. It is also in SQL format.
3 Criteria used for a “damaging earthquake” in the CATDAT database
A damaging earthquake is entered into the CATDAT database by the following criteria:
– Any earthquake causing collapse of structural compo-nents to a significant level.
– Any earthquake causing death, injury, or homelessness. – Any earthquake causing damage or flow-on effects ex-ceeding $100 000 international dollars, Hybrid Natural Disaster Economic Conversion Index adjusted to April 2011.
– Any earthquake causing disruption to a reasonable eco-nomic or social impact as deemed appropriate.
– A requirement of validation of the earthquake existence via 2 or more macroseismic recordings and/or seismo-logical information recorded by stations and at least 1 of the 4 definitions above.
– Validation via external sources if Transparency Inter-national Corruption Perceptions Index<2.7, subject to Polity ranking.
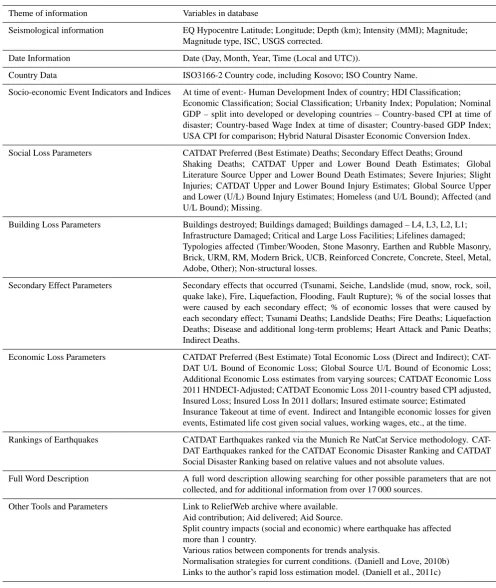
Each validated earthquake entry in CATDAT includes the pa-rameters in Table 1 given to the best available detail.
A quick summary of historical socio-economic trends will now be presented to aid the understanding of the usefulness of such a database and to compare CATDAT to other existing databases.
4 The number of earthquakes contained in the CATDAT database
As of April 2011 in CATDAT v5.024, over 17 000 sources of information have been utilised to present data from over 12 200 damaging earthquakes historically, with over 7000 earthquakes since 1900 examined and validated before insertion into the CATDAT damaging earthquakes database.
Figure 3 depicts a trend between the number of damag-ing earthquakes in countries of differdamag-ing development lev-els. The author of CATDAT has developed the first complete Human Development Index for all 244 nations through time from 1900 to 2010 (Daniell, 2010c) as part of his work for his PhD. This meant the creation of life expectancy, GDP (PPP) per capita, literacy rate, and enrolment rate tables for each country through time in order to create this index. It also required the knowledge of wars, history of countries, and country border changes. Thus, with CATDAT, for the first time, a standardised look at natural disaster losses as a function of country status can be gleaned.
It can be seen that a proportion of the earth’s population is still developing, and that a large proportion of high seis-mic risk countries have an HDI which is still less than 0.8 as of 2011. Please note that, as of November 2010, a new method of calculating HDI has been formulated which will be incorporated into a later 2011 version when the author has formulated the indices for 1900–2010 (UNDP, 2010). As can be observed in Fig. 3 below, the number of damaging earthquakes is not outstanding. The year 2010 ranks approx-imately 10th in terms of historic earthquakes.
In Fig. 4 the comparative number of damaging earthquakes between three databases is examined. It can be seen that the CATDAT database fills in the gaps in recording in the early 20th century through detailed examination and hunting for details of these earthquakes. It should be noted that there is a difference in criteria between CATDAT and PAGER-CAT vs. NGDC. However, when auditing the NGDC database, their criteria is not adhered to in most cases, thus it seems a reasonable comparison.
It is interesting to note that the number of damaging earth-quakes has an average of approximately 45 up until 1960, and approximately 70 from 1960 onwards. This could be due to the increase in media coverage around the world, prolifera-tion of seismic networks, or better reporting procedures of earthquake damage in addition to the additional population.
Spatially, in Fig. 5, is the view of the world according to CATDAT in terms of the number of damaging earthquakes since 1900. It can be seen that Papua Province (Indonesia) has a different number of historic damaging earthquakes to Papua New Guinea. Thus, this country-based view is only shown to show relative distribution of recorded damaging earthquakes.
5 Global social losses due to earthquakes
Table 1. Parameters in the CATDAT Damaging Earthquakes Database.
Theme of information Variables in database
Seismological information EQ Hypocentre Latitude; Longitude; Depth (km); Intensity (MMI); Magnitude;
Magnitude type, ISC, USGS corrected.
Date Information Date (Day, Month, Year, Time (Local and UTC)).
Country Data ISO3166-2 Country code, including Kosovo; ISO Country Name.
Socio-economic Event Indicators and Indices At time of event:- Human Development Index of country; HDI Classification; Economic Classification; Social Classification; Urbanity Index; Population; Nominal GDP – split into developed or developing countries – Country-based CPI at time of disaster; Country-based Wage Index at time of disaster; Country-based GDP Index; USA CPI for comparison; Hybrid Natural Disaster Economic Conversion Index.
Social Loss Parameters CATDAT Preferred (Best Estimate) Deaths; Secondary Effect Deaths; Ground
Shaking Deaths; CATDAT Upper and Lower Bound Death Estimates; Global Literature Source Upper and Lower Bound Death Estimates; Severe Injuries; Slight Injuries; CATDAT Upper and Lower Bound Injury Estimates; Global Source Upper and Lower (U/L) Bound Injury Estimates; Homeless (and U/L Bound); Affected (and U/L Bound); Missing.
Building Loss Parameters Buildings destroyed; Buildings damaged; Buildings damaged – L4, L3, L2, L1;
Infrastructure Damaged; Critical and Large Loss Facilities; Lifelines damaged; Typologies affected (Timber/Wooden, Stone Masonry, Earthen and Rubble Masonry, Brick, URM, RM, Modern Brick, UCB, Reinforced Concrete, Concrete, Steel, Metal, Adobe, Other); Non-structural losses.
Secondary Effect Parameters Secondary effects that occurred (Tsunami, Seiche, Landslide (mud, snow, rock, soil, quake lake), Fire, Liquefaction, Flooding, Fault Rupture); % of the social losses that were caused by each secondary effect; % of economic losses that were caused by each secondary effect; Tsunami Deaths; Landslide Deaths; Fire Deaths; Liquefaction Deaths; Disease and additional long-term problems; Heart Attack and Panic Deaths; Indirect Deaths.
Economic Loss Parameters CATDAT Preferred (Best Estimate) Total Economic Loss (Direct and Indirect);
CAT-DAT U/L Bound of Economic Loss; Global Source U/L Bound of Economic Loss; Additional Economic Loss estimates from varying sources; CATDAT Economic Loss 2011 HNDECI-Adjusted; CATDAT Economic Loss 2011-country based CPI adjusted, Insured Loss; Insured Loss In 2011 dollars; Insured estimate source; Estimated Insurance Takeout at time of event. Indirect and Intangible economic losses for given events, Estimated life cost given social values, working wages, etc., at the time.
Rankings of Earthquakes CATDAT Earthquakes ranked via the Munich Re NatCat Service methodology.
CAT-DAT Earthquakes ranked for the CATCAT-DAT Economic Disaster Ranking and CATCAT-DAT Social Disaster Ranking based on relative values and not absolute values.
Full Word Description A full word description allowing searching for other possible parameters that are not
collected, and for additional information from over 17 000 sources.
Other Tools and Parameters Link to ReliefWeb archive where available.
Aid contribution; Aid delivered; Aid Source.
Split country impacts (social and economic) where earthquake has affected more than 1 country.
Various ratios between components for trends analysis.
0 10 20 30 40 50 60 70 80 90 100 110 120
1900 1905 1910 1915 1920 1925 1930 1935 1940 1945 1950 1955 1960 1965 1970 1975 1980 1985 1990 1995 2000 2005 2010 Year
N
o. Of
D
am
ag
ing
E
ar
thqua
ke
s
Very High HDI from 0.9-0.999 High HDI from 0.8-0.899 Moderate-High HDI from 0.65-0.799 Moderate-Low HDI from 0.5-0.649 Low HDI from 0-0.499
Fig. 3. Damaging earthquakes in the CATDAT damaging earthquakes database from 1900–2011 (up to April, 2011).
0 10 20 30 40 50 60 70 80 90 100 110
Year
No
. O
f D
a
m
a
gi
n
g
E
a
r
th
q
u
a
k
e
s CATDAT NGDC PAG ER-CAT
Fig. 4. A comparison of the number of damaging earthquakes in-cluded in major databases up to 2008 (CATDAT Damaging EQ Database v4.12, Daniell, 2010a).
120 countries have had at least 1 fatality due to an earth-quake. There have been approximately 4.02 million injuries recorded, yet the trended value of injured (accounting for where injury data is unavailable) is towards 10 million. How-ever, this is further complicated by the fact that the recorded injuries definition differs around the world. In earlier times, slightly injured people were generally not recorded. Assum-ing 6 billion deaths worldwide from 1900–2010, earthquakes have caused approximately 0.041 % of fatalities. This study is a significant improvement
The top 10 fatal earthquakes since 1900 have been pre-sented in Table 2 in order to lessen some of the dis-crepancies shown in other major databases like EM-DAT, MRNATHAN, NGDC, etc. For more information, see Daniell (2010a) or Daniell (2003–2011). A common error is to include the 1927 Xining earthquake in the top 10, where this is often confused with the death toll of the 1920 Haiyuan earthquake. The Xining earthquake of 1927 caused about 40 900 deaths (Gu et al., 1989), leaving it out of the top 10.
It can be seen from Fig. 6 that approximately 8.5 mil-lion people have been recorded as having died from earth-quakes through time. When compared to the global pop-ulation, it can be observed that the fatality rate as a % of population is decreasing, considering the greatly increased population. Trends referring to 1900 onwards are shown in Daniell (2010a). The exact number of deaths can never be ex-actly quantified post-disaster due to quick burials, decompo-sition, inaccurate counting and other reasons; however, with careful analysis of all sources detailing effects relating to an earthquake, an educated judgement can be made as to a range of fatalities. The CATDAT upper and lower bounds show the most feasible range. For example, the Haiti earthquake started between 92 000 and 225 000 deaths. These formed the initial lower and upper CATDAT bounds. The median value was at 222 500 deaths; however, in early 2011, conclu-sive evidence was provided of the overestimation (Daniell et al., 2011a), resulting in a median 137 000 deaths with a CAT-DAT accepted range of 122 000 to 167 000. An additional study by USAID gave an estimate from 46 000 to 85 000 (USAID, 2011). This has been similarly undertaken for estimates of injured, homeless, affected, building damage, economic losses, and other socio-economic consequences of earthquakes for each earthquake through time. The global lower was then replaced by 46 000 and the global upper at 316 000.
The global upper and lower bound refer to the upper and lower bounds found in the literature (deleting obvious er-rors). For cumulative deaths during the years 1900 to 2011, this value is 1.637 million to 4.002 million deaths. This is not the range condoned by CATDAT.
Fig. 5. A comparison of the relative number of damaging earthquakes in the database per country (the darker the area, the greater the number of damaging earthquakes), (CATDAT Damaging EQ Database v4.12, Daniell, 2010a).
Table 2. The top 10 death tolls since 1900 in the CATDAT Damaging Earthquakes Database.
Rank EQ Main country Date Median fatalities CATDAT lower/upper Pref. source
1 Haiyuan China 16 Dec 1920 273 465 258 707–283 407 Zhang, 2010
2 Tangshan China 27 Jul 1976 242 419 240 000–255 000 Yong et al., 1989
3 Indian Ocean Indonesia etc 26 Dec 2004 228 194 227 640–230 210 Indiv. Country Reports
=4 Great Kanto Japan 1 Sep 1923 142 831 142 800–143 000 Scawthorn et al. (2005)
=4 Haiti* Haiti* 12 Jan 2010 137 000 122 000–167 000 Daniell et al. (2011a)
6 Aschgabad Turkmenistan 5 Oct 1948 122 000 110 000–176 000 CATDAT
7 Sichuan China 12 May 2008 88 287 87 476–89 000 Govt.
8 Kashmir Pakistan etc 8 Oct 2005 87 364 73 338–87 364 ReliefWeb
9 Messina Italy 28 Dec 1908 85 926 80 000–90 000 CATDAT
10 Ancash Peru 31 May 1970 66 794 52 000–96 794 CATDAT
∗subject to further confirmation from a non-government source due to Corruption Perceptions Index value.
0 2000000 4000000 6000000 8000000 10000000 12000000 14000000
10 260 510 760 1010 1260 1510 1760 2010
Year (AD)
Cu
m
u
la
ti
v
e
D
e
a
th
s
of
record
ed
C
A
T
D
A
T
eart
hq
u
a
kes
0 2000000 4000000 6000000 8000000 10000000 12000000 14000000
W
o
rl
d Popul
a
ti
on (
'0
00s
)
CATDAT Best Estimate
CATDAT Upper Bound
CATDAT Lower Bound
Global Upper Bound
Global Lower Bound
Population
Fig. 6. The CATDAT estimates versus the smallest plausible and largest plausible fatalities from earthquakes from various literature sources. This is compared with the global population.
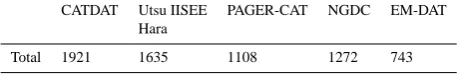
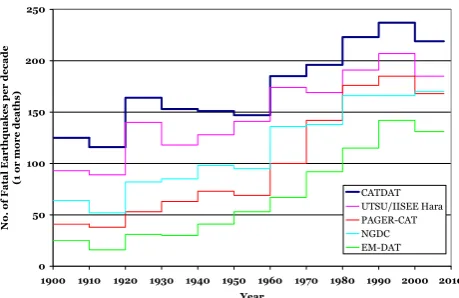
Table 3. The number of fatal earthquakes from 1900–June 2008 as shown in earthquake databases (without removal of error earth-quakes in these databases).
CATDAT Utsu IISEE PAGER-CAT NGDC EM-DAT Hara
Total 1921 1635 1108 1272 743
0 50 100 150 200 250
1900 1910 1920 1930 1940 1950 1960 1970 1980 1990 2000 2010 Year
No. of Fatal Earth
quakes per decade
(1 or more deaths
)
CATDAT UTSU/IISEE Hara PAGER-CAT NGDC EM-DAT
Fig. 7. The number of fatal earthquakes per decade (up to 2008) in each of the major international earthquake databases as compared to CATDAT Damaging Earthquakes v4.12 (Daniell, 2010a).
seem to include any damaging earthquake despite the cutoff criteria they set at the start. The number of fatal earthquakes per decade for different databases up to 2008 was shown in Daniell (2010a) for comparison as seen in Fig. 7.
Bilham (2009) presents approximately 1000 fatal earth-quakes for the period 1900–2000. This value is slightly greater than the PAGER-CAT estimate and mimics closely the NGDC database due to the use of Dunbar et al. (1992). Nichols and Beavers (2008) present 1010 fatal earthquakes from 1900–1999. During this time period from 1900–1999, the author’s value in CATDAT is 1688 fatal earthquakes, showing the difference in collection methods.
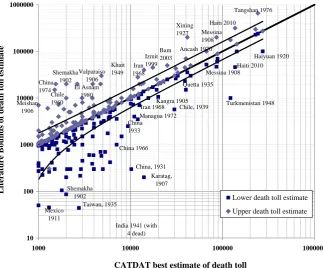
Another useful comparison can be seen in terms of the maximum and minimum plausible values of fatalities and in-juries compared to the CATDAT best estimate. This allows us to see which major earthquakes are generally overesti-mated or underestioveresti-mated in terms of death tolls. In Fig. 8, all earthquakes since 1900 with a CATDAT best estimate death toll of 1000 persons or more are compared on the y-axis, the upper bound (diamond) and lower bound (square) liter-ature value (with removal of obvious errors) from various global sources. Where there is not much variability, the upper and lower bound value should lie on the middle black line. Where there is a deemed overestimated death toll in litera-ture sources, the earthquake appears as a diamond above the best estimate line. Where there is a deemed underestimated death toll in literature sources, the earthquake appears as a square below the best estimate line. Earthquakes can have a wide range of death toll estimates so in some cases, such as the Shemakha 1902 earthquake (previously mentioned) or the Messina 1908 earthquake, for which both the upper (around 200 000 deaths) and lower estimate (38 000 deaths) can be deemed as over- and underestimates of a true death toll (likely about 85 000 deaths).
It can be seen in Fig. 9 that there is a very low value of deaths from 1900 onwards in developed countries when
compared to developing countries. This is in part due to the increasing development of countries through the time period. In Fig. 9, the annualised global fatalities are presented. The average deaths per year are approximately 22 000. Trends as to affected, aid, homelessness, and injuries are also included in the CATDAT database. It can be seen that there is vir-tually no deaths for earthquakes occurring in countries with HDI over 0.8. This is due to two reasons: (1) as these coun-tries develop, more attention is paid to disaster management, and (2) there are comparatively less damaging earthquakes that have occurred since 1900 in these nations (as seen in Fig. 9) due to development status of countries. To coun-teract this discrepancy, in number of damaging earthquakes it can be standardised to a deaths per damaging earthquake (Fig. 10). It should be noted that selecting the most plausible death toll for CATDAT is an obviously subjective process, where expert judgement has to be used through reviewing of past literature and sources. However, cross-checking the re-ported earthquake consequence values (death tolls, injuries, economic losses, etc.) across as wide a spectrum of sources as possible has been carried out as a time consuming but es-sential step in improving the confidence in values reported as “best estimates” in CATDAT. Lack of consistency and er-rors in other earthquake loss databases frequently cited and used in analyses was a major shortcoming, in the view of the authors, which needed to be improved upon.
Figure 10 shows that as countries develop, generally bet-ter enforcement of building codes, research into earthquake hazard and effects, and thus better earthquake building prac-tice and risk reduction measures are present. This has been explored through the use of the data within Daniell (2010c) and Daniell et al. (2011c).
Figure 11 is the number of deaths that have occurred due to earthquakes in each country, divided by the population (in millions) at the time of disaster, and integrated over the entire time period from 1900 to 2010. It can be seen that Turkmenistan and Armenia have the highest relative fatal-ity rates globally. These have been caused primarily by the 1948 and 1988 earthquakes, respectively. In absolute val-ues, China, Haiti, Indonesia, Iran, Japan, and Turkmenistan have had the highest death and injury counts since 1900. In terms of homelessness, China dominates statistics due to the large building losses in Haiyuan 1920, Xining 1927, Tang-shan 1976, and Sichuan 2008.
6 The secondary effects of earthquakes
The secondary effects of 7000+ earthquakes since 1900 were separated from the ground shaking effects. The economic losses, building damage, and social losses have also been separated and will be presented in a future paper.
10 100 1000 10000 100000
1000 10000 100000 1000000
CATDAT best estimate of death toll
Literature Bounds of death
toll
es
timate
Lower death toll estimate
Upper death toll estimate
Messina 1908 Haiti 2010 Xining 1927 Izmit 1999 Khait 1949 Chile 1960 China 1974 Valparaiso 1906 El Asnam 1980 Meishan 1906 Bam 2003 Iran 1968 Shemakha 1902 Turkmenistan 1948 Haiyuan 1920 Messina 1908 Quetta 1935 Kangra 1905 Iran 1968 Managua 1972 China 1933 China 1966 Ancash 1970
India 1941 (with 4 dead) Shemakha 1902 Mexico 1911 Haiti 2010 Karatag, 1907 China, 1931 Taiwan, 1935 Chile, 1939
Fig. 8. CATDAT v5.024 Damaging Earthquakes median death toll as compared to the upper and lower death toll estimates in global literature.
0 30000 60000 90000 120000 150000 180000 210000 240000 270000 300000 19 00 19 05 19 10 19 15 19 20 19 25 19 30 19 35 19 40 19 45 19 50 19 55 19 60 19 65 19 70 19 75 19 80 19 85 19 90 19 95 20 00 20 05 20 10 Year No . O f Deat h s p er ca le n d a r yea r
Very High HDI from 0.9-0.999 High HDI from 0.8-0.899 Moderate-High HDI from 0.65-0.799 Moderate-Low HDI from 0.5-0.649 Low HDI from 0-0.499
Fig. 9. CATDAT v5.024 Damaging Earthquakes – best estimate of yearly deaths for damaging earthquake and secondary effect events from 1900–2011.
reviewed from 1980–2003, earthquake shaking contributes most (approx. 90 %) to the social and economic losses in earthquakes. Marano et al. (2010) used the PAGER-CAT catalogue from September 1968 to June 2008 for 749 fatal earthquakes, showing that the expanded data shows approx-imately 25 % of social losses are due to secondary effects of earthquakes (tsunami, landslide, fire, liquefaction). In the same time period, 913 fatal earthquakes are recorded in the
0 50 100 150 200 250 300 350 400 450 500
HDI less than 0.5 HDI between 0.5-0.65 HDI between 0.65-0.8 HDI over 0.8
Ave
rage De
aths
HDI less than 0.5 HDI between 0.5-0.65 HDI between 0.65-0.8 HDI over 0.8
Fig. 10. Median deaths per CATDAT v5.024 damaging earthquake for a particular Human Development Index bracket.
Fig. 11. Number of deaths for each country as a proportion of millions of population at the time of disaster integrated from 1900 to 2010. CATDAT v4.12, Daniell, 2010a.
In the updated version of the worldwide database (v5.024) for 1996 fatal earthquakes from 1900 to April 2011, 28.6 % of the fatalities (691 000) are from secondary effects. An additional discretisation of non-structural fatalities (2.4 %) is separated from the earthquake shaking effects on masonry structures (57.5 %), concrete structures (8.5 %), and wooden structures (3 %) for the remaining 1 739 000 fatalities from 1900.
It can be seen that the effects of fire (mostly 1923 Great Kanto), tsunami (mostly 2004 Sumatra), and landslides (1920 Haiyuan) dominate the fatalities (Daniell, 2010b). However, it is important to also take region into account. A higher percentage of secondary effect deaths has been seen in the Asia-Pacific region when compared to the entire world picture. Note that heart attack and non-structural losses are still being researched as part of v5.0x and are set to increase
when compared to structural loss once this analysis is fin-ished.
7 Global economic losses due to earthquakes
Mud/Adobe/Earthen/Rubble Masonry; 915337; 37.71%
URM/UCB/Brick/RM; 320246; 13.19%
207050; 8.53% 0.04%
Tsunami; 300509; 12.38%
Landslides/Debris Flows; 268509; 11.06%
Fire; 118960; 4.90%
Heart Attack and Panic; 2341; 0.10% Other Deaths/Indirect; 906;
0.04% Non-Structural; 58311;
2.40%
Timber/Bamboo/Wood; 74571; 3.07%
Stone Walls/Stone Masonry; 159763; 6.58%
Fig. 12. Shaking and Secondary Effect Deaths Worldwide for 1996 fatal earthquakes (Daniell et al., 2010c, Daniell, 2010a).
0 20 40 60 80 100 120 140 160 180
1900 1910 1920 1930 1940 1950 1960 1970 1980 1990 2000 2010 Year
No. of
Earthquakes with
E
conomic Loss Estimate
CATDAT MRNATHAN PAGER-CAT NGDC EM-DAT
Fig. 13. The number of earthquakes with exact economic loss es-timates per decade in each of the major international earthquake databases as compared to CATDAT v4.12 (Daniell, 2010a).
Table 4. The number of earthquakes from 1900–2008 with exact economic loss values.
CATDAT NGDC PAGER-CAT EM-DAT MRNATHAN
Total 1121 398 338 389 199
purchasing power parity (PPP) were also created as part of the study, from sources such as Maddison (2003), World Bank (2010), and IMF (2010), as these details are required to effectively convert loss estimates from around the world into present-day costs.
A comparison of economic losses in major international databases is shown in Fig. 13. CATDAT is compared to NGDC, EM-DAT, MRNATHAN, and others. The number of exact economic estimated earthquakes since 1900 has been compared in Table 4. The NGDC has a cutoff criteria of approx. $1 m USD; however, it can be seen that this is not adhered to, given values of $0.04 m USD, etc. MRNATHAN is only a part of the full Munich Re database but this is the only open source component to test. EM-DAT also has esti-mates from $0.1 m USD. PAGER-CAT takes into account a combination of EM-DAT and NGDC data.
For earthquakes in CATDAT where there is no estimate from a previously written source, separate analysis has been done to calculate an order of magnitude for the economic losses based on historic construction costs, wages as a pro-portion of building damage, and then reanalysing losses (Daniell et al., 2010a). Using the economic status of a region, a reasonable estimate has been established. In some cases, the range description developed by Ganse and Nelson (1981) based on 1979 dollars and by Dunbar et al. (1992) based on 1990 dollars was used; however, in many cases it was found to be erroneous. Every one of the 7000+ earthquakes in the CATDAT database from 1900 onwards has an economic loss range associated with it. This is used to fill in the gaps in earthquake economic loss knowledge worldwide to account for previously unquantified earthquakes.
Table 5. The top 10 highest ranked earthquake losses since 1900 in terms of percentage of nominal GDP (both unadjusted and purchasing power parity) – Daniell et al. (2010a).
Rank Earthquake Date Median cost % of % of
(UTC) at time of Nominal GDP Nominal
event in $US (PPP) GDP
1 Spitak, Armenia∗ 7 Dec 1988 16.20 bn 92.3 358.9
2 Port-au-Prince, Haiti 12 Jan 2010 7.804 bn 70.8 120.6
3 Guatemala 4 Feb 1976 3.900 bn 44.6 98.0
4 Managua, Nicaragua 23 Dec 1972 0.845 bn 19.7 to 38.3 67.1 to 96.2
5 Cartago, Costa Rica 4 May 1910 0.025 bn 63.5 ≈90.0
6 Maldives Tsunami 26 Dec 2004 0.603 bn 50.1 77.7
7 Concepcion, Chile 17 Aug 1906 0.260 bn 47.8 55.0 to 82.9
8 Wallis and Futuna 12 Mar 1993 0.014 bn 51.9 54.0
9 Great Kanto, Japan 1 Sep 1923 3.840 bn 29.8 52.8
=10 Nicaragua 31 Mar 1931 0.030 bn 26.5 51.0
=10 Jamaica 14 Jan 1907 0.013 bn 23.9 45.9
∗Accounts for a partial Soviet Union response – doubling the 1990 Nominal GDP and GDP (PPP) of Armenia. Hyperinflation and devaluation made it very difficult to properly
determine the GDP of the time; thus, a range has been given incorporating different sources from 1988–1998 using an average value through this period, consistent with the reconstruction payout through time. Modelling also leads to values as high as 594 % of nominal GDP.
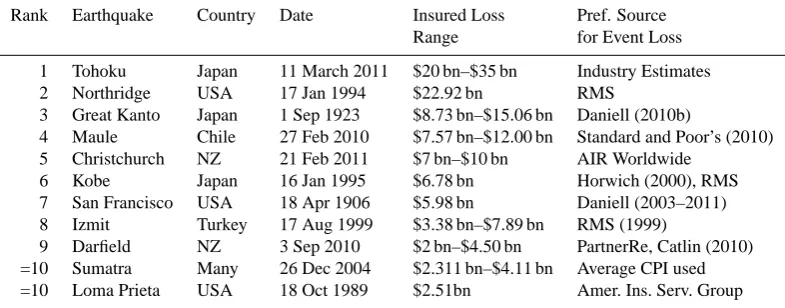
Table 6. List of highest insured losses (1900–2011) in 2011 Country CPI adjusted $ international.
Rank Earthquake Country Date Insured Loss Pref. Source
Range for Event Loss
1 Tohoku Japan 11 March 2011 $20 bn–$35 bn Industry Estimates
2 Northridge USA 17 Jan 1994 $22.92 bn RMS
3 Great Kanto Japan 1 Sep 1923 $8.73 bn–$15.06 bn Daniell (2010b)
4 Maule Chile 27 Feb 2010 $7.57 bn–$12.00 bn Standard and Poor’s (2010)
5 Christchurch NZ 21 Feb 2011 $7 bn–$10 bn AIR Worldwide
6 Kobe Japan 16 Jan 1995 $6.78 bn Horwich (2000), RMS
7 San Francisco USA 18 Apr 1906 $5.98 bn Daniell (2003–2011)
8 Izmit Turkey 17 Aug 1999 $3.38 bn–$7.89 bn RMS (1999)
9 Darfield NZ 3 Sep 2010 $2 bn–$4.50 bn PartnerRe, Catlin (2010)
=10 Sumatra Many 26 Dec 2004 $2.311 bn–$4.11 bn Average CPI used
=10 Loma Prieta USA 18 Oct 1989 $2.51bn Amer. Ins. Serv. Group
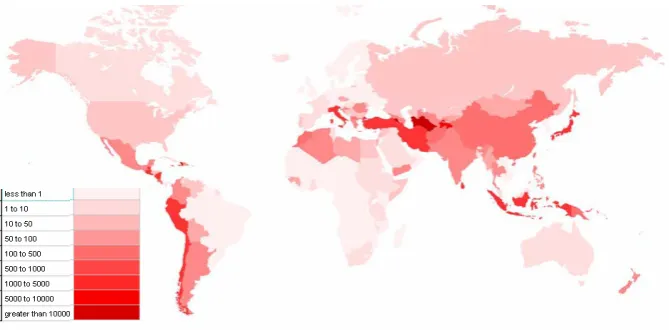
($109 billion). However, it is important to take into account the changing GDP in countries and to determine the impact based on this. The relative values between nations based on a division of economic losses incurred at time of disaster as compared to GDP are shown in the following world map, as shown in Fig. 14. This was then integrated over the time period from 1900 to 2011. Armenia, Turkmenistan, Haiti, Nicaragua, Wallis and Futuna, TFYR Macedonia and Chile have been seen to have the highest relative ratios.
In Table 5 is a list from CATDAT of the top 10 greatest economic losses as a function of GDP (Nominal) and GDP (Nominal, PPP) to compare the total economic loss at the time of disaster to the economy of the time. The median cost presented in US dollars is the most accepted value of total economic loss at the time of the earthquake as found from CATDAT through the literature. This is classified as the
median cost of the event. In the full CATDAT database, there is a range of accepted loss estimates for each earthquake that are not included in this paper. This was generally presented in US dollar values in the literature (converted from local currency using time-of-event exchange rate). For more detail refer to Daniell et al. (2010a) and Daniell et al. (2011d).
Fig. 14. Economic Losses for each country as a proportion of GDP (PPP) in at the time of disaster cumulative from 1900 to 2010 (Daniell, 2011a).
0 25000 50000 75000 100000 125000 150000 175000 200000 225000 250000 275000 300000 325000 350000
1
900 1905 1910 1915 1920 9251 1930 1935 1940 1945 1950 9551 1960 1965 1970 1975 1980 1985 1990 1995 2000 2005 2010 Year
E
conom
ic
L
os
se
s
($
m
ill
20
11 HN
D
E
C
I)
High HDI (over 0.87)
Low HDI (under 0.87)
Fig. 15. Economic Losses (2011 Hybrid Natural Disaster Economic Conversion Index adjusted) for 7000+ earthquakes from the year 1900–2011 worldwide (Daniell et al., 2011d).
comes from under reconstruction unskilled wages. Thus, the HNDECI is primarily based on unskilled wage and building material trends as well as relative utility trends, life costs, and other inflation measurements to bring the value forward and needs to be calculated on a country-by-country basis. Refer to Daniell et al. (2010a) for information as to the HNDECI.
Using the HNDECI for all worldwide earthquakes to ad-just them to 2011 dollars, Fig. 15 shows the results of cu-mulative economic loss for each year. In this case, 2010 Hu-man Development Index is used to classify the country losses with developing countries (defined as a 2010 HDI<0.87 shown in orange) and developed countries (defined as a 2010 HDI>0.87 shown in blue). In addition, Fig. 16 shows the number of cumulative fatalities vs. cumulative economic loss for each country in order to create an index of economic loss per fatality. It can be seen that developed countries have a greater economic loss per fatality.
Since the last 2011 Tohoku earthquake, the trend in annual economic losses has changed to an increasing one from a near linear regression from 1900–2010, but we are still wait-ing for the big economic loss bearwait-ing earthquake for a major metropolis. At the time of writing, the economic loss range is expected to be somewhere between $253 billion and $522 billion with a median of $328.15 billion USD (Daniell and Vervaeck, 2011b).
It can be seen from Fig. 17 that the baseline of annu-alised economic losses from earthquakes is slightly increas-ing; however, this increase is not as marked as in some other studies (MunichRe, 2000, 2002; Vranes et al., 2009; Swiss Re, 2009) when different economic conversion indices are used and an underestimate of Japanese earthquakes based on US CPI occurs. The error can be seen in EM-DAT (2004), where the original disaster is quoted in US dollars but has been converted from another currency. They then use US in-flation figures to bring forward this value into 2003 dollars. However, this is not correct, as the disaster did not occur in the United States (see Daniell et al., 2010a). The use of CPI adjustment based on one economy is therefore outdated in a natural disasters forward costing context.
AF(81) AL(67) DZ(150) AS(2) AG(1) AR(71) AM(15) AU(69) AT(14) AZ(15) BD(16) BE(11) BO(5) BA(26) BR(12) BG(26) CA(23) KY(2) CL(151) CN(926) HK(2) MO(6) CO(74) KM(3) CR(64) HR(38) CU(14) CY(24) CZ(20) DJ(5) DO(11) EC(63) EG(11) SV(45) ET(14) FJ(14) FR(57) GA(1) GE(24) DE(30) GH(4) GR(228) GP(4) GU(14) GT(77) GN(3) HT(11) HN(16) HU(16) IS(11) IN(189) ID(277) IR(328) IQ(5) IL(4) IT(274) JM(11) JP(433) JO(4) KZ(17) KE(6) KV(2) KW(2) KG(26) LB(3)LY(5) MG(5) MW(6) MY(3) MV(2) MQ(2) MX(167) MD(1) MN(17) ME(7) MS(4) MA(21) MM(33) NP(17) AN(1) NZ(100) NI(56) PK(63) PW(1) PA(43) PG(89) PE(151) PH(204) PL(8) PT(42) PR(12) QA(3) RO(27) RU(162) RW(3) KN(4) LC(2) WS(8) SA(4) RS(29) SC(1) SK(3) SI(19) SB(30) SO(3) ZA(35) ES(48) LK(1) SD(9) CH(18) TW(143) TJ(46) MK(12) TH(6) TO(8) TT(12) TN(18) TR(328) TM(15) UG(6) UA(6) GB(17) TZ(17) US(612) UZ(16) VU(26) VE(33) VN(7) WF(1) YE(13) ZW(1) 1 10 100 1000 10000 100000 1000000
0.1 1 10 100 1000 10000 100000 1000000
Total Fatalities 1900-2011
Total Monetary Loss ($US m illion - 2011 HNDECI) 1 10 100 1000 10000 100000 1000000
$10000 per fatality $100000 per fatality $1m per fatality $10m p.f.
$100m p.f $1000m p.f.
Fig. 16. The cumulative average economic losses (2011 HNDECI Million Dollars) vs. fatalities for each country (ISO code) with the number of damaging earthquakes from 1900–2011.
y = 18522x R2 = 0.9712
y = 13151x R2 = 0.954
0 1000000 2000000 3000000 4000000 5000000 6000000 7000000 8000000 9000000 10000000
1900 1910 1920 1930 1940 1950 1960 1970 1980 1990 2000 2010 Year P o p u la tio n ( '000s) ; Fa ta lities (d e a th s) ; E con omic Losse s f rom E a rt hq ua kes (' 000s , 201 0 H N D E CI-ad jus ted d o lla rs ) 0 10000 20000 30000 40000 50000 60000 70000 80000 90000 100000 Wor ld G D P , c o ns ta nt 201 0 d o llars ( x 10 6 )
Cumulative Economic Losses Cumulative Fatalities Population ('000s)
World GDP (2010 International Dollars) Linear (Cumulative Fatalities) Linear (Cumulative Economic Losses)
(x 1 09 ) (x 1 0 6,
Fig. 17. Economic Losses (2011 Hybrid Natural Disaster Economic Conversion Index adjusted) for 7000+ earthquakes from the year 1900– 2011 worldwide (Daniell, 2011b)
8 Conclusions
The CATDAT Damaging Earthquake database contains much data suitable for use in many sectors from earthquake loss estimation, to risk mapping, for insurance purposes and simply as a validated dataset to reduce the erratic values of socio-economic losses quoted wrongly throughout a number of sources. It has been shown that the traditional view that
quake validated database, eliminating many of the errors seen in PAGER-CAT (2008).
Over 12 200 earthquakes show over 8.5 million deaths since the beginning of earthquake records. Earthquakes in the 20th and 21st centuries have already caused around $2.1 trillion (2011 HNDECI-Adjusted int. dollars) dam-age. Collection of building damage for historic earthquakes demonstrates the vulnerability of traditional building stocks such as masonry, adobe and badly constructed reinforced concrete.
It should also be noted that traditional databases making trends based on year-of-event dollars or adjusting using a mass United States Consumer Price Index trend over earth-quake losses worldwide are incorrect. Economic loss should be calculated on a country-by-country basis and then com-pared as per Daniell et al. (2011d).
This catalogue is one of the largest known cross-checked global historical damaging earthquake databases and should have far-reaching consequences for earthquake loss estima-tion, socio-economic analysis and the global reinsurance field. Given the amount of data collected, much future re-search that can be done and development of the links with other global entities (government, insurance and NGO) will be a priority. The database is a dynamic entity and will con-tinue to grow as each earthquake with socio-economic loss occurs around the world and new research is undertaken into the effects of historical earthquakes.
Acknowledgements. This paper has been written as part of the development of the corresponding author’s PhD, funded by the General Sir John Monash Foundation via the Australian Govern-ment and also thanks to CEDIM, earthquake-report.com, AEES and KIT. We acknowledge support by Deutsche Forschungsgemein-schaft and Open Access Publishing Fund of Karlsruhe Institute of Technology.
Edited by: M. E. Contadakis
Reviewed by: K. McCue and B. V. Vangelsten
References
Ambraseys, N. N. and Melville, C. P.: A History of Persian Earth-quakes. Cambridge Univ. Press, 219 pp., 1982.
Ambraseys, N. N. and Adams, R. D.: Reappraisal of major African earthquakes, south of 20N, 1900–1930, Nat. Hazards, 4, 389– 419, 1991.
Asian Disaster Reduction Center (ADRC): GLIDEnumber,
Asian Disaster Reduction Center, available at: http://www. glidenumber.net/glide/public/search/search.jsp, 2009.
Bilham, R.: The seismic future of cities, B. Earthq. Eng., 7, 839– 887, 2009.
Bird, J. F. and Bommer, J. J.: Earthquake Losses due to Ground Failure, Eng. Geol., 75, 2, 147–179, 2004.
BSSA (Bulletin of the Seismological Society of America): Seismo-logical Notes, various years, checked against other data, 1911– 2010.
//www.catlin.com/cgl/media/press releases/pr 2010/, 2010. CERESIS: Terremotos Destructivos en America del Sur, 1530–
1894 (Destructive Earthquakes of South America 1530–1894)”, Lima, 328 pp., 1985.
Coffman, J. L., von Hake, C. A., and Stover, C. W.: Earthquake History of the United States, Revised edition (Through 1970), Reprinted 1982 with supplement (1971–80). NOAA and USGS Publication 41–1, 258 pp., 1982.
Cutter, S. L. and Emrich, C.: Are natural hazards and disaster losses in the U.S. increasing?, Eos, Transactions, Am. Geophys. Union, 86, 41, 381–396, 2005.
Daniell, J. E.: The CATDAT Damaging Earthquakes Database, searchable integrated historical global catastrophe database, Dig-ital Database, updates v0.0 to latest update v5.024, 2003–2011. Daniell, J. E.: CATDAT Global Economic Databases, Digital
Database, Karlsruhe, Germany, 2008–2011a.
Daniell, J. E.: CATDAT Global Social Databases, Digital Database, Karlsruhe, Germany, 2008–2011b.
Daniell, J. E.: The CATDAT Damaging Earthquakes Database, Pa-per No. 6, AEES 2010 Conference, Perth, Australia, 2010a. Daniell, J. E.: The Socio-Economic Damage of Historical
Earth-quakes and their Secondary Effects on the Asia-Pacific Region Infrastructure, CECAR5 Conference Proceedings, Paper No. 431, Sydney, Australia, 2010b.
Daniell, J. E.: A complete country-based temporal and spatial Hu-man Development Index – 1800–2010, Digital Database and Re-port, Karlsruhe, Germany, 2010c.
Daniell, J. E.: Country-based Gross Domestic Product through time (1900–2010) and space (244 discretised nations), Digital Database and Report, Karlsruhe, Germany, 2010d.
Daniell, J. E.: The CATDAT Damaging Earthquakes Database – 2010 – Year in Review, CEDIM Research Report 2011-01, Earthquake-Report OF Report, Karlsruhe, Germany, 2011a. Daniell, J. E.: The Worldwide CATDAT Damaging Earthquakes
and Damaging Volcanoes Databases: Socio-economic trends, values and analysis including 2010, Geophys. Research Abstr., 13, EGU2011-4909, 2011b.
Daniell, J. E. and Love, D.: The Socio-economic Impact of Historic Australian Earthquakes, Paper No. 8, AEES 2010 Conference, Perth, Australia, 2010b.
Daniell, J. E. and Vervaeck, A.: The 2011 Tohoku Earthquake – CATDAT Situation Reports 1–26, Earthquake-Report.com, 2011b.
Daniell, J. E., Wenzel, F., and Khazai, B.: The Cost of Historic Earthquakes Today – Economic Analysis since 1900 through the use of CATDAT, Paper No. 7, AEES 2010 Conference, Perth, Australia, 2010a.
Daniell, J. E., Daniell, K. A., Daniell, T. M., and Khazai, B.: A country level physical and community risk index in the Asia-Pacific region for earthquakes and floods, Paper No. 0392, 5th CECAR Conference Proceedings, Sydney, Australia, 2010c. Daniell, J. E., Khazai, B., and Wenzel, F.: Uncovering the mystery
of the Haiti death toll”, Disaster Prevention and Management, submitted, 2011a.
Daniell, J. E., Wenzel, F., and Khazai, B.: The Economics of Earth-quakes since 1900: The Hybrid Natural Disaster Economic Con-version Index, Historical Loss ConCon-version, Future Impacts and Insurance Takeout, Geophys. Res. Abstr., 13, EGU2011-4923, 2011d.
Dunbar, P. K., Lockridge, P. A., and Whiteside, L. S.: Catalog of Significant Earthquakes, 2150 B.C. – 1991 A.D. Including Quan-titative Casualties and Damage, NOAA National Geophysical Data Center Report SE-49, Boulder, Colorado, 1992.
EM-DAT – Below, R., Brechet, D., Guha-Sapir, D., Hargitt, D. and Hoyois, P.: Thirty Years of Natural Disasters, 1974–2003: The Numbers, Presses Universitaires de Louvain, Louvain-La-Neuve, Belgium, 2004.
EM-DAT: Emergency Management Database, CRED, Catholic University of Louvain, last accessed 08/2008 and 08/2010 – open data, available at: http://www.emdat.be, 2008, 2010.
Federal Emergency Management Agency: Earthquake Loss Esti-mation Methodology (HAZUS), National Institute of Building Sciences, Washington, DC, 2001.
Ganse, R. A. and Nelson J. B.: Catalog of significant earthquakes 2000 B.C. to 1979, including quantitative casualties and damage, Report SE-27, World Data Center A for Solid Earth Geophysics, 145 pp, 1981.
Google News: Google News, available at: http://news.google.com – includes references to all news outlets mentioned in this report, 2010.
Gu, G., Lin, T., and Shi, Z.: Catalogue of Chinese Earthquakes (1831 B.C. - 1969 A.D.)”, Science Press, Beijing, China [English translation], 1989.
Guha-Sapir, D. and Below, R.: The quality and accuracy of disas-ter data — a comparative analysis of three global data sets, The Pro Vention Consortium, The Disaster Management Facility, The World Bank, 2002.
Gutenberg, B. and Richter, C. F.: Seismicity of the Earth and As-sociated Phenomena (2nd Ed.), Princeton Univ. Press, Princeton, N. J., 310 pp., 1948.
Hoeppe, P.: Munich Re Tools for standardised NATCAT data col-lection and hazard mapping, 2nd Conference of the OECD Inter-national Network on the Financial Management of Large Scale Catastrophes, Geo Risks Research/Corporate Climate Centre, Presentation, 2009.
Horwich, G.: Economic Lessons of the Kobe Earthquake, Eco-nomic Development and Cultural Change, 48, 3, 521–542, 2000. International Monetary Fund (IMF): World Economic Outlook Databases (WEO), Online database, available at: http://www. imf.org/external/data.htm#data, 2010.
K´arn´ık, V.: Seismicity of the European Area – Part I, edited by: Reidel, D., Dordrecht, Holland, 1969.
KOERI: T¨urkiye Deprem Kataloˇgları, Kandilli Observatory and Earthquake Research Institute, Istanbul, available at: http://www. koeri.boun.edu.tr/sismo, 2010.
Kondorskaya, N. V. and Shebalin, N. V.: New Catalog of Strong Earthquakes in the USSR from Ancient Times through 1977, World Data Center A for Solid Earth Geophysics, Report SE-31, US Department of Commerce, NOAA, 1982.
Kramer, S. L.: Geotechnical Earthquake Engineering, Prentice-Hall, New Jersey, U.S.A., 1996.
Maddison, A.: The World Economy: Historical Statistics, Develop-ment Centre Studies, OECD, Paris, France, 288 pp, 2003.
Mallet, R.: Third Report on the Facts of Earthquake Phenomena – Catalogue of recorded earthquakes from 1606 B.C. to A.D. 1850, Rep. British Association for 1852, 1–176, ibid for 1853, 118– 212, ibid for 1854, 1–326, 1852.
Marano, K. D., Wald, D. J., and Allen, T. I.: Global earthquake ca-sualties due to secondary effects: a quantitative analysis for im-proving rapid loss analyses, Nat. Hazards, 52, 2, 319–328, 2010. Melissen, H.-J.: Haiti quake death toll well under 100 000, Radio
Netherlands Worldwide, 23 February 2010, 2010.
Milne, J.: Catalogue of Destructive Earthquakes A.D. 7–1899. Re-port 81st Meeting, Br. Assoc. Adv. Sci., Portsmouth 1911, 1912. Montandon, F.: Les tremblements de terre destructeurs en Europe,
UNESCO, Geneva, 1953.
MunichRe: Topics 2000 Natural catastrophes – the current position, Munich Reinsurance Company, 2000.
MunichRe: Topics: annual review, natural catastrophes 2002, Mu-nich Reinsurance Company, 15, 2002.
MunichRe (MRNATHAN): Globe of Natural Disasters, MR-NATHAN DVD, Munich Reinsurance Company, 2009. MunichRe: MunichRe Half Yearly NatCat Review, Webinar,
avail-able at: http://www.munichreamerica.com/webinars/2010 07 natcatreview/MR III 2010 HalfYear NatCat Review.pdf, 2010. M¨unchner R¨uckversicherungs-Gesellschaft: NatCat Service® – A
guide to the Munich Re database for natural catastrophes, Ger-many, 2003.
NGDC/NOAA: Significant Earthquakes Database and Significant Tsunami Database”, 2010 online searchable catalogue, available at: http://ngdc.noaa.gov, 2011.
Nichols, J. M. and Beavers, J. E.: World Earthquake Fatalities from the Past: Implications for the Present and Future, Nat. Hazards Rev., 9, 4, 179–189, 2008.
New York Times: 2000 Dead at Shemakha, 18 February 1902. London Times, New York Times: Seismic Disturbances Recom-mence – Number of Killed Now Placed at 5,000, 21 February 1902.
NLA: National Newspaper Archives 1802–1954, online searchable database of newspapers from around Australia including The Ad-vertiser, The Argus, Sydney Morning Herald, Brisbane Courier, Hobart Mercury etc., available at: http://newspapers.nla.gov.au, 2010.
PAGER-CAT: PAGER-CAT Earthquake Catalog, 2008 as described in Allen, T. I., Marano, K., Earle, P. S. and Wald, D. J.: PAGER-CAT: A composite earthquake catalog for calibrating global fa-tality models, Seism. Res. Lett., 80, 1, 50–56, 2009.
Papazachos, B. C. and Papazachou, C.: The Earthquakes of Greece, Ziti Editions, Thessaloniki, 304 pp, 1997.
PartnerRe: PartnerRe Press Center, available at: http://www. partnerre.com/news/, 2007.
Postpischl, D.: Catalogo dei Terremoti Italiani dall’Anno 1000 al 1980 (Catalog of Italian Earthquakes from 1000 up to 1980), Bologna, 239 pp. and subsequent updates, 1980.
ReliefWeb: OCHA ReliefWeb, available at: http://www.reliefweb. int, 2010.
RMS: Catastrophe Modeling and California Earthquake Risk: A 20-Year Perspective, Risk Management Solutions Special Re-ports, available at: http://www.rms.com/Publications/, 2009. RMS: Kocaeli, Turkey Earthquake, August 17, 1999, Risk
Paris, 335 pp. – and associated references, 1965.
Samardjieva, E. and Badal, J.: Estimation of the Expected Number of Casualties Caused by Strong Earthquakes, B. Seismol. Soc. Am., 92, 6, 2310–2322, 2002.
Scawthorn, C., Eidinger, J. M., and Schiff, A. J.: Fire Following Earthquake. Technical Council on Lifeline Earthquake Engineer-ing Monograph No. 26, American Society of Civil Engineers, Reston, 345 pp., 2005.
Sieberg, A.: Erdbebengeographie, Gutenberg (1929–1932), 688– 1005, 1932.
Silgado, E.: Historia de los Sismos m´as notables ocurridos en el Per´u (1513–1960), Bol. Bibliogr´afico de Geof´ısica y Oceanograf´ıa Americana, 4, M´exico, 1968.
Silgado, E.: Historia de los Sismos m´as notables del Per´u (1913– 1974). Instituto de Geolog´ıa y Miner´ıa, Journal No. 3, Series C, Lima, 1978.
Standard and Poor’s: Global Reinsurance Highlights: 2010 Edi-tion, available at: http://www2.standardandpoors.com/spf/pdf/ fixedincome/global reinsurance 2010.pdf, 2010.
Stein, S. and Wysession, M.: An Introduction to Seismology, Earth-quakes, and Earth Structure. Blackwell Publishing, Oxford, UK, 498 pp., 2003.
Swiss Re.: Quantifying Natural Hazards at Swiss Re, SOGI Feier-abend Forum, Swiss Reinsurance Company Pty Ltd, Bern, 2009. Swiss Re.: Sigma, Economic Research and Consulting, Swiss
Rein-surance Company Ltd., 1999–2009.
Transparency International: Global Corruption Report 2009 – Cor-ruption Perceptions Index, GCR-2009, 2009.
of Selected Data Sets on Natural Disasters and Impacts, Centre for Research on the Epidemiology of Disasters, Brussels, 2006. UNDP: Human Development Report 2010, Oxford University
Press, New York, 2010.
University of Richmond: The Disaster Database Project [database on the internet], Richmond (VA): University of Richmond, avail-able at: http://learning.richmond.edu/disaster/index.cfm, 2010. USAID: Building Assessments and Rubble Removal in
Quake-Affected Neighborhoods in Haiti, BARR Survey Final Report (Schwartz, Pierre and Calpas), LTL Strategies, 2011.
USGS: Historic World Earthquakes, available at: http://earthquake. usgs.gov/earthquakes/ – links to PDE, 2010a.
USGS: Earthquake Hazard Programme, available at: http:// earthquake.usgs.gov, 2010b.
Utsu, T.: A list of deadly earthquakes in the World: 1500-2000, in: International handbook of earthquake engineering and seismol-ogy, edited by: Lee, W. K., Kanamori, H., Jennings, P. C., and Kisslinger, C., Amsterdam, Academic Press, 691–717, 2002. World Bank: GEM (Global Economic Monitor) & World
Devel-opment Indicators, online databases, available at: http://data. worldbank.org/data-catalog, 2010.
Yong, C., Tsoi, K.-L., Feibi, C., Zhenhuan, G., Qijia, Z., and Zhangli, C.: The Great Tangshan Earthquake of 1976: An Anatomy of Disaster, Pergamon Press, Oxford. 153 pp., 1998. Zhang, S.: Chinese seismologists increase Haiyuan earthquake