www.nat-hazards-earth-syst-sci.net/8/941/2008/ © Author(s) 2008. This work is distributed under the Creative Commons Attribution 3.0 License.
and Earth
System Sciences
Statistical approach to storm event-induced landslides susceptibility
C.-T. Lee1, C.-C. Huang2, J.-F. Lee2, K. -L. Pan1, M.-L. Lin3, and J.-J. Dong1
1Institute of Applied Geology, National Central University, No.300, Jungda Rd., Jungli City, Taoyuan County, 32001, Taiwan 2Central Geological Survey, Ministry of Economic Affairs, No.2, Lane 109, Huashin Street, Chungho City, Taipei County,
23500, Taiwan
3Department of Civil Engineering, National Taiwan University, No.1, Sec.4 Roosevelt Rd. Taipei, 10617, Taiwan
Received: 4 April 2008 – Revised: 4 August 2008 – Accepted: 4 August 2008 – Published: 29 August 2008
Abstract. For the interpretation of the storm event-induced landslide distribution for an area, deterministic methods are frequently used, while a region’s landslide susceptibility is commonly predicted via a statistical approach based upon multi-temporal landslide inventories and environmental fac-tors. In this study we try to use an event-based landslide inventory, a set of environmental variables and a triggering factor to build a susceptibility model for a region which is solved using a multivariate statistical method. Data for shal-low landslides triggered by the 2002 typhoon, Toraji, in cen-tral western Taiwan, are selected for training the suscepti-bility model. The maximum rainfall intensity of the storm event is found to be an effective triggering factor affecting the landslide distribution and this is used in the model. The model is built for the Kuohsing region and validated using data from the neighboring Tungshih area and a subsequent storm event – the 2004 typhoon, Mindulle, which affected both the Kuohsing and the Tungshih areas. The results show that we can accurately interpret the landslide distribution in the study area and predict the occurrence of landslides in the neighboring region in a subsequent typhoon event. The ad-vantage of this statistical method is that neither hydrological data, strength data, failure depth, nor a long-period landslide inventory is needed as input.
1 Introduction
To study storm event-induced landslides on a regional scale, a deterministic physical-based method is commonly used which requires the employment of an infinite-slope model and a hydrological model (Okimura and Ichikawa, 1985; Di-etrich et al., 1986, 1995; Keefer et al., 1987; Montgomery
Correspondence to: C.-T. Lee
(ct@ncu.edu.tw)
and Dietrich, 1994; Wu and Sidle, 1995; Montgomery et al., 1998; Terlien, 1998; Crozer, 1999; Polemic and Sdao, 1999; Iverson, 2000; Borga et al., 2002; Wilkinson et al., 2002; Crosta and Frattini, 2003; Malet et al., 2005; Baum et al., 2005; Salciarini et al., 2006; Claessens et al., 2007a, 2007b; Schmidt et al., 2008). This approach requires the strength parameters, failure depth and soil conductibility for every point in the limit-equilibrium slope stability calculation, a requirement which can cause serious problems in terms of acquisition and control of spatial variability of the variables (Hutchinson, 1995; Guzzetti et al., 1999).
942 C.-T. Lee et al.: Statistical approach to storm landslides susceptibility method still needs validated and further defined for different
environments.
Multi-temporal landslide inventories are not yet available for Taiwan. However, several typhoons (tropical cyclones) strike Taiwan every year, which has given us the opportu-nity to map an event-based landslide inventory for each ma-jor typhoon. In this study we use an event-based landslide inventory, considering rainfall as an independent variable in our multivariate statistical susceptibility model. We care-fully compare pre-event and post-event landslide inventories to produce an event-based landslide inventory. We select data for the shallow landslides triggered by the 2002 typhoon Toraji in the Kuohsing region in central western Taiwan to train the susceptibility model. The susceptibility model is then validated using data from the neighboring Tungshih re-gion, as well as data from a subsequent storm event – the 2004 typhoon, Mindulle. The advantages and shortcomings, as well as practical use of this statistical method are dis-cussed.
2 Regional settings and storm events
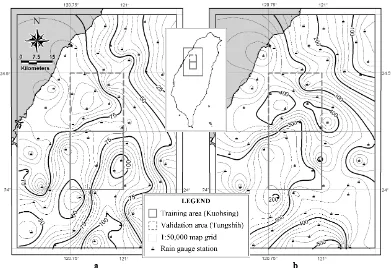
The study area comprises the Kuohsing and Tungshih quad-rangles (coincide with the 1 to 50 000 scale map of Tai-wan; 705.3 km2and 703.9 km2in area), which are located in central western Taiwan (Fig. 1). Kuohsing is east of the Taichung Basin where metropolitan Taichung is located, and west of the Central Range. Tungshih is located immediately north of Kuohsing. Geologically, the area falls partly in the Western Foothills geologic province (western part) and partly in the Hsueshan Range sub-province of the Central Range geologic province (eastern part). The Western Foothills are characterized by fold-and-thrust Neogene sedimentary strata; the Hsueshan Range is typically characterized by a Pale-ogene slate belt of argillite and quartzitic sandstone (Ho, 1975). The Shuilikeng Fault forms a boundary between these two provinces (see Fig. 1).
Geomorphologically, the study area can be divided into two types of terrains by the Hsuangtung Fault: western hilly terrain and eastern mountainous terrain. The elevation in the hilly terrain is generally less than 500 m with rocks consist-ing of weakly cemented Pliocene and Pleistocene mudstone, sandstone and conglomerate. The elevation in the mountain-ous terrain is generally greater than 500 m with many peaks exceeding 1000 m with rocks consisting of better-indurate Eocene, Oligocene and Miocene, sandstone, shale, argillite and quartzite. The geomorphic appearance in the hilly ter-rain is more fragmented with short slopes, while the moun-tainous terrain is solider and has longer slopes. Typical slope gradients in the hilly terrain are between 10◦and 30◦, with a mode of about 16◦, while in the mountainous terrain, typi-cal slope gradients are between 10◦and 45◦, with a mode of about 26◦.
The study area has a subtropical climate with average an-nual precipitation of about 2400 mm, and on average, 159 rainy days per year. Approximately three typhoons strike this area each year, mostly between July and October. The heav-iest rainfall typically occurs in June, July and August; with a monthly average during that period of about 400 mm. In the dry season, October through March, the monthly average precipitation is about 80 mm with a monthly average of about 8 rainy days. The sloped lands are usually green and covered with vegetation. Gentle or moderate slope with gradients less than 30% are usually cultivated while steep slopes tend to be covered by bushes and shrubbery. Underneath the hill sur-face, the slopes in the study region are for the most part man-tled by permeable colluvium soils. Although the slopes in the study area are green, shallow landslides are common during a major earthquake or a typhoon event.
A disastrous earthquake – theMw7.6 Chi-Chi earthquake
– occurred on 21 September 1999 in central western Tai-wan (Ma et al., 1999; Kao and Chen, 2000). A huge thrust ruptured along the Chelungpu fault about 3 km west of the Kuohsing quadrangle, extending into the southwest corner of the Tungshih quadrangle. The Kuohsing quadrangle and most of the Tungshih quadrangle are located on the hang-ing wall of the thrust fault. These areas suffered from se-vere shaking during the main shock and aftershocks trigger-ing 9272 large landslides (with areas greater than 625 m2), with a total area of 127.8 km2(Liao and Lee, 2000).
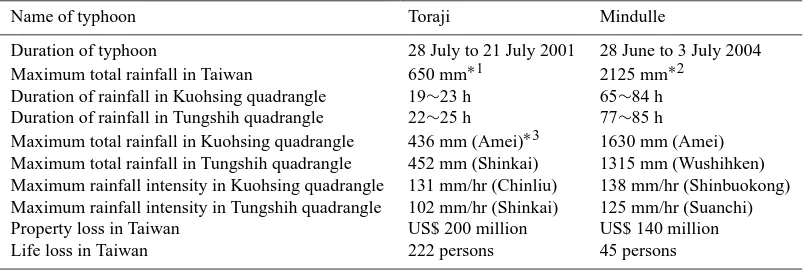
After the 1999 Chi-Chi earthquake disaster, two major ty-phoons struck Taiwan, reactivating many landslides, espe-cially in central western Taiwan, where slopes had already been damaged or destabilized by the earthquake (Liao et al., 2002). Typhoon Toraji passed through Taiwan from 28 July to 31 July 2001. Typhoon Mindulle passed over Taiwan from 28 June to 3 July 2004. The properties of the rainfall and losses due to these two typhoons are listed in Table 1. Storm-induced landslides became a big problem after the 1999 Chi-Chi earthquake. Debris flows and sediment transport became a major problem for governmental authorities to cope with. Although typhoon Mindulle brought a maximum total pre-cipitation of 2125 mm to Taiwan, it caused less loss than Toraji did. This may have been due to a more developed hazard mitigation program and evacuation of people by the government before the typhoon hazard occurred.
3 Methodology
a c
b d
Fig.1
Fig. 1. Location and geology of the study sites: (a) geologic map of Tungshih quadrangle; (b) geologic map of Kuohsing quadrangle; (c)
geologic provinces of Taiwan and index map; (d) legend for geologic maps.
needs of this project have given birth to several problems. Firstly, since multi-temporal landslide inventories are not yet available, and air-photos with good coverage and good time resolution are only available back to 1979, it is difficult to depend upon the use of a multi-temporal landslide inventory. Secondly, the interruption of landslide time-sequence data by strong earthquakes (such as the Chi-Chi earthquake), may bias the data set used to train a susceptibility model. Thirdly,
since we need 263 maps cover the whole of Taiwan, ways to preserve the continuity and consistency between adjoining maps are crucial.
944 C.-T. Lee et al.: Statistical approach to storm landslides susceptibility
Table 1. Rainfall characteristics and losses during the typhoon Toraji and the typhoon Mindulle.
Name of typhoon Toraji Mindulle
Duration of typhoon 28 July to 21 July 2001 28 June to 3 July 2004
Maximum total rainfall in Taiwan 650 mm∗1 2125 mm∗2
Duration of rainfall in Kuohsing quadrangle 19∼23 h 65∼84 h
Duration of rainfall in Tungshih quadrangle 22∼25 h 77∼85 h
Maximum total rainfall in Kuohsing quadrangle 436 mm (Amei)∗3 1630 mm (Amei)
Maximum total rainfall in Tungshih quadrangle 452 mm (Shinkai) 1315 mm (Wushihken)
Maximum rainfall intensity in Kuohsing quadrangle 131 mm/hr (Chinliu) 138 mm/hr (Shinbuokong)
Maximum rainfall intensity in Tungshih quadrangle 102 mm/hr (Shinkai) 125 mm/hr (Suanchi)
Property loss in Taiwan US$ 200 million US$ 140 million
Life loss in Taiwan 222 persons 45 persons
Note,∗1: At the Nantienchi gauge station in Kaohsiung County, southern Taiwan.
∗2: At the Shihnan gauge station in Kaohsiung County, southern Taiwan.
∗
3: Name in Parentheses is name of gauge station in the quadrangle.
an event-based landslide inventory and event-based landslide susceptibility analysis (EB-LSA). We tested the EB-LSA for different regions and different events in Taiwan before pub-lishing an EB-LSA for earthquake-induced landslides in the Kuohsing area (Lee et al., 2008).
3.1 Methods and working procedure
The methods and working procedure utilized in the present study of storm-induced landslides generally follow those of Lee et al. (2008). The first step includes image and data col-lection, after which an event-based landslide inventory is es-tablished (in this case for a storm event). In parallel with this, the causative factors of the landslides are processed and the triggering factors determined. These factors are then statisti-cally tested, and the effective factors selected for susceptibil-ity analysis. Each selected factor is rated, and their weighting analyzed.
Discriminant analysis allows us to determine the maxi-mum difference for each factor between the landslide group and the non-landslide group, as well as the apparent weights of the factors. A linear weighted summation of all factors is used to calculate the landslide susceptibility index (LSI) for each grid point. The LSIs are used to establish a landslide ratio to LSI curve and determine the spatial probability of landslide at each grid point. The landslide ratio used here is the ratio of landslide pixels to total pixels in an LSI interval (Lee et al., 2005, 2008), called the proportion of landslide cells in Jibson et al. (2000). The spatial probability of land-slides is then used for landslide susceptibility mapping. For a more detailed description of EB-LSA, please refer to Lee et al. (2008).
3.2 Selection of causative factors
There are more than fifty different landslide-related factors commonly used (both in Taiwan and worldwide) for LSA (Lin, 2003). In the present storm event-induced landslide study, we selected fourteen of the most frequently used, based on data abundance and availability. These causative factors were lithology, slope gradient, slope aspect, terrain roughness, slope roughness, total curvature (Wilson and Gal-lant, 2000), local slope height, total slope height, topo-graphic index (Kirkby, 1975), distance from a road, distance from a fault, distance from a river head, distance from a river bend, and the normalized differential vegetation index (NDVI, Paruelo et al., 2004).
These factors were further tested, including the normal-ity of each factor, correlation coefficient between any two factors, and calculation of standardized differences (Davis, 2002) between the landslide group and non-landslide group for each factor. A final selection of effective factors was de-cided based upon the evaluation and test results.
3.3 Selection of a triggering factor
be neglected as just having a minor effect. Vegetation cover is reflected by the NDVI. Instead of slope length and upslope area, we used a total-slope-height factor and the topographic index. The soils are loose and permeable colluvium. We may assume that the colluvium soils within a lithologic unit will have similar properties but that there will be variations between different lithologic units. Therefore, the lithology factor is also related to hillslope hydrology.
To include the above-mentioned causative factors in the statistical susceptibility model may connect rainfall to the triggering of slope instability, and help in our interpretation of the physical meaning. Rainfall intensity and duration or cumulative rainfall are the most commonly used factors to delineate landslide occurrence (Zezere and Rodrigues, 2002; Guzzetti et al., 2007). In this study, the maximum hourly rainfall (maximum rainfall intensity), the rolling 24-h rain-fall, and the total rainfall of the storm event were considered as candidate triggering factors. These factors were statisti-cally tested, and evaluated to make a final decision.
3.4 Assessment of model performance and validation The error matrix (Stehman, 1997), the receiver operating characteristic (ROC) (Swets, 1988), and the prediction rate curve (Chung and Fabbri, 2003) are the most commonly used methods to assess a model’s performance in landslide and other types of studies. For both the error matrix and the ROC, the classification of true positives and false positives are needed; a probability value of 0.5 is used in the logit model to determine whether the model has made a correct prediction (>0.5) or not (<0.5); a discriminant indexλ0is used in the discriminant analysis to determine whether the model has made a correct prediction (>λ0) or not (<λ0). This clear cut boundary is deemed to be not as friendly as the prediction rate curve, which needs only successive classes to reflect the landslide potential. Furthermore, we used a dis-criminant function to develop the LSIs;λ0was not used in the discriminant model. Therefore, the prediction rate curve was selected in the present study.
Landslide data used to establish the model were first grouped into several classes according to their LSIs. The number of landslide pixels in each class was then divided by the total number of pixels in that class, and a cumulative curve was plotted. The area under the curve (AUC) is be-tween 0 and 1; a higher value indicates a higher prediction rate, whereas a value near 0.5 means the prediction is no bet-ter than a random guess (Chung and Fabbri, 2003). In the as-sessment, we classify AUC=0.9 as excellent, 0.9>AUC=0.8 as good, 0.8>AUC=0.7 as fair, 0.7>AUC=0.6 as poor, AUC<0.6 as very poor.
The prediction rate curve may be used to assess the predic-tion performance of the model, or used to validate a model using different data sets. When the prediction rate curve is used to assess model performance, we use the same data set as for building the model to compute a success rate curve
(Chung and Fabbri, 1999). The success rate curve is used to indicate how well the model fits the data.
4 Data acquisition and processing
The basic data utilized in this study included a 40 m×40 m grid digital elevation model (DEM), SPOT images, 1/5000 photo-based contour maps, 1/50 000 geologic maps, and hourly rainfall data. The DEMs were collected by the Aerial Survey Office of Taiwan’s Forestry Bureau. They were trans-ferred to a color-shaded image and were visually checked. Defects were replaced by re-digitizing from a 1/5000 scale photo-based contour map. Other abnormal points were cor-rected using a median filter. Finally the DEMs were interpo-lated to a 20 m×20 m grid cells using cubic spline interpola-tion.
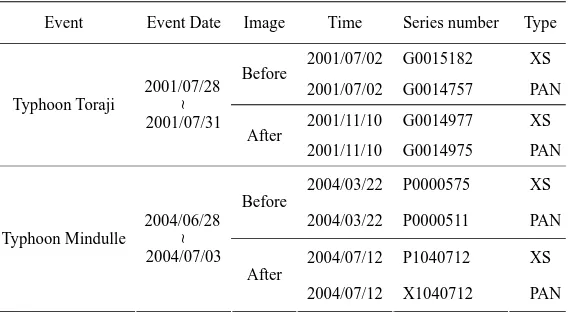
Selected SPOT images taken before and after the typhoon events are shown in Table 2. All SPOT images were re-ceived, processed and rectified by the Center for Space and Remote Sensing Research, National Central University, Tai-wan. Both multi-spectral (XS) and panchromatic (PAN) im-ages were used. A fusing technique (Liu, 2000) was utilized to produce a higher resolution false-color composite image to facilitate landslide recognition. The pixel resolution after fusing was 6.25 m.
1/50 000 geological maps were collected from the CGS. Each map was overlaid with a shaded DEM and visually in-spected in a Geographic Information System (GIS). Some abnormal boundaries, mostly associated with alluvial and ter-race deposits, were corrected. The ERDAS IMAGINE sys-tem (ERDAS, 1997) was used to transform the geologic vec-tor map to a raster image of 20 m×20 m grid cells.
The hourly rainfall data in and around the study region were collected from the Central Weather Bureau and the Wa-ter Resources Agency, Taiwan. These data were first plot-ted and visually inspecplot-ted to compare individual records for consistency with neighboring gauge stations; abnormal data was deleted. Rainfall data were finally interpolated into 20 m×20 m grid cells data as will be explained in Sect. 4.3. All later processing and analysis for each susceptibility factor and for the EB-LSA are based on the 20 m×20 m grid-cells unit.
4.1 Event-based landslide inventories
946 C.-T. Lee et al.: Statistical approach to storm landslides susceptibility
Table 2. SPOT images used in the Kuohsing quadrangle.
Table 2 SPOT images used in the Kuohsing quadrangle
Event Event Date Image Time Series number Type 2001/07/02 G0015182 XS Before
2001/07/02 G0014757 PAN 2001/11/10 G0014977 XS Typhoon Toraji
2001/07/28
~
2001/07/31 After
2001/11/10 G0014975 PAN 2004/03/22 P0000575 XS Before
2004/03/22 P0000511 PAN 2004/07/12 P1040712 XS Typhoon Mindulle
2004/06/28
~
2004/07/03 After
2004/07/12 X1040712 PAN
Table 3 SPOT images used in the Tungshih quadrangle
Event Event Date Image Time Series number Type 2001/03/05 G0014517 XS Before
2001/03/05 G0014518 PAN 2001/11/10 G0014989 XS Typhoon Toraji
2001/07/28
~
2001/07/31 After
2001/11/10 G0014990 PAN 2004/04/12 P0000573 XS Before
2004/04/12 P0000526 PAN 2004/07/13 P1040713 XS 2004/07/13 X1040713 PAN Typhoon Mindulle
2004/06/28
~
2004/07/03 After
2004/08/26 A0408032 XS Event Event Date Image Time
Table 3. SPOT images used in the Tungshih quadrangle.
Table 2 SPOT images used in the Kuohsing quadrangle
Event Event Date Image Time Series number Type 2001/07/02 G0015182 XS Before
2001/07/02 G0014757 PAN 2001/11/10 G0014977 XS Typhoon Toraji
2001/07/28
~
2001/07/31 After
2001/11/10 G0014975 PAN 2004/03/22 P0000575 XS Before
2004/03/22 P0000511 PAN 2004/07/12 P1040712 XS Typhoon Mindulle
2004/06/28
~
2004/07/03 After
2004/07/12 X1040712 PAN
Table 3 SPOT images used in the Tungshih quadrangle
Event Event Date Image Time Series number Type 2001/03/05 G0014517 XS Before
2001/03/05 G0014518 PAN 2001/11/10 G0014989 XS Typhoon Toraji
2001/07/28
~
2001/07/31 After
2001/11/10 G0014990 PAN 2004/04/12 P0000573 XS Before
2004/04/12 P0000526 PAN 2004/07/13 P1040713 XS 2004/07/13 X1040713 PAN Typhoon Mindulle
2004/06/28
~
2004/07/03 After
2004/08/26 A0408032 XS Event Event Date Image Time
a susceptibility model (Weirich and Blesius, 2007); missing some small landslides is not an important issue.
SPOT images taken before and after the 2 typhoon events were selected for each quadrangle (Tables 2 and 3) from which two event-based landslide inventories for each of the two quadrangles were prepared. A pre-event landslide inven-tory was prepared for each event from a SPOT image taken before the event; a post-event landslide inventory was pre-pared from an image taken after that event, and finally an event-based landslide inventory was derived by comparing the pre-event and post-event inventories. An event-induced landslide could be absent from the pre-event landslide inven-tory, or present in both inventories (re-activated landslide). Landslides found in both inventories were examined very carefully for changes in tone and/or enlargement of extent (Pan et al., 2004).
We found that landslide deposit areas should be included in the above-mentioned landslide mapping procedure. Since potential landslide sources are of interest in susceptibility analysis, only source areas may be used to train the suscep-tibility model. Therefore, we had to differentiate between source areas and actual deposit areas. Landslide deposits were identified by comparing the GIS landslide layer with the 1/5000 scale photo-based contour map. The slope angle or concentration of contour lines was used to differentiate deposits from sources.
Pre-event inventory
Post-event inventory Event-triggered
inventory
a
b
Fig. 2. Spatial distribution of landslides in the study region. (a) Typhoon Toraji, (b) typhoon Mindulle. Upper quadrangle is the Tungshih
948 C.-T. Lee et al.: Statistical approach to storm landslides susceptibility
Table 4. Landslide numbers and areas in the Kuohsing and Tungshih quadrangles.
Typhoon/quadrangle Pre-event existing landslides Post-event total landslides Event-triggered landslides
Number Area (ha.) Number Area (ha.) Number Area (ha.)
Toraji/KH 3147 1847 3772 1973 1772 715
Mindulle/KH 3872 568 5604 866 3415 651
Toraji/TS 1674 380 2928 788 2127 676
Mindulle/TS 3159 557 4171 626 2575 542
Note: KH: Kuohsing quadrangle; TS: Tungshih quadrangle.
Fig. 3
Fig. 3. Schematic map showing the definition of factors. (A)
eleva-tion of crest, (B) horizontal distance to drainage, (C) height relative to riverbed, (D) elevation of toe, (E) total slope height, (F) height relative to crest, (G) height relative to toe, (H) horizontal distance to crest, (I) horizontal distance to toe, (J) horizontal distance between crest and toe, (K) slope length.
by the two events is summarized in Fig. 2, and listed in Ta-ble 4. Only source areas of shallow landslides (including rock falls), were used in the susceptibility analysis. Deep seated slides, rock avalanches (located outside the present study area) and debris flows were excluded in the present study.
4.2 Landslide causative factors
The data set for each terrain was divided into a landslide group and a non-landslide group. Tests of normality for each factor, the calculation of the correlation coefficient between any two factors, and the calculation of standardized differ-ences between the landslide group and non-landslide group for each factor were performed in order to select effective factors for the discriminant analysis. Eight causative fac-tors – lithology, slope gradient, slope aspect, terrain rough-ness, slope roughrough-ness, total curvature, total slope height, and
NDVI – were judged to be effective factors to be used in the discriminant analysis. Six of them have also been used for earthquake-induced landslide susceptibility analysis by Lee et al. (2008), whereas the NDVI factor and the total-slope-height factor are additional factors.
The NDVI is an environmental factor indicating the abun-dance of vegetation cover at a specific pixel point, and may be used as an indicator at land-use. A higher NDVI value in-dicates denser vegetation. Denser vegetation increases pre-cipitation interception, and decreases the amount of infil-tration, whereas barer land areas will have higher infiltra-tion rates, which are associated with higher soil water levels, which in turn contributes to slope failure. To obtain accu-rate land-use information for establishing the susceptibility model, the NDVI should be calculated from an image taken prior to a storm event.
The total-slope-height for a given point on a slope is de-fined as the height of the upper slope above the point (height from point to crest) plus the slope height below the point (height from toe to point) (F+G in Fig. 3). The total-slope-height factor may be physically related to the magnitude of the stress and the pore-water pressure in the lower slope; for long slopes the surface and subsurface water is more likely to be concentrated in the lower slope, causing instability. It has been observed that storm-induced landslides tend to oc-cur relatively low on the slopes (Chang and Hsu, 2004).
The topographic index, which is defined as the area drain-ing through a point from upslope divided by the local slope gradient at that point (Kirkby, 1975), is an important hydro-logical factor related to landslides. However, it was found to be ineffective for discriminating between the landslide and non-landslide group data. This unusual result may be due to the weakening of ridges in this study area by the coseismic shaking of the Chi-Chi earthquake, so that many landslides occurred on the upper-slopes close to the ridge tops. The oc-currence of these landslides was due to weak soil strength and open cracks on the slope which allowed overland flows to seep into the soil.
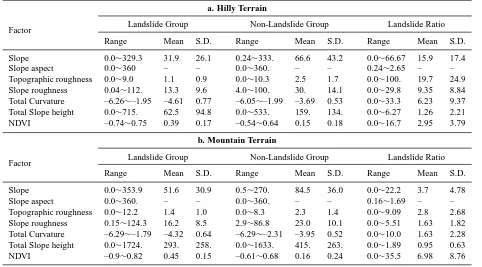
Table 5. Descriptive statistics of causative factors other than lithology.
a. Hilly Terrain
Factor Landslide Group Non-Landslide Group Landslide Ratio
Range Mean S.D. Range Mean S.D. Range Mean S.D.
Slope 0.0∼329.3 31.9 26.1 0.24∼333. 66.6 43.2 0.0∼66.67 15.9 17.4
Slope aspect 0.0∼360 – – 0.0∼360. – – 0.24∼2.65 – –
Topographic roughness 0.0∼9.0 1.1 0.9 0.0∼10.3 2.5 1.7 0.0∼100. 19.7 24.9
Slope roughness 0.04∼112. 13.3 9.6 4.0∼100. 30. 14.1 0.0∼29.8 9.35 8.84
Total Curvature –6.26∼–1.95 –4.61 0.77 –6.05∼–1.99 –3.69 0.53 0.0∼33.3 6.23 9.37
Total Slope height 0.0∼715. 62.5 94.8 0.0∼533. 159. 134. 0.0∼6.27 1.26 2.21
NDVI –0.74∼0.75 0.39 0.17 –0.54∼0.64 0.15 0.18 0.0∼16.7 2.95 3.79
b. Mountain Terrain
Factor Landslide Group Non-Landslide Group Landslide Ratio
Range Mean S.D. Range Mean S.D. Range Mean S.D.
Slope 0.0∼353.9 51.6 30.9 0.5∼270. 84.5 36.0 0.0∼22.2 3.7 4.78
Slope aspect 0.0∼360. – – 0.0∼360. – – 0.16∼1.69 – –
Topographic roughness 0.0∼12.2 1.4 1.0 0.0∼8.3 2.3 1.4 0.0∼9.09 2.8 2.68
Slope roughness 0.15∼124.3 16.2 8.5 2.9∼86.8 23.0 10.1 0.0∼5.51 1.63 1.82
Total Curvature –6.29∼–1.79 –4.32 0.64 –6.29∼–2.31 –3.95 0.52 0.0∼10.0 1.63 2.28
Total Slope height 0.0∼1724. 293. 258. 0.0∼1633. 415. 263. 0.0∼1.89 0.95 0.63
NDVI –0.9∼0.82 0.45 0.15 –0.61∼0.68 0.16 0.24 0.0∼35.5 6.98 8.76
Table 6. Descriptive statistics of lithology factor.
Lithology Hilly Terrain Mountain Terrain
% of study area Landslide ratio % of study area Landslide ratio
#1 5.66 0.01 7.12 0.44
#2 4.25 0.00 4.33 0.19
#3 13.49 0.00 2.09 0.00
#4 6.04 1.30 0.05 0.00
#5 46.16 2.52 0.59 1.25
#6 23.46 0.07 0.06 0.00
#7 – – 0.01 0.00
#8 0.44 0.10 10.84 0.70
#9 0.49 0.23 10.24 0.40
#10 – – 4.21 0.06
#11 – – 1.42 0.10
#12 – – 4.55 0.09
#13 – – 12.89 0.76
#14 – – 32.81 1.16
#15 – – 8.79 2.34
950 C.-T. Lee et al.: Statistical approach to storm landslides susceptibility
Total-Slope-Height NDVI
a b
Fig. 4
m 0 1760 -0.2 0.8Fig. 4. Spatial distribution of original values of causative factors in the Kuohsing quadrangle. (left) Total-slope-height, (right) NDVI.
0 50 100 150 200 250 0% 5% 10% 15% 20% 25%
0 50 100 150 200 250 0%
4% 8% 12%
0 50 100 150 200 250 0%
10% 20% 30% 40%
a b c
0 100 200 300 0%
2% 4% 6%
0 100 200 300 0% 1% 2% 3% 4% 5%
0 100 200 300 400 0%
1% 2% 3%
d e f
0 2 4 6 8 10 0%
4% 8% 12% 16%
0 2 4 6 8 10 0%
4% 8% 12%
0 2 4 6 8 10 0% 20% 40% 60% 80% 100%
g h i
0 10 20 30 40 50 60 70 0% 4% 8% 12% 16% 20%
0 20 40 60 0% 4% 8% 12% 16% 20%
0 10 20 30 40 50 60 70 0% 4% 8% 12% 16% 20%
j k l
Frequency Slope, % Mountain Terrain Landslide R atio Slope, % Hilly Terrain
y= 0.17x – 10.36
Mountain Terrain
y = 0.065x – 3.79
Slope, % Hilly Terrain Frequency Landslide R atio
Slope Aspect, degree
Mountain Terrain
y =0.64sin(πx/180 -1.05) + 0.83 y =1.15sin(πx/180 -1.37) + 1.29
Hilly Terrain
Frequency
Slope Aspect, degree Mountain Terrain
Slope Aspect, degree Hilly
Terrain
Frequency
Frequency
Slope roughness, % Mountain Terrain
Landslide R
atio
Slope roughness, %
Hilly Terrain
y = 0.34x – 4.65
y = 0.13x – 1.46
Slope roughness, % Hilly Terrain
Frequency
Frequency
Terrain roughness, % Mountain Terrain
Landslide R
atio
Terrain roughness, %
Hilly Terrain
y = 4.34x – 5.61
Mountain Terrain
y = 0.77x + 0.22
Terrain roughness, % Hilly Terrain
Frequency
Mountain Terrain
-6 -5 -4 -3 -2 0% 2% 4% 6% 8% 10%
-6 -5 -4 -3 -2 0% 2% 4% 6% 8% 10%
-6 -5 -4 -3 -2 0%
10% 20% 30% 40%
m n o
0 100 200 300 400 500 0% 10% 20% 30% 40% 50%
0 400 800 1200 0% 5% 10% 15% 20% 25%
0 400 800 1200 0%
2% 4% 6% 8%
p q r
-0.4 -0.2 0 0.2 0.4 0.6 0%
4% 8% 12% 16%
-0.5 0 0.5 0% 4% 8% 12% 16% 20%
-0.5 0 0.5 0% 5% 10% 15% 20% 25%
s t u
0 2 4 6 8 10 12 14 16 0% 10% 20% 30% 40% 50% Non-Landslide Landslide
0 2 4 6 8 10 12 14 16 0% 10% 20% 30% 40% 50% Non-Landslide Landslide
0 2 4 6 8 10 12 14 16 0% 1% 2% 3% Hilly Terrain Mountain Terrain
v w x
Landslide R
atio
Total Curvature, log(radius/m) Mountain Terrain
y =2.84x + 11.96
Hilly Terrain
y =13.58x + 53.46
Frequency
Total Curvature, log(radius/m)
Mountain Terrain
Total Curvature, log(radius/m)
Hilly Terrain
Frequency
Frequency
Total Slope height, m Mountain Terrain
Landslide R
atio
Total Slope height, m
Hilly Terrain
y = 0.022x – 1.31
Mountain Terrain
y = 0.001x + 0.55
Total Slope height, m Hilly Terrain Frequency Frequency Lithology Mountain Terrain Landslide R atio Lithology Lithology Hilly Terrain Frequency Frequency NDVI Mountain Terrain Landslide R atio NDVI Hilly Terrain
y = -12.15x + 5.94
Mountain Terrain
y = -27.15x + 8.14
NDVI Hilly Terrain
Frequency
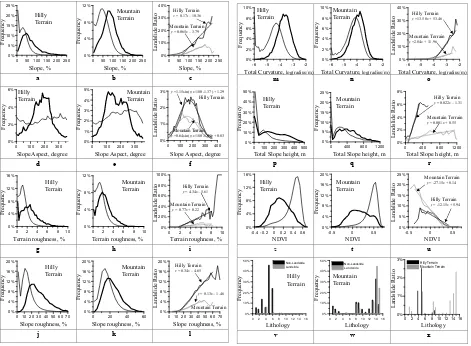
Fig. 5. Frequency distribution of landslide and non-landslide group and landslide ratio of factors for the Toraji typhoon event in different
Fig. 6
a b
Fig. 6. Rainfalls in Toraji typhoon event. (a) Maximum rainfall isopleths, (b) total rainfall isopleths.
developed for this study. The spatial distribution of the total-slope-height and NDVI factors are shown in Fig. 4; those for the slope gradient, slope aspect, topographic roughness, slope roughness, total curvature and lithology are similar to those in Fig. 4 in Lee et al. (2008) so it is not necessary to repeat them here. The descriptive statistics for the causative factors are listed in Tables 5 and 6. Plots of the frequency distributions of the landslide and non-landslide groups in the different terrains (hilly terrain and mountainous terrain) are shown in the left and middle columns of Fig. 5. The right-hand column shows the landslide ratios with respect to the factor values. There is a positive correlation between the factor and corresponding landslide ratio for both hilly ter-rain and mountainous terter-rain for slope gradient, topographic roughness, slope roughness, total curvature and total-slope-height (Fig. 5c, i, l, o, r). A straight line may be fitted be-tween the lower and upper bounds. There is a negative corre-lation between NDVI and landslide ratio for both hilly terrain and mountainous terrain (Fig. 5u). A straight line may also be fitted between the lower and upper bounds. All plots were visually inspected and evaluated. The landslide ratio of the slope aspect shows a sinusoidal curve (Fig. 5f), and a sinu-soid is fitted.
A factor was assigned a rating according to its landslide ratio. The rated values were then normalized to be between 0 and 1, with 0 being a factor with a value less than or equal to its lower threshold and 1 being a factor value greater than or equal to its upper bound. Although the lithology factor data
are categorical in nature, a landslide ratio can also be found for each lithologic unit, and a normalized score between 0 and 1 assigned.
4.3 Landslide triggering factors
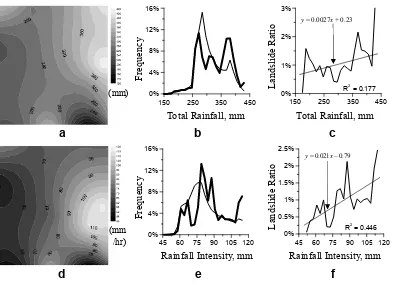
In this study we used data from 68 rain gauge stations located within the 12 map quadrangles in the study area: 5 stations in the Kuohsing quadrangle and 11 in the Tungshih quadrangle (Fig. 6). Each rainfall record plotted was checked visually, and abnormal data were not used. Maximum rainfall inten-sity and total rainfall values were calculated station by station and then interpolated for each grid point using the ordinary Kriging method (Goovaerts, 1997). Because the duration of rainfall at the rain gauge stations in the Kuohsing quadrangle ranged from 19 to 23 h, neither maximum daily rainfall nor rolling 24-h rainfall were considered.
The frequency distribution of the landslide and non-landslide groups as well as non-landslide ratio for these factors were tested, plotted, and the results examined (Fig. 7a–f). Both the total rainfall and the maximum rainfall intensity fac-tors were tested statistically for effectiveness at discriminat-ing between the landslide group and the non-landslide group, based on which the maximum rainfall intensity was selected as the triggering factor for the storm-induced LSA.
952 C.-T. Lee et al.: Statistical approach to storm landslides susceptibility
0%150 250 350 450 4%
8% 12% 16%
150 250 350 450
0% 1% 2% 3%
a b c
45 60 75 90 105 120
0% 4% 8% 12% 16%
45 60 75 90 105 120
0% 0.5% 1% 1.5% 2% 2.5%
d e f
Fig. 7
Frequency
Total Rainfall, mm
Frequency
Rainfall Intensity, mm (mm
/hr) (mm)
Rainfall Intensity, mm
Landslide R
atio
y = 0.021x – 0.79
R2 = 0.446
Landslide R
atio
Total Rainfall, mm
y = 0.0027x + 0.23
R2 = 0.177
Fig. 7. Results of rainfall analysis for the Toraji typhoon event in the Kuohsing quadrangle. Upper row (a, b, c) for total rainfall, lower row (d, e, f) for maximum rainfall intensity. Left column (a, d) for spatial distribution of rainfall. Middle column (b, e) for frequency distribution
of the landslide group (thick line) and non-landslide group (thin line). Right column (c, f) for landslide ratio vs. total rainfall and maximum rainfall intensity, respectively. Regression lines are indicated.
Fig. 8
0 0.2 0.4 0.6 0.8 1
Landslide susceptibility index 0
0.2 0.4 0.6 0.8
P
robabilit
y of
failur
e
0 0.2 0.4 0.6 0.8 1
Landslide susceptibility index 0
0.2 0.4 0.6
P
rob
abilit
y of
f
ailu
re
a b
Hilly Terrain Mountain Terrain
(
7.9712.695)
0.35 1 x
y= −e− y=0.38 1
(
−e−14.435x5.434)
Fig. 8. Distribution of probability of failure (landslide ratio) with
respect to landslide susceptibility index in the Kuohsing quadran-gle. Weibull distribution curves are shown: (a) hilly terrain; (b) mountainous terrain.
needed to assign a slightly higher upper bound than the ac-tual value encountered in the event. An EB-LSA model with a credible upper bound for the triggering factor would be of benefit when using this model for prediction, as higher rain-fall intensity may be encountered in some scenarios.
5 Results and evaluation
Data in the Kuohsing quadrangle for shallow landslides trig-gered by typhoon Toraji were used for the EB-LSA. All data sets from the landslide group (5575 pixels in hilly terrain; 11 540 pixels in mountainous terrain) and a randomly se-lected non-landslide data set of similar size were used in the discriminant analysis. Gentle slopes, i.e., a slope gradient of less than 10%, were regarded as stable, and were not included in the discriminant analysis. These areas were also not con-sidered in the evaluation of the results or the calculation of the success rate or prediction rate curves.
The results of the analysis included a coefficient (apparent weight) for each factor for both the hilly and mountainous terrain (Table 7). Among the 9 factors used, the slope gradi-ent factor has the highest coefficigradi-ent and a large percgradi-entage of the weighting. The environmental factor – NDVI, also car-ries a large percentage of the weighting. As compared with the above-mentioned two factors, the rainfall intensity factor is not weighted as highly and needs further discussion.
These various weights were used to calculate the LSI for each grid point, as with Eq. (5) in Lee et al. (2008). LSIs were used to calculate the landslide ratio for each LSI class. The spatial probability of landslide occurrence is indicated
Table 7. Results of coefficients of the discriminant function for each terrain in the Kuohsing quadrangle.
Terrain Litho Slope Slope Asp Topo Rou Slope Rou Total Curv Total Slope NDVI Rain
Hilly 0.095 0.290 0.075 0.131 0.033 0.109 0.016 0.212 0.039
Mountain 0.052 0.246 0.134 0.110 –0.072 0.020 0.026 0.344 0.074
Note: Litho: Lithology. Slope: Slope gradient. Slope Asp: Slope aspect. Topo Rou: Topographic roughness. Slope Rou: Slope roughness. Total Curv: Total curvature. Total Slope: Total slope height. NDVI: Normalized differential vegetation index. Rain: Maximum rainfall intensity.
Fig. 9
Fig. 9. Landslide susceptibility map of the Kuohsing quadrangle
developed using susceptibility model trained with Toraji inventory at the Kuohsing quadrangle. Red indicates high susceptibility, yel-low moderately high, green moderate, cyan yel-low, and gray stable. Landslides triggered by the typhoon Toraji are shown.
by the relation between the probability of failure (landslide ratio) and the LSI (Fig. 8). The probability of failure curves does show a strong trend of increasing probability of land-slide occurrence with increasing susceptibility values. The relation generally follows a Weibull distribution (Lee, 2006; Lee et al., 2008). There are some fluctuations in the landslide ratio when the susceptibility value is higher, simply because there is less data available. The spatial probability of a land-slide can then be used to map the susceptibility classes, as shown in Fig. 9.
0 0.2 0.4 0.6 0.8 1
Portion of Area 0
0.2 0.4 0.6 0.8 1
P
redi
cti
on
R
at
e
Kuoshing AUC=0.9343 Tungshin AUC=0.8171
0 0.2 0.4 0.6 0.8 1
Portion of Area 0
0.2 0.4 0.6 0.8 1
Pr
ed
ic
tion
R
at
e
Kuoshing AUC=0.8859 Tungshin AUC=0.8903
a b
Fig. 10
Hilly Terrain Mountain Terrain
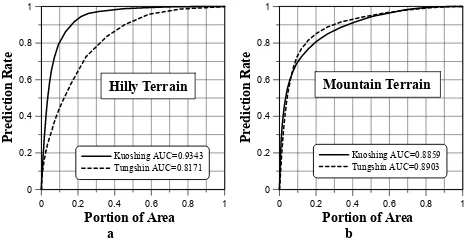
Fig. 10. Success rate curve in the Kuoshing quadrangle and
predic-tion rate curve in the Tungshih quadrangle for the Toraji typhoon event. (a) Hilly terrain, (b) mountainous terrain. AUCs are indi-cated.
5.1 Success rate for the Kuohsing quadrangle
We now compare the distribution of actual landslides trig-gered by typhoon Toraji with the event-based susceptibility map (Fig. 9). This comparison shows that the landslide pat-tern generally agrees with the patpat-tern of the high suscepti-bility classes. We further examine how the results fit the data, using the prediction rate curve method (Chung and Fab-bri, 2003). Landslide data used to establish the model were grouped into several classes according to their LSIs, the num-ber of landslide pixels in each class was divided by the total number of pixels in that class, and a cumulative curve was plotted. Since it is the full set of data from the landslide group used to train the model and calculate the rates, we es-sentially calculate a success rate. The success rate curves for the two terrains are plotted in Fig. 10. The AUC values were also calculated and are shown in Fig. 10.
954 C.-T. Lee et al.: Statistical approach to storm landslides susceptibility
Fig. 11
Fig. 11. Landslide susceptibility map of the Tungshih quadrangle
developed using susceptibility model trained with Toraji inventory in the Kuohsing quadrangle. Landslides triggered by the typhoon Toraji are shown.
5.2 Validation in the Tungshih quadrangle
The same data sources and the same procedure were used to validate the susceptibility model. We processed factors from data from the same sources for the Tungshih quadrangle, and used the factor weights from the Kuohsing quadrangle to cal-culate the LSI for each grid point in the Tungshih quadran-gle. The LSIs were then transferred to indicate probability of failure using the equations shown in Fig. 8. The map of the susceptibility classes for the grid points in this quadrangle is shown in Fig. 11.
The results of the prediction rate calculation are shown in Fig. 10. Again, flat areas, with slopes of less than 10%, were not considered in the calculation of the prediction rate curve; the results are again conservative. The prediction rate for hilly terrain (AUC=0.8171) was less than that for the Kuohs-ing quadrangle, whereas for mountainous terrain, the pre-diction rate for both quadrangles was similar (AUC=0.8859 vs. 0.8903). This is a fairly good result. The lower predic-tion rate for the hilly terrain may be explained as due to the most widespread rock type – the Houyenshan conglomerate, where numerous landslides were triggered by the Chi-Chi earthquake and also reactivated during the typhoon Toraji, not being present in the Tungshih quadrangle.
a b
Fig. 12
Fig. 12. Landslide susceptibility maps developed using
susceptibil-ity model trained with Toraji inventory in the Kuohsing quadrangle, environmental factor – NDVI before typhoon Mindulle, and maxi-mum rainfall intensities of typhoon Mindulle. Landslides triggered by the typhoon Mindulle are shown. (a) Tungshih quadrangle, (b) Kuohsing quadrangle.
0 0.2 0.4 0.6 0.8 1
Portion of Area 0
0.2 0.4 0.6 0.8 1
Pr
edu
ct
ion
R
at
e
Kuoshing AUC=0.8564 Tungshin AUC=0.9128
0 0.2 0.4 0.6 0.8 1
Portion of Area 0
0.2 0.4 0.6 0.8 1
P
redi
cti
on
R
at
e
Kuoshing AUC=0.8322 Tungshin AUC=0.9208
a b
Fig. 13
Hilly Terrain Mountain Terrain
Fig. 13. Prediction rate curve for a subsequent event – the typhoon
Mindulle, in the Kuoshing and Tungshih quadrangles. (a) Hilly terrain, (b) mountainous terrain. AUCs are indicated.
5.3 Validation using data from a subsequent event
Table 8. AUC of success and prediction rates for the Kuohsing and Tungshih quadrangles.
Event Hilly terrain Mountainous terrain
Success rate of TOR at Kuohsing 0.9343 0.8859
Prediction rate of TOR at Tungshih 0.8171 0.8903
Prediction rate of MDL at Kuohsing 0.8564 0.8322
Prediction rate of MDL at Tungshih 0.9128 0.9208
Note: TOR: Toraji typhoon event. MDL: Mindulle typhoon event.
susceptibility classes for the grid points in both quadrangles are shown in Fig. 12. The prediction rate curves are calcu-lated and shown in Fig. 13.
The prediction rate for the subsequent event in the Kuohs-ing quadrangle was less than the success rate by about 8 and 5 percent (in terms of the AUC) for the hilly and mountainous terrains, respectively. For the Tungshih quadrangle, the pre-diction rate for the subsequent event in the hilly terrain was slightly lower than the success rate in the Kuohsing quadran-gle by about 2 percent; however, in the mountainous terrain, it was higher than the success rate by about 5 percent (Ta-ble 8).
In summary, the application of the susceptibility model to a subsequent event, whether in the training site or a neigh-boring site, was good, as shown by the good prediction rate. The performance in the Tungshih quadrangle was especially good, with a prediction rate better than the success rate.
6 Discussion
The present study provides a statistical approach for the in-terpretation of the storm event-induced landslide distribu-tion and for the mapping of regional landslide susceptibil-ity. There are some interesting aspects which need to be dis-cussed.
6.1 Methodology and landslide triggering factors
The present EB-LSA differs from traditional statistical LSAs in two ways. First, instead of a multi-temporal landslide in-ventory, an event-based landslide inventory is used, and sec-ond, the triggering factor is emphasized. It is a very impor-tant to use both an event-based landslide inventory and a trig-gering factor. Without the event-based landslide inventory, the triggering factor is not significant; without the trigger-ing factor, the strigger-ingle-period landslide inventory provides no insight into temporal changes in the landslide distribution.
Of the two key issues in EB-LSA, the selection of a trig-gering factor is more important. To select the best trigger-ing factor, we compared the effectiveness of the total rainfall and the maximum rainfall intensity of a storm event to dis-criminate between the landslide group and the non-landslide group. Based on these results, the maximum rainfall
inten-sity was selected as a discriminator. Hill slopes in the study region are for the most part mantled by permeable collu-vium soils. Shallow landslides on such slopes are often cor-related to short-period rainfall intensity (Aleotti and Chow-dury, 1999). On the other hand, if a slope is mantled by resid-ual soils or clayey soils, it may be the total rainfall that con-trols the soil water level, making this a better discriminator. However, as mentioned in Sect. 5, the percentage of weight-ing for rainfall intensity factor is not as high as expected, when compared to the percentage of weighting for Arias in-tensity factor in the earthquake-induced landslide study (Lee et al., 2008): 0.419 and 0.242 for hilly terrain and for moun-tainous terrain, respectively.
The reason for the relatively low weights for rainfall in-tensity in the present case may be due to the inclusion of many reactivated landslides in the landslide inventory used in training the susceptibility model. Reactivated landslides tend to occur under smaller rainfall than new ones. This reduces the effectiveness of the rainfall intensity factor and lowers the weighting percentage. Recent studies by our team in the catchments area of the Shihmen Reservoir shows a high per-centage of weighting for rainfall intensity factor, apparently due to the fact that the landslides used to build the model are mostly new (i.e., few reactivated landslides). If this is true, it is recommended that reactivated landslides not be consid-ered in the establishment of a landslide susceptibility model in future studies.
When selecting a triggering factor, the dependency be-tween factors must be examined. Generally, inter-factor de-pendencies are common, as can be seen from the correlation coefficients in Table 9. The correlation coefficients between the factors used in this study ranged from –0.119 to 0.542. The triggering factor – maximum rainfall intensity – also had some dependency on other factors, however the correlation coefficients were relatively small (0.024∼0.392) so it could be used as an independent factor.
956 C.-T. Lee et al.: Statistical approach to storm landslides susceptibility
Table 9. Correlation coefficients between susceptibility factors.
Litho Slope Slope Asp Topo Rou Slope Rou Total Curv NDVI Total Slope Rain
Litho 1.000 0.233 –0.006 0.193 0.243 0.182 0.031 0.275 0.382
Slope 0.233 1.000 –0.094 0.542 0.455 0.268 0.095 0.221 0.306
Slope Asp –0.006 –0.094 1.000 –0.009 –0.119 –0.074 –0.066 0.032 0.024
Topo Rou 0.193 0.542 –0.009 1.000 0.481 0.500 0.005 0.186 0.285
Slope Rou 0.243 0.455 –0.119 0.481 1.000 0.511 0.118 0.163 0.295
Total Curv 0.182 0.268 –0.074 0.500 0.511 1.000 –0.023 0.170 0.231
NDVI 0.031 0.095 –0.066 0.005 0.118 –0.023 1.000 0.013 0.056
Total slope 0.275 0.221 0.032 0.186 0.163 0.170 0.013 1.000 0.392
Rain 0.382 0.306 0.024 0.285 0.295 0.231 0.056 0.392 1.000
Note: Name of each factor is same as that in Table 7.
hydraulic conductivity of colluvium soils in Taiwan is about 10−3–10−4m/s, or 101–102m/day (first author personal ex-perience from many engineering projects). It may take about 1 to several days for infiltration from the upper slope to be transmitted to the lower slope to reach a steady-state hydro-logic condition. However, colluvium soils may be loosened by subsurface storms (Whipkey and Kirkby, 1978) so the flow may be much faster. Field measurements of subsurface flow or test data are absolutely needed for verification. Prior to this verification, it may be more practical to include both the rainfall intensity and duration, such as done by Chang et al. (2007), or the maximum 1-hour and maximum rolling 24-h rainfall, in a statistical model.
To use more accurate rainfall distribution in the modeling is also influential. Although the density of rain gauge sta-tions is high, interpolation of rainfall data is still necessary. In this study we used the ordinary Kriging method to interpo-late rainfall data for each grid point. In future studies, multi-variate geostatistical methods and the incorporation of more auxiliary variables, such as surface elevation, slope gradient, slope aspect, and radar data, into the analysis may be consid-ered to improve the quality of the interpolation and minimize the estimation error minimized (Goovaerts, 2000; Diodato and Ceccarelli, 2005; Chang, 2007; Haberlandt, 2007).
Proper data selection is important to the building of a sus-ceptibility model. Dai and Lee (2003) used two event-based landslide inventories (for two different years) to build a sus-ceptibility model. Only one specific event was used in train-ing the susceptibility model in the present study. If a spe-cific storm event gives a wide range of rainfall intensity in the study area, then the model would be good for prediction. Otherwise, it is better to select several storm events in the study area to include a wide range of rainfall intensities. To use more event data and to plan a good data selection scheme may be considered in a further study.
6.2 Use of the susceptibility model for mapping
A landslide susceptibility map can be used for regional plan-ning, site selection, and policy making for hazard mitigation. It should faithfully reflect the relative hill-slope stability and danger zones. The direct product of a landslide susceptibil-ity map from the present EB-LSA allows for interpretation of the landslide distribution after the specific event, but this may be event-dependent. For example, if there is high rainfall in-tensity present at some portion of the map, then that portion would show high susceptibility or high landslide probability. A landslide susceptibility map of this kind does not prop-erly represent the relative slope stability under general rain-fall conditions in the region.
To prepare better landslide susceptibility maps using the EB-LSA model we should replace the event rainfall data by the rainfall data for a particular return period, such as 10, 20, 50 or 100 years so as to produce a more uniform temporal probability map of the region, such as that done by Dai and Lee (2003). The temporal probability of a storm event may be obtained by frequency analysis of the rainfall (Chow et al., 1988). By combining the spatial probability and the tem-poral probability, we could establish a probabilistic landslide hazard model. Lee et al. (2005) proposed some examples of landslide spatial probability for certain return-periods of maximum rainfall intensity.
6.3 Use of the susceptibility model for prediction
When using the EB-LSA model for prediction, the value of the triggering factor is better within the range that the model was trained. This is the case here. The range of maximum rainfall intensity used in training the model is 43–131 mm/hr, the range in the Tungshih quadrangle is 53–102 mm/hr; well within this range. During the typhoon Mindulle event, the range in the Kuohsing quadrangle is 67–138 mm/hr, the range in Tungshih quadrangle is 36–125 mm/hr; either within this range or not exceeding it by much. This is why the diction rates in the validations are good. A range of pre-dicted rainfall intensity similar to that of the trained model is preferable. Extrapolation or over range prediction is not so controlled.
When used for prediction, the inherent past condition (like land-use and soil moisture) must be preserved so that the causative factors used in establishing the model are repre-sentative of the background conditions for prediction. Of the causative factors, NDVI is most sensitive, so it should be de-rived from satellite images made close to the time of predic-tion during a season which has similar weather condipredic-tions as when the model was trained.
In Taiwan, hill slopes are commonly covered by loose and permeable colluvium. Antecedent rainfall and land-use do not affect the soil moisture very much. Land-use does af-fect the amount of interception of rainfall, but the influence is small during a heavy rainstorm. Factors derived from the DEM may also remain unchanged, for shallow landslides do not change the elevation too much (within the accuracy of a DEM). The causative factors should preserve past condi-tions with the NDVI being renewed, for the triggering factor – maximum rainfall intensity to be effective. Therefore, the susceptibility model may be used for prediction.
6.4 Perspectives
Up to now, the proposed EB-LSA has been capable of finding the shallow landslide probability for certain return-periods of storm rainfall, but we still regard this as a susceptibility anal-ysis, because we cannot predict the size or run out distance of a potential landslide (Burton and Bathurst, 1998; Guzzetti et al., 2005; Claessens et al., 2007b). This means that an-other important step is needed to upgrade the EB-LSA for landslide hazard analysis (LHA).
The grid-cell units used in the present study are judged to be valid, and their use is efficient and correct. However, fur-ther study should take the interaction of the nearest neighbors into consideration, to better predict the size of the landslide. Slope units (Carrara et al., 1991; Guzzetti et al., 1999; Xie et al., 2004) are one frequently used susceptibility mapping unit. Parameters derived from a slope unit may reflect the overall characteristics of the slope where a landslide occurs. In the present study, we have used a total-slope-height fac-tor to reflect the longitudinal dimension of a slope unit. If a slope unit is used, then the transverse dimensions of a slope would also be known. A method for slope-unit based
grid-cell analysis for EB-LSA is under active study by our group. In the second-phase of the CGS landslide project, slope-unit based landslide danger zone mapping will be employed.
The frequency of landslide occurrence is often dominated by the triggering agent (Aleotti and Chowdury, 1999). There-fore, EB-LSA models need to be closely linked to hydro-logical frequency analysis for storm-induced landslide pre-diction. Because the density of rain gauge stations is sel-dom ideal, interpolation of rainfall data is always neces-sary. Improvement by incorporating radar data (Chiang and Chang, 2008) and/or using multivariate geostatistical meth-ods (Chang, 2007) is needed.
The present discussion has been limited to shallow land-slides. Other types of landslides, such as rock-falls, deep-seated slides, and debris flows, require different methods (mainly the incorporating of different mapping units and dif-ferent causative factors). The movement of some types of landslide can range from very slow to very rapid, meaning that the danger level will be very different. This feature should be carefully considered in any future LHA.
7 Conclusions and recommendations
A method of event-based landslide susceptibility analysis (EB-LSA) was applied to data from a storm event-induced shallow landslide study in the Kuohsing quadrangle. Results show that our EB-LSA for storm event-induced landslides is effective as confirmed by careful validation on a neighboring region and on a subsequent event. The present methodology and working procedure are feasible for both storm-induced and earthquake-induced landslide studies.
EB-LSA uses an event-based landslide inventory derived from a pre-event and a post-event remotely sensed image, a set of environmental variables and a triggering factor to train the susceptibility model. The combination of an event-based landslide inventory and a triggering factor in the model al-lows for effective interpretation of the event-induced land-slide distribution. Landland-slide susceptibility mapping of this kind is event-dependent; landslide probability at a given point is known only when the triggering factor is given. For actual mapping, it is recommended that the landslide sus-ceptibility of a region be represented by a sussus-ceptibility map using certain return-period rainfall values.
The maximum rainfall intensity (maximum hourly rain-fall) is found to be an effective factor in the interpretation of the event-induced landslide distribution in the present study. However, if hill slopes are mantled by clayey soils, then the story could be different; the rainfall duration or the total fall may control the result. An optimum selection of a rain-fall factor or other factors needs to be determined for a given region.
958 C.-T. Lee et al.: Statistical approach to storm landslides susceptibility long-period landslide inventory. It may be further developed
so that landslide size and run-out distance could be included.
Acknowledgements. This research was supported by the Central
Geological Survey (CGS), Ministry of Economic Affairs, Taiwan,
under the Landslide Research Project. The authors are deeply
appreciative of the care and helpful guidance of Director C. C. Lin of CGS of this project. The authors also wish to express their appreciation to the several reviewers of this project for their enthusiastic advice and valuable suggestions. Special thanks are also due to D. K. Keefer of the US Geological Survey, Menlo Park, for his helpful discussion and critical reading of this manuscript, to L. Claessens, who kindly corrected the wording and gave valuable suggestions, and the anonymous reviewer and Editor Kang-tsung Chang who provided constructive comments.
Edited by: K.-T. Chang
Reviewed by: L. Claessens and another anonymous referee
References
Aleotti, P. and Chowdury, R.: Landslide hazard assessment: sum-mary review and new perspectives, B. Eng. Geol. Environ., 58, 21–44, 1999.
Baum, R. L., Coe, J. A., Godt, J. W., Harp, E. L., Reid, M. E., Savage, W. Z., Schulz, W. H., Brien, D. L., Chleborad, A. F., McKenna, J. P., and Michael, J. A.: Regional landslide-hazard assessment for Seattle, Washington, USA, Landslides, 2, 266– 279, 2005.
Borga, M., Dalla Fontana, G., Gregoretti, C., and Marchi, L.: As-sessment of shallow landsliding by using a physically based model of hillslope stability, Hydrol. Process., 16, 2833–2851, 2002.
Burton, A. and Bathurst, J. C.: Physically based modelling of shal-low landslide sediment yield at a catchment scale, Environ. Ge-ology 35, 89–99, 1998.
Carrara, A.: Multivariate models for landslide hazard evaluation, Math. Geol., 15(3), 403–427, 1983.
Carrara, A., Cardinali, M. Detti, R., Guzzetti, F., Pasqui, V., and Reichenbach, P.: GIS techniques and statistical models in eval-uation landslide hazard, Earth. Surf. Proc. Land., 16, 427–445, 1991.
Carrara, A., Cardinali, M., Guzzetti, F., and Reichenbach, P.: GIS technology in mapping landslide hazard, in: Geographical Infor-mation Systems in Assessing Natural Hazards, edited by: Car-rara, A. and Guzzetti, F., Kluwer Academic Publishers, Dor-drecht, The Netherlands, 135–175, 1995.
Chang, K., Chiang, S. H., and Lei, F.: Analysing the relationship between typhoon-triggered landslides and critical rainfall condi-tions, Earth. Surf. Proc. Land., 33, 1261–1271, 2008.
Chang, T. Y. and Hsu, M. L.: A comparison of spatial distribution of storm-triggered and earthquake-triggered landslides – the case of the Chenyulan drainage basin, Journal of Geographical Science, 35, 1–16, 2004, (in Chinese with English abstract).
Chang, Y. S.: Spatial interpolation of rainfall using multivariate geostatistical approaches, M. S. Thesis of Institute of Applied Geology, National Central University, 187 pp., 2007, (in Chinese with English abstract).
Chiang, S. H. and Chang, K.: Application of radar data
to modeling rainfall-induced landslides, Geomorphology,
doi:10.1016/j.geomorph.2008.06.012, in press, 2008.
Chow, V. T., Maidment, D. R., and Mays, L. W.: Applied hydrology, McGraw-Hill Book Company, 572 pp., 1988.
Chung, C. F. and Fabbri, A. G.: Probabilistic prediction models for landslide hazard mapping, Photogramm. Eng. Rem. S., 65(12), 1389–1399, 1999.
Chung, C. F. and Fabbri, A. G.: Validation of spatial prediction models for landslide hazard mapping, Nat. Hazards, 30, 451– 472, 2003.
Chung, C. F.: Using likelihood ratio functions for modeling the con-ditional probability of occurrence of future landslides for risk as-sessment, Comput. Geosci., 32, 1052–1068, 2006.
Claessens, L., Schoorl, J. M., and Veldkamp, A.: Modelling the lo-cation of shallow landslides and their effects on landscape dy-namics in large watersheds: an application for Northern New Zealand, Geomorphology, 87, 16–27, 2007a.
Claessens, L., Knapen, A., Kitutu, M. G., Poesen, J., and Deckers, J. A.: Modelling landslide hazard, soil redistribution and sediment yield of landslides on the Ugandan footslopes of Mount Elgon, Geomorphology, 90, 23–35, 2007b.
Crosta, G. B. and Frattini, P.: Distributed modeling of shallow land-slides triggered by intense rainfall, Nat. Hazard. Earth. Sys., 3, 81–93, 2003.
Crozer, M. J.: Prediction of rainfall-triggered landslides: a test of the antecedent water status model, Earth Surf. Proc. Land., 24, 825–833, 1999.
Dahal, R. K., Hasegawa, S., Nonomura A., Yamanaka,
M., Dhakal, S., Poudyal, P.: Predictive modelling of
rainfall-induced landslide hazard in the Lesser Himalaya
of Nepal based on weights-of-evidence, Geomorphology,
doi:10.1016/j.geomorph.2008.05.041, in press, 2008.
Dai, C. F. and Lee, C. F.: A Spatiotemporal Probablilistic Modeling of Storm-Induced Shallow Landslide Using Aerail Photographs and Logistic Regression, Earth Surf. Proc. Land., 28, 527–545, 2003.
Davis, J. C.: Statistics and data analysis in geology, 3rd ed. John Wiley and Sons, 638 pp., 2002.
Dietrich, W. E., Wilson, C. J., and Reneau, S. L.: Hollows, col-luvium, and landslides in soil-mantled landscapes, in: Hillslope Processes, edited by: Abrahams, A. D., Allen & Unwin, 361– 388, 1986.
Dietrich, W. E., Reiss R., Hsu, M. L., and Montgomery D. R.: A process-based model for colluvial soil depth and shallow lands-liding using digital elevation data, Hydrol. Process., 9, 383–400, 1995.
Diodato, N. and Ceccarelli, M.: Interpolation processes using mul-tivariate geostatistics for mapping of climatological precipitation mean in the Sannio Mountains (southern Italy), Earth Surf. Proc. Land., 30, 259–268, 2005.
ERDAS, ERDAS Field Guide, 5th Edition. ERDAS, Inc., Atlanta, Georgia, USA, 672 pp., 1997.
Freeze, R. A.: Mathematical models of hillslope hydrology, in: Hillslope hydrology, edited by: Kirkby, M. J., John Wiley & Sons, 177–226, 1978.
Goovaerts, P.: Geostatistics for natural resources evaluation, Oxford University Press, Oxford, 483 pp., 1997.
into the spatial interpolation of rainfall, J. Hydrometeorol., 228, 113–129, 2000.
Guzzetti, F., Carrara, A., Cardinali, M., and Reichenbach, P.: Land-slide hazard evaluation: a review of current techniques and their application in a multi-scale study, Central Italy, Geomorphology, 31, 181–216, 1999.
Guzzetti, F., Peruccacci, S., Rossi, M., and Stark, C. P.: Rainfall thresholds for the initiation of landslides in central and southern Europe, Meteorol. Atmos. Phys., 98, 239–267, 2007.
Guzzetti, F., Reichenbach, P., Cardinali, M., Galli, M., and Ardiz-zone F.: Probabilistic landslide hazard assessment at the basin scale, Geomorphology, 72, 272–299, 2005.
Haberlandt, U.: Geostatistical Interpolation of Hourly Precipitation from Rain Gauge and Radar for a Large-scale Extreme Rainfall Event, J. Hydrometeorol., 332, 144–157, 2007.
Ho, C. S.: An introduction to the geology of Taiwan, explanatory text of the geologic map of Taiwan, Ministry of Economic Af-fairs, Republic of China, 312 pp., 1975.
Hutchinson, J. N.: Landslide hazard assessment, in: Landslides, edited by: Bell, D. H., Balkema, A.A., 1805–1841, 1995. Iverson, R. M.: Landslide triggering by rain infiltration, Water
Re-sour. Res., 36, 1897–1910, 2000.
Jibson, R. W., Harp, E. L., and Michael, J. A.: A method for pro-ducing digital probabilistic seismic landslide hazard maps, Eng. Geol., 58, 271–289, 2000.
Kao, H. and Chen, W. P.: The Chi-Chi earthquake sequence: active out-of-sequence thrust faulting in Taiwan, Science, 288, 2346– 2349, 2000.
Keefer, D. K., Wilson, R. C., Mark, R. K., Brabb, E. E., Brown III, W. M., Ellen, S. D., Harp, E. L., Wieczorek, G. F., Alger, C. S., and Zatkin, R. S.: Real-Time landslide warning during heavy rainfall, Science, 238, 921–925, 1987.
Kirkby, M. J.: Hydrograph modelling strategies, in: Peel, R., Chisholm, M., and Haggett, P.: Process in physical and human geography, Heinemann, London, 69–90, 1975.
Lee, C. T.: Methodology for estimation of earthquake-induced land-slide probability and result evaluation, Geophysical Research Abstract, 8, 05759, 2006.
Lee, C. T., Huang, C. C., Lee, J. F., Pan, K. L., Lin, M. L., Dong, J. J.: Statistical Approach to Earthquake-Induced Landslide Sus-ceptibility, Engineering Geology 100, 43–58, 2008.
Lee, C. T., Pan, K. L., and Lin, M. L.: Research of landslide suscep-tibility analyses, Taiwan Central Geological Survey Open-File Report 94-18, 474 pp., 2005.
Liao, C. W., Lee, C. T. and Liao, H. W.: Statistical analysis of fac-tors affecting landslides triggered by the 1999 Chi-Chi Earth-quake, Taiwan, AGU 2002 fall Meeting Program, p. 258, 2002. Liao, H. W. and Lee, C. T.: Landsides triggered by the Chi-Chi
Earthquake, Proceedings of the 21st Asian Conference on Re-mote Sensing, 1 and 2, 383–388, 2000.
Lin, Y. H.: Application of neural networks to landslide susceptibil-ity analysis, M. S. Thesis of Institute of Applied Geology, Na-tional Central University, p. 81, 2003, (in Chinese with English abstract).
Liu, J. G.: Smoothing filter-based intensity modulation: a spectral preserve image fusion technique for improving spatial details, Int. J. Remote Sens., 21(18), 3461–3472, 2000.
Ma, K. F., Lee, C. T., and Tsai, Y. B.: The Chi-Chi, Taiwan earthquake: large surface displacements on an inland fault, EOS
Transactions, AGU 80, 50, 605–611, 1999.
Malet, J. P., van Asch, T. W. J., van Beek, R., and Maquaire, O.: Forecasting the behaviour of complex landslides with a spatially distributed hydrological model, Nat. Hazard. Earth Sys., 5(1), 71–85, 2005.
Mantovani, F., Soeters, R., and Van Westen, C. J.: Remote sensing techniques for landslide studies and hazard zonation in Europe, Geomorphology, 15, 213–225, 1996.
Montgomery, D. R. and Dietrich, W. E.: A physical-based model for the topographic control on shallow landsliding, Water Resour. Res., 30(4), 1153–1171, 1994.
Montgomery, D. R., Sullivan, K., Greenberg, H. R.: Regional test of a model for shallow landsliding, Hydrological Processes, 12, 943–955, 1998.
Okimura, T. and Ichikawa, R. A.: Prediction method for surface failures by movements of infiltrated water in a surface soil layer, Journal of Natural Disaster Science, 7, 41–51, 1985.
Pan, K. L., Lee, C. T., Wei, C. Y., Lee, J. F., Liao, C. W., Chang, C. W., Lin, Y. H., and Lin, S. Y.: Inventory of Event-Induced Landslides by Using Space Imagery, Proceeding of International Symposium on Landslide and Debris Flow Hazard Assessment, Taipei, 1-1∼1-11, 2004.
Paruelo, J. M., Garbulsky, M. F., Guerschman, J. P., and Jobbagy, E. G.: Two decades of normalized difference vegetation index changes in South America: identifying the imprint of global change. Int. J. Remote Sens., 25(14), 2793–2806, 2004. Polemic, M. and Sdao F.: The role of rainfall in the landslide hazard:
the case of the Avigliano urban area (Southern Apennines, Italy), Eng. Geol., 53, 297–309, 1999.
Salciarini, D., Godt, J. W., Savage, W. Z., Conversini, P., Baum, R. L., and Michael, J. A.: Modeling regional initiation of rainfall-induced shallow landslides in the eastern Umbria Region of cen-tral Italy, Landslides, 3, 181–194, 2006.
Schmidt, J., Turek, G., Clark, M. P., Uddstrom, M. and Dymond, J. R.: Probabilistic forecasting of shallow, rainfall-triggered land-slides using real-time numerical weather predictions, Nat. Haz-ards Earth Syst. Sci., 8, 349–357, 2008,
http://www.nat-hazards-earth-syst-sci.net/8/349/2008/.
Stehman, S.: Selecting and interpreting measures of thematic clas-sification accuracy, Remote Sensing of Environment, 62, 77–89, 1997.
Swets, J. A.: Measuring the Accuracy of Diagonstic Systems, Sci-ence, 204(4857), 1285–1293, 1988.
Terlien, M. T. J.: The determination of statistical and determinis-tic hydrological landslide-triggering thresholds, Environ. Geol., 35(2–3), 124–130, 1998.
van Westen, C. J., van Asch, T. W. J., and Soeters, R.: Landslide hazard and risk zonation – why is it still so difficult?, B. Eng. Geol. Environ., 65, 167–184, 2006.
Varnes, D. J.: Landslide hazard zonation: a review of principles and practice. UNESCO Press, Paris, 63 pp., 1984.
Wang, H., Liu, G., Xu, W., and Wang, G.: GIS-based landslide haz-ard assessment: an overview, Prog. Phys. Geography, 29, 548– 567, 2005.
Weirich, F. and Blesius, L.: Comparison of satellite and air photo based landslide susceptibility maps, Geomorphology, 87(4), 352–364, 2007.
960 C.-T. Lee et al.: Statistical approach to storm landslides susceptibility
121–144, 1978.
Wilkinson, P. L., Anderson, M. G., and Lloyd, D. M.: An integrated hydrological model for rain-induced landslide prediction, Earth Surf. Proc. Land., 27(12), 1285–1297, 2002.
Wilson, J. P. and Gallant, J. C.: Terrain analysis, John Wiley & Sons, Inc., 479 pp., 2000.
Wu, W. and Sidle, R. C.: A distributed slope stability model for steep forested basins, Water Resour. Res., 31, 2097–2110, 1995.
Xie, M., Esaki, T., and Zhou, G.: GIS-based probabilistic map-ping of landslide hazard using a three-dimensional deterministic model, Nat. Hazard., 33, 265–282, 2004.