DOI : https://doi.org/10.32628/IJSRST18401145
Implementation of Image Processing Technique for Diagnosis of
Diseases
Kalyani S. Boral*1, Dr. V. T. Gaikwad2
Department of electronics and telecommunication, Sipna college of engineering and technology, Amravati, Maharashtra, India
ABSTRACT
Recently, image processing techniques are widely used in several medical areas for image improvement in earlier detection and treatment stages of diseases. Medical informatics is the study that combines two medical data sources: biomedical record and imaging data. Medical image data is formed by pixels that correspond to a part of a physical object and produced by imaging modalities. discovery of medical image data methods is a challenge in the sense of getting their insight value, analyzing and diagnosing of a specific disease. Image classification plays an important role in computer-aided-diagnosis of diseases and is a big challenge on image analysis tasks. This challenge related to the usage of methods and techniques in exploiting image processing result, pattern recognition result and classification methods and subsequently validating the image classification result into medical expert knowledge. The main objective of medical images classification is to reach high accuracy to identify the name of disease. It showed the improvement of image classification techniques such as to increase accuracy and sensitivity value and to be feasible employed for computer-aided-diagnosis are a big challenge and an open research.
Keywords: Medical Informatics; Image Classification; Disease Diagnosis
I.
INTRODUCTIONMedical Informatics is the study that intersects Information Technology and healthcare in the implementation of field research, medical informatics combines two medical data sources. They are the biomedical record and imaging data, which have specific characteristic. Digital image data is formed by pixels that correspond to a part of a physical object as a result of imaging modalities. In contrast biomedical record is formed by record from patient medical tests. The difference characteristic between biomedical record and imaging data makes difference methodologies and techniques needed to explore them. Researchers and methods to explore biomedical record have already exploited. Medical image data is produced by imaging modalities. The
issue of this field is how to extract the image and classify the extraction result into the similar pattern then identify and understand which parts of human body are affected by the specific type of disease from image classification result.
There are three stages of Medical Image analysis tasks include for diagnosis
(1) Feature extraction and representation,
(2) Feature selection that will be used for classification, and
(3) Feature and image classification
features of interest part from the image for further analysis. The purpose of the pattern classification system is to map the input variables (such as record data or image data) become the output variables (to represent one specific class (with a disease or with no a disease class) In the future, an automatic diagnosis technique with image data is needed to be developed for better clinical care. Since image classification research is still an open area and big challenge to validate the image classification result into medical expert knowledge, this paper focuses only on detailed review of mining medical image classification technique with the state-of-the-art that addressing this issue. The aim of the review is to give the reader wide-ranging review of mining medical image classification techniques includes their pros and cons. The first step is to denoise the image; by using filter the noise is removed. The next step is to normalize the image by using the segmentation by the thresholding then, removal of the infected area named as a region of interest by the morphological operation of dilation and erosion. The next step is boundary detection, to find the infected part by using the edge detection method. Then the values are calculated by using the neural network and then classify whether the input image is infected or not.
A general description of skin diseases detection system that contains four basic stages. The first stage starts with taking a collection of infected images (normal and abnormal) from the available Database from IMBA Home (VIA-ELCAP Public Access). The second stage applies several techniques of image enhancement, to get best level of quality and clearness. The third stage applies image segmentation algorithms which play an effective rule in image processing stages, and the fourth stage obtains the general features from enhanced segmented image which gives indicators of normality or abnormality of images. In this stage we need to retrieve the valuable information from the images after pre-processing. It is the process of collecting higher-level information
of an image such as shape, texture, colour, and contrast. In fact, texture analysis is an important parameter of human visual observation and machine learning system. It is used effectively to improve the accuracy of diagnosis system by selecting important features. In proposed system three types of features are extracted i.e. texture, intensity and shape with the help of GLCM, LBPH and HOG respectively
Diseases are frequent problem to every person and various types of diseases caused by infections are becoming very frequent. We know that all of these diseases are very harmful, especially if not controlled at an early stage. infections not only damage the skin.
It can have a large effect on a person’s daily life,
destroy confidence of a person, hang their movement, and turn to depression. Sometimes, many people try to treat these allergies by using their own therapy. However, if these methods are not appropriate for that type of disease then it would make it more harmful. diseases can easily transfer from human to human so there is a need to control it their initial stage to prevent it from spreading. This project presents an implementation of a diseases diagnosis system which helps user to detect human diseases and provides medical treatments timely. For this purpose, user will have to upload a disease affected image to our system and give answers to the questions which are asked to user according to the symptoms of the skin. These symptoms are used to identify the disease and provide a medical treatment. This system works on technologies like image processing and data mining for skin diseases detection. So, the whole project is divided in to below major parts,
• Image preprocessing, segmentation and feature extraction.
• Classification model and skin disease predication.
• Medical treatment suggestions or advice.
noise removal and image enhancement. This image is segmented by using a segmentation technique i.e. thresholding segmentation. At last, data mining techniques are used to identify the disease and to provide recommendations to users. Both image based technique and questionnaire technique help to increase reliability and performance of the system.
II.
MOTIVATION1. The need for computer-aided diagnosis in images is becoming progressively more urgent due to the mounting population and the continuing demand for improved excellence medical care.
2. Several million images are read by radiologists each year. The use of computers in radiology can free the radiologist from routine tasks while providing more accurate measurements that may lead to more unswerving diagnosis.
3. In critical situation immediate diagnosis is necessary to patient, in such a situation accurate and less time consuming process is required. This system will help to diagnose accurately.
III.
OBJECTIVE1. The aim of this project is to develop an image processing based efficient system for a quick and accurate classification of diseases based on the information gained from the infected images and symptoms.
2. To provide accurate diagnosis in some critical diseases from images, this system will be preferred over such critical condition.
3. Less time consuming and accurate results are expected in some situation. This project will help to diagnosis of the diseases.
IV.
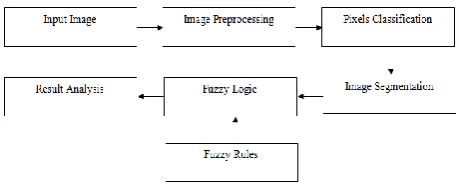
SYSTEM ARCHITECTUREFigure 1: Block Diagram of system
Description:
The infected input images are obtained from the medical that contains normal as well as infected images. In the first step applying pre-processing techniques such as RGB to gray scale conversion. The image enhancement can be obtained by removing noise from the image. Then image classification can be done so as to separate background, ROI (region of interest) and infected pixels. Then infected pixels get marked. Then this images will be compared with the given data base and result is calculated by applying fuzzy logic to it.
The block description can be given as below,
A. Input Image :
In medical imaging, various modalities provide different features of the human body because they use different physical principles of imaging. CT and MRI images with high spatial resolution provide the anatomical details, while PET and SPECT show the biochemical and physiological information but their spatial resolutions are not good enough. Due to development in sensors and camera technology there is increase in different types of digital images from different cameras and sensors with different properties. These digital images are used for different purposes depending on the application where it is applied, for example, we have satellite images such as Panchromatic and multispectral, medical images like CT and MRI. It is not restricted with four types of images alone; there are many images from different sensors. Each image from different sensor has unique property of its own. There are also many methods to improve the property of the images like segmentation, image fusion, and edge detection. There exist many types of x-ray images, such as normal x-ray images, angiograms, x-ray microscopic images, mammography images and fluoroscopic images, etc. Normal x-ray images of the bone are the most commonly used imaging modality for doctors to diagnose and treat bone diseases.
B. Image Pre-processing:
Image pre-processing usually consists of an application-dependent technique for enhancing preselected features or for removing irrelevant detail. Most image processing techniques which have been applied to biomedical situations have been found to be very application dependent. Thus, starting with a large repertoire of techniques, one can converge toward the best technique for a particular application. The pre-processing techniques are designed to enhance selected features and eliminate irrelevant data. The feature extraction techniques are designed
to extract specified, application-dependent information from a image.
In this stage image is enhanced in the way that finer details are improved and noise is removed from the image. Most commonly used enhancement and noise reduction techniques are implemented that can give best possible results. Enhancement will result in more prominent edges and a sharpened image is obtained, noise will be reduced thus reducing the blurring effect from the image. Filtering is done to remove noise from the medical images because medical images are somewhat noisy. In proposed work we will use filter to smoothing and removing noise from the image. In addition to enhancement, image segmentation will also be applied. This improved and enhanced image will help in detecting edges and improving the quality of the overall image. Edge detection will lead to finding the accurate position of tumour.
In image processing, normalization is a process that changes the range of pixel intensity values. Applications include photographs with poor contrast due to glare, for example. Normalization is sometimes called contrast stretching or histogram stretching. In more general fields of data processing, such as digital signal processing, it is referred to as dynamic range expansion. The purpose of dynamic range expansion in the various applications is usually to bring the image, or other type of signal, into a range that is more familiar or normal to the senses, hence the term normalization. Often, the motivation is to achieve consistency in dynamic range for a set of data, signals, or images to avoid mental distraction or fatigue. For example, a newspaper will strive to make all of the images in an issue share a similar range of grayscale.
weight can be based on a Gaussian distribution. Crucially, the weights depend not only on Euclidean distance of pixels, but also on the radiometric differences (e.g., range differences, such as colour intensity, depth distance, etc.).This preserves sharp edges.
C.Pixel Classification :
Classification includes a broad range of decision-theoretic approaches to the identification of images (or parts thereof). All classification algorithms are based on the assumption that the image in question depicts one or more features (e.g., geometric parts in the case of a manufacturing classification system, or spectral regions in the case of remote sensing, as shown in the examples below) and that each of these features belongs to one of several distinct and exclusive classes. The classes may be specified a priori by an analyst (as in supervised classification) or automatically clustered (i.e. as in unsupervised classification) into sets of prototype classes, where the analyst merely specifies the number of desired categories. Classification and segmentation have closely related objectives, as the former is another form of component labelling that can result in segmentation of various features in a scene. Image classification analyzes the numerical properties of various image features and organizes data into categories. Classification algorithms typically employ two phases of processing: training and testing. In the initial training phase, characteristic properties of typical image features are isolated and, based on these, a unique description of each classification category, i.e. training class, is created. In the subsequent testing phase, these feature-space partitions are used to classify image features. The description of training classes is an extremely important component of the classification process. In supervised classification, statistical processes (i.e. based on an a priori knowledge of probability distribution functions) or distribution-free processes can be used to extract class descriptors. Unsupervised
classification relies on clustering algorithms to automatically segment the training data into prototype classes. In either case, the motivating criteria for constructing training classes are:
• Independent, i.e. a change in the description of one training class should not change the value of another,
• Discriminatory, i.e. different image features should have significantly different descriptions, and
• Reliable, all image features within a training group should share the common definitive descriptions of that group.
A convenient way of building a parametric description of this sort is via a feature vector
, where n is the number of attributes which describe each image feature and training class. This representation allows us to consider each image feature as occupying a point, and each training class as occupying a sub-space (i.e. a representative point surrounded by some spread, or deviation), within the n-dimensional classification space. Viewed as such, the classification problem is that of determining to which sub-space class each feature vector belongs. For example, consider an application where we must distinguish two different types of objects (e.g. bolts and sewing needles) based upon a set of two attribute classes (e.g. length along the major axis and head diameter). If we assume that we have a vision system capable of extracting these features from a set of training images, we can plot the result in the 2-D feature, as shown.
D. Image Segmentation:
They all have their pros and cons. Manual segmentation by domain experts is the most accurate but time-consuming. Semi-automatic segmentation requires the user to provide a small amount of inputs to facilitate accurate segmentation. Automatic segmentation does not require any user input and, thus, is much more difficult to obtain accurate results. Nevertheless, in many applications that involve a large number of images, it is the only practically feasible approach. Therefore, the main focus of this research is on automatic segmentation.
Segmentation is the process of dividing the given image into regions homogenous with respect to certain features as colour, intensity etc. It is an essential step in image analysis and locates object & boundaries. K-Means Segmentation-Image segmentation is typically used to locate object and boundaries in image. The result of image segmentation is a set of regions that collectively cover the entire image, or a set of contours extracted from the image. Segmentation is an important process to extract information from complex medical image. Segmentation has wide application in medical field. The main objective of the image segmentation is to partition an image into mutually exclusive and exhausted regions such that each region of interest is spatially contiguous and the pixels within the region are homogeneous with respect to a predefined criterion.
E. Fuzzy logic:
It is based on the mathematical theory of fuzzy sets, which is a simplification of the classical set theory. By introducing the notion of degree in the proof of a form, thus enabling a condition to be in a state other than true or false, it provides a very valuable elasticity for reasoning, which makes it possible to take into account in accuracy and reservations .One advantage of fuzzy logic in order to formalize human reasoning is that the rules are set in normal language. In this detection method fuzzy logic is used for the
conclusion. For the accurate conclusion apply the rules that is fuzzy rules.
F. Result analysis:
The infected image with the disease matches with the given dataset. For the disease detection and classification, we are implementing the deep learning algorithm. Algorithm is used to classify the specified image into appropriate disease hence it will be easy to detect the disease and find out the remedy over the diseases.
V.
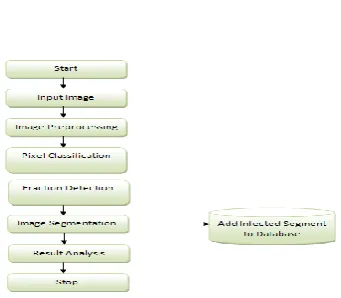
FLOWCHARTFigure 2 : Data Flow Diagram
Take first the Input Image then Pre-process that Image by enhancement the Classify Image Pixels into background, ROI and Infected Pixels. Then Mark infected pixels in image. After that measures dimension of infected region and height and width of input image. Then perform image segmentation so as to separate background, ROI and infected region. Then Add infected region to database with proper naming and last Perform result analysis to get accurate conclusion then stop this process.
VI.
ALGORITHMSA. Enhance Image :
1.Start
2. Input Image I
Extract R, G, B Channels
R = R + E.F *R;
G= G + E.F*G; B = B + E.F*B;
End
End
3.Save Enhance Image I
4. Stop.
B. Image Registration:
1. Start
2. Input ROI Image I
3. For i=1:width(ROI)
For j=1: height (ROI)
If (I (i, j)>=0 &&I (i, j) <100)
J(i,j,1)=255; J(i,j,2)=255; J(i,j,3)=255;
End
End
End
4. Save Registered Image
5. Stop.
C. Algorithm Pattern Matching : 1. Start
2. Load Image Templates T
3. Load Input Image I
4. For i=1:length(T)
Cluster Image I with size of T
For j=1: length (Ct)
Match Ct with T
Calculate percentage match
End
End
5. Display Result
6. Save Result 7. Stop.
VII.
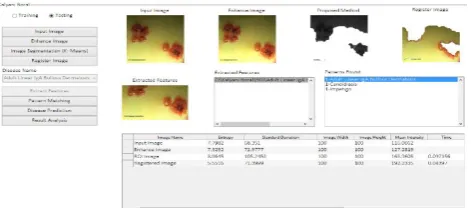
RESULTS AND ANALYSISMain graphical interface :
The graphical user interface consist of two sections such as training section and testing section. training section is the expert section and testing section is for the normal users. This consist of various blocks such as input image, enhance image, image segmentation, register image ,pattern matching ,disease prediction and result analysis and analysis table. The disease prediction section will be display the final result .
In the training section experts save the infected input images and save name of disease. in the testing section first we take the input image then enhance that image then after enhancement segmentation of that image perform by K means segmentation. then it goes to next step that is register image. After the registration of image .next step is pattern matching , in this step we match the input image with the patterns from expert section. After this pattern matching. In this system input images, enhance image, ROI image and register image are read on the basis of Entropy, standard deviation, mean intensity and time .in this also detect the % of infection in image on basis of pixels i.e. by calculating total no. of pixels and infected no of pixels. Then the last step that is the disease prediction. In this we also Compare of images on the basis of RGB graphical formats and its analysis with PSNR value, NC, MSE, AD value, MD, NAE and SC .
disease diagnosis and differential analysis is most
important part that’s show the result.
This computer based diagnosis system show the result which is not the accurate prediction but it is very helpful tool for the doctors and experts .form this system we did not go to final prediction but it helps to conclude and save the time.
Result analysis by taking input :
The input image will be displayed as shown in figure5.3. This input image need to pre-process so as to remove the noise and enhance the features of image. The pre-process image will be appearing as shown in figure 5.3. The region of interest will be found by applying different algorithm to it and then register that image. then the pattern matching step in perform shown in figure 5.4 then ROI are matched with the expert images .if the infected image is not same then it will be added to the database and it matched then it shown the result. The result analysis will be obtained as shown in figure 5.8
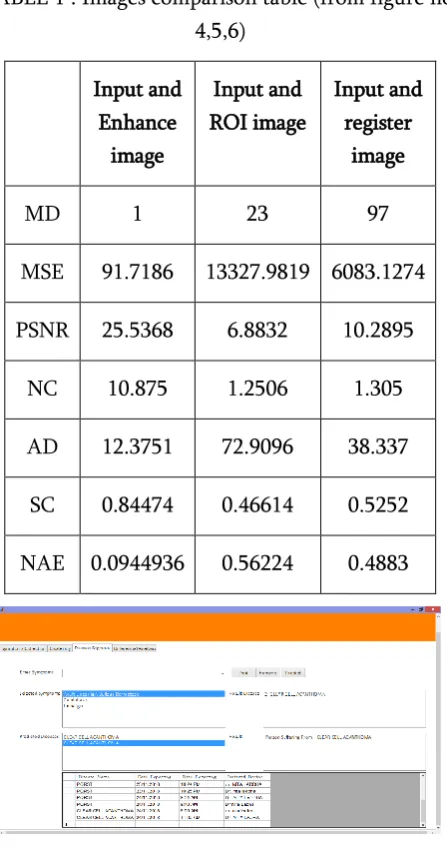
In this system input images, enhance image, ROI image and register image are read on the basis of Entropy, standard deviation, mean intensity and time .in this also detect the % of infection in image on basis of pixels i.e. by calculating total no. of pixels and infected no of pixels. This all values are shown in table 1
Analysis with respect to Peak signal-to-noise ratio ( PSNR value), Normalized Correlation (NC), Mean Square Error (MSE), Average Difference (AD value), Maximum Difference (MD), Normalized Absolute Error (NAE), (SC) and Time Constraint :
Figure 2 : Image pre-processing section
Figure 3 : Pattern matching
• Comparisons of input image with other images on the basis of RGB graphical formats and its analysis with PSNR value, NC, MSE, AD value, MD, NAE and SC are shown below in table 1
Figure 4 : Input with enhance image
Figure 5 : Input with ROI image
TABLE 1 : Images comparison table (from figure no. 4,5,6)
Input and Enhance
image
Input and ROI image
Input and register
image
MD 1 23 97
MSE 91.7186 13327.9819 6083.1274
PSNR 25.5368 6.8832 10.2895
NC 10.875 1.2506 1.305
AD 12.3751 72.9096 38.337
SC 0.84474 0.46614 0.5252
NAE 0.0944936 0.56224 0.4883
Figure 7. Disease prediction section
Table 2 : Image observation table
Figure 8 : Graphical observation between images and its observed values
From above graph we observe that entropy of images are less than the standard deviation and mean intensity, Means the value of mean intensity are maximum. than others. mean intensity of register image is greater than that of other images. standard deviation is maximum in ROI image.
VIII. APLICATIONS
This system can provide quality medical care. The use of this system can free the experts from their routine task. It provides more accurate measurements that may lead to more consistent diagnosis. This system will help to diagnose different diseases which sometime cannot predict by necked eye. This system can become very useful for human being to predict probable infections. The system is also useful for predicting skin diseases. It also can be used to detect skin Cancer. The infected images can process with this system to get the accurate result.
IX. CONCLUSION
the data base for use. Analysis shown that results obtained are not exact but satisfactory .Medical image classification is an interesting research area, it combines the diagnosis problem and analysis purposes in the medical field. This system provided the detailed review of image classification techniques for diagnosis of human body disease include imaging modalities used, each dataset and pros and cons for each technique.
X. REFERENCES
[1] S.I.Chowdhury.: Statistical Expert Systems - A Special Application area for Knowledge-based Computer Methodology. Linkoping Studies in Science and Technology, Thesis No 104.,Department of Computer and Information Science, University of Linkoping, Sweden.
[2] H. Kordylewski and D. Graupe, “Applications
of the LAMSTAR neural network to medical
and engineering diagnosis/fault detection,” in
Proc7th Artificial Neural Networks in Eng. Conf., St. Louis, MO, 1997.
[3] H. Kordylewski, D. Graupe, and K. Liu,
“Medical diagnosis applications of the
LAMSTAR neural network,” in Proc. Biol.
Signal Interpretatio Conf., Chicago, IL, 1999
[4] G.Z. Wu, “The application of data mining for
medical database”, Master Thesis of
Department of Biomedical Engineering, Chung Yuan University, Taiwan, Chung Li, 2000. [5] M. Berlingerio, F. B. F. Giannotti, and F. Turini,
“Mining clinical data with a temporal
dimension: A case study,” in Proc. IEEE Int.
Conf. Bioinf Biomed., Nov. 2–4, 2007, pp. 429–
436.
[6] Kokol P, Povalej, P., Lenič, M, Štiglic, G.:
Building classifier cellular automata. 6th international conference on cellular automata for research and industry, ACRI 2004, Amsterdam, The Netherlands, October 25-27,
2004. (Lecture notes in computer science, 3305). Berlin: Springer, 2004, pp. 823-830.
[7] L. Li, L. Jing, and D. Huang, “Protein-protein
interaction extraction from biomedical literatures based on modified SVM-KNN,” in
Nat. Lang. Process.
[8] A. R. Tunkel, B. J. Hartman, S. L. Kaplan, B. A. Kaufman, K. L. Roos, W. M. Scheld, and R. J.
Whitley, “Practice guidelines for the
management of bacterial meningitis,” Clin.
Infectious Dis., vol. 39, no. 9, pp. 1267– 1284, Nov. 2004.
[9] E. Davies, P. J. McKenzie, Preparing for opening night: temporal boundary objects in textually-mediated professional practice Available at http://InformationR.net/ir/10-1/paper211.html
[10] Star, S. L. & J. Griesemer, Institutional ecology, 'translations' and boundary objects: Amateurs and professionals in Berkeley's museum of vertebrate zoology, Social Studies of Science, 19, 1989, pp. 387- 420.