R E S E A R C H
Open Access
Effect of dietary stable isotopic ratios of carbon
and nitrogen on the extent of their incorporation
into tissues of rats
Wentao Lv, Tingting Ju, Bing Dong, Boyang Yu and Jingdong Yin
*Abstract
This study was conducted to investigate the effect of different dietary ratios of13C to12C or15N to14N on their relative incorporation into tissues. Eighty male rats were used in two 21-day feeding trials in which they were fed diets with either highδ13C levels (δ13C =−13.89%andδ15N = 2.37%in experiment 1 andδ13C =−19.34%and δ15
N = 4.73%in experiment 2) or lowδ13C levels (δ13C =−17.90%andδ15N = 3.08%in experiment 1 and δ13
C =−21.76%andδ15N = 0.53%in experiment 2), meanwhile, the dietaryδ15N levels were designed to two ranks. Blood, liver, adipose and muscle tissues were collected on day 0, 3, 7, 14, and 21 for determination of13C,12C,15N and14N isotopes. Rat growth rate, antioxidant capacity and metabolic parameters were also assessed. The results indicate that adipose tissue tend to deplete13C before the stable isotopic ratios achieved final equilibrium. Therefore, feeds with different isotopic signatures had different incorporation rates into tissues. Low dietary13C levels decreased tissueδ13C values whereas high dietary13C levels did not alter tissueδ13C values during the 21-d experiment. Bloodδ15N values were a reliable parameter in assessing the relative contribution of dietary nitrogen to tissues. This study revealed a relationship between dietary isotopic signatures and their incorporation rates into rat tissues. However, more studies are needed to illustrate the mechanism through which dietary isotopic ratios influence the extent of isotopic incorporation into the tissues.
Keywords:Carbon, Diet, Nitrogen, Stable isotopes
Background
Use of stable isotopes has attracted a great deal of interest in physiological and metabolic research as many researchers are unwilling to use radioactive isotopes [1]. The amount of
carbon stable isotope 13C varies between the C3 and C4
plants due to their use of different photosynthesis pathways
while the abundance of stable nitrogen isotope 15N in
plants resembles that of their growing circumstance [2,3]. Since every feedstuff is characterized by its natural stable isotopic signature [4,5], the analysis of stable isotopes in tissues is proposed as a method to evaluate the relative con-tributions of nutrients from different feed sources to those deposited in tissues [6,7].
Many models have been established to estimate the frac-tional contribution of various isotope profiles in the diet to those deposited in tissues including one compartment, two
compartment, multi-compartment and mixed models [8]. However, the effect of different dietary ratios of13C to12C or15N to 14N on their relative incorporation into tissues remains unknown.
Numerous factors such as diet quality, nutritional status, body size, age, dietary ontogeny, tissue and elemental com-position have been reported to affect the extent of depos-ition of 13C and15N into tissues [9-12]. The relationship between discrimination factors and dietary isotopic ratios is consistent and dietary isotopic values have been shown to explain 51 % of the variation in isotopic discrimination [13] . In controlled experiments, dietary isotopic values explained 60 % to 98 % of the variation in isotopic dis-crimination in different tissues of rats [14]. The stable isotopic analysis, which has been used as an important tool for so many years, is conducted to investigate the turnover and deposition of nutrients from the macro-scopic view. It is aimed at not a certain nutrient but the relationship between various nutrients. However, few * Correspondence:yinjd@cau.edu.cn
State Key Laboratory of Animal Nutrition, China Agricultural University, No.2 West Road Yuanmingyuan, 100193, Beijing, China
studies have determined the effect of different dietary ratios of13C to12C or15N to14N on their relative in-corporation into tissues. If these discrimination factors are not fully understood, it is impossible to estimate the relative contributions of nutrients by using stable iso-topic analysis. Therefore, the present study was carried out to investigate the effect of dietary stable isotopic ratios on their isotopic discrimination in tissues by feeding rats diets providing high or low stable isotopic abundance.
Methods
Experimental design and animal model
Sprague–Dawley rats were used as the animal model to do the research. These trials were conducted according to protocols approved by the China Agricultural University Animal Care and Use Committee. Eighty, healthy male, 35 days old rats were used. Every two rats were housed in one cage. The sawdust was laid at the bottom of the cages and replaced with the new and clean sawdust to keep the cages neat every other day. The rats were reared individu-ally on a 12-hour light 12-hour dark cycle and fed com-mercial feed for a 7 day adaption period before the experiment started. Rats had free access to feed and water.
All rats were treated in accordance with the “Guide for
Care and Use of Agricultural Animals in Research and Teaching”[15].
Two feeding trials were designed to explore the effects of dietary isotope ratios on stable isotopic incorporation into tissues. Prior to the initiation of the experiment (day 0), four rats were slaughtered in order to determine the initial δ13C and δ15N values in the tissue of the experi-mental rats. In the first trial, 38 Sprague–Dawley rats with an average weight of 164.2 ± 2.8 g were randomly divided into two groups (n = 19) and fed one of two diets (Table 1) in which the stable carbon isotopic ratios were designed to be higher than that of the tissues of rats on d 0 (i.e. -19% δ13C value). The rats in group 1, which was the control group, were fed a diet with a low iso-topic ratio (−17.90% δ13C value and 3.08%δ15N value) while the rats in group 2 were fed a diet with a high iso-topic ratio (−13.89%δ13C value and 2.37%δ15N value). In the second trial, 38 male rats with an average weight of 163.8 ± 3.3 g were randomly divided into two groups (n = 19) and fed diets in which the stable carbon isotope ratios were formulated to be lower than that of the tis-sues of rats (i.e. -19%δ13C value) with the exception of adipose tissue. Rats in group 1 were fed a diet in which
the carbon and nitrogen isotopic values were −21.76%
and 0.53%, respectively. Rats in group 2 were fed a diet
with a carbon isotopic value of −19.34% and the
nitro-gen isotopic value of 4.73%(Table 1). The rats were fed the experimental diets for 21 days and rat weight and feed intake were determined weekly to calculate average daily gain and average daily feed intake. Additionally,
plasma parameters were determined to examine the in-fluence of dietary stable isotopic ratio on rat metabolic physiology.
The experimental diets were formulated to be isocaloric (18.7 ± 0.2 MJ/kg) and isonitrogenous (20.78 ± 0.18 % CP) by using different ratios of fish meal, corn, casein, soybean meal and wheat middlings. The stable isotope ratios of these five ingredients were measured prior to the initiation of the study and the proportion of these ingredients in the diets were set in order to obtain the target carbon and nitrogen isotopic ratios. The chemical composition of the experimental diets and their stable carbon and nitrogen isotopic ratios are shown in Table 1.
Table 1 Ingredient and chemical composition of the experimental diets
Trial 1 Trial 2
Treatments 1 2 1 2
δ13
C,% −17.90 −13.89 −21.76 −19.34
δ15
N,% 3.08 2.37 0.53 4.73
Ingredients, %
Fish meal 0.00 0.00 0.00 20.00
Corn 2.35 44.95 30.85 20.45
Casein 11.00 8.80 0.00 0.00
Soybean meal 0.00 20.00 37.80 0.00
Wheat middling 60.00 0.00 5.00 33.00
Sugar 9.00 9.00 9.00 9.00
Soybean oil 7.00 7.00 7.00 7.00
Cellulose acetate 5.00 5.00 5.00 5.00
Mineral premix 3.50 3.50 3.50 3.50
Vitamin premix1 1.00 1.00 1.00 1.00
L-arginine 0.70 0.35 0.00 0.55
L-threonine 0.10 0.00 0.10 0.10
L-methionine 0.03 0.15 0.20 0.03
L-lysine 0.12 0.08 0.30 0.15
Choline 0.25 0.25 0.25 0.25
Nutritional level2
Gross energy, MJ/kg 18.11 18.90 19.19 18.54
Crude protein, % 20.82 20.32 20.78 21.18
Arginine, % 1.80 1.81 1.80 1.83
Histidine, % 0.69 0.69 0.69 0.73
Lysine, % 1.35 1.35 1.39 1.36
Methionine + cysteine, % 0.80 0.82 0.84 0.80
Threonine, % 0.87 0.82 0.87 0.87
Tryptophan, % 0.28 0.25 0.25 0.24
Calcium, % 1.46 1.48 1.48 1.50
Phosphorus, % 1.19 1.11 1.12 1.24
1
Including 0.14 % tertiary butylhydroquinone per kg of vitamin premix.
2
Chemical analysis of feed ingredients
The feed ingredients were determined for gross energy by adiabatic oxygen bomb calorimeter (Parr Instruments, Moline, IL), crude protein through Kjeldahl N [16], calcium (procedure 4.8.03, AOAC, 2000) [17] and phosphorus (pro-cedure 3.4.11, AOAC, 2000) [17]. Amino acid in the feed of experiment 1 and 2 were analyzed according to the proce-dures 4.1.11 of AOAC (2000) [17] and the procedure 998.15 of AOAC (1995) [18].
Sample collection and preparation
In order to collect tissue samples, 50 mg/kg BW of sodium pentobarbital (Beijing Solarbio Science & Technology Company, Beijing, China) was injected into the abdominal cavity of the rats. The abdominal cavity was opened and 5 mL of blood was obtained from the hepatic artery using 9 mL heparinized tubes (Greiner Vacuette, Monroe, NC). The rats were then killed by cervical dislocation. Samples of liver, muscle and adipose tissue were then obtained.
The blood samples were separated into two parts, one part was stored at −80°C for stable isotope analysis, and the other part was centrifuged at 1,200 × g for 15 min to
obtain plasma and was then immediately stored at−20°C
until analysis. The liver sample was collected from the left lobe and rinsed briefly in physiological saline (0.9 %, m/v) to diminish blood contamination of the tissue. The adipose tissue on the bilateral paradidymis was collected from the belly. The gastrocnemius on the left leg was removed for use as a muscle sample. One part of the tis-sues were for the determination of stable isotopes, one was for the analysis of antioxidant and metabolic para-meters, and one was for bulk density measurement.
All samples involving feed ingredients, feed and
tissues were freeze-dried at −40°C for 48 h (Virtis
Genesis-250es; SP Scientific, Stone Ridge, NY). The dried samples were milled into finer particles and then passed through 80 mesh screen. Then, the ap-propriate quantities were removed to tin capsules and compactly packaged to ensure the samples did not leak from the tin capsules. Finally, the tin cap-sules were weighed for analysis.
Stable isotope analysis
Stable isotope values are expressed as the ratio of the heavier element to the lighter element, for
ex-ample, 13C/12C and 15N/14N, which are denoted as
δ13
C or δ15N. The natural stable isotopic abundance
of carbon and nitrogen was measured in feed, blood, liver, muscle and adipose tissue using a continuous-flow isotope ratio mass spectrometer (Delta Plus XP;
Thermo Finnigan, Scientific Instrument Services,
Ringoes, NJ). The isotopic signature is expressed in
the δ-notation in parts per thousand (%) according
to an equation where X is an element, and H and L
are the heavy and light isotopes, respectively. The equation used was as follows:
δXH¼ ðXH=XLÞsample=ðXH=XLÞstandard1
h i
1000
For correction of instrumental drift and determination of the inter-batch variability of analyses, standard materi-als were tested at the beginning, in the middle and at the
end of each run. The standard materials were 13C and
15
N labeled glycine (Cambridge Isotope Laboratories, Andover, MA). The glycine had previously been cali-brated with Pee Dee Belemnite for carbon and
atmos-pheric nitrogen [19]. The δ13C of the glycine was
−33.3%while theδ15N for glycine was 10%. The
preci-sion of each isotopic measurement was 0.02% and the
repeatability of each sample was smaller than 0.2%.
Besides, the discrimination factor for tissues to diet (Δ15Ntissue - diet) used was determined as follows:
Δ
15N
tissuediet
¼
δ
15N
tissueδ
15N
dietBulk density measurement
Tissues were weighed, represented as m (g), and then were immersed into 2 mL of water placed in a 5 mL cylinder. The size of the tissues was determined by the increased volume of the water in the cylinder, repre-sented as V (mL). Bulk density, reprerepre-sented as D (g/mL), was determined as follows:
D¼m=V
Antioxidant capacity and metabolic parameters
Liver samples were immediately homogenized in ice-cold phosphate buffered saline (10 mL/g tissue) with a glass homogenizer and the homogenate was centrifuged for 15 min at 1,200 × g. The supernatant obtained and the plasma were used to assay for total antioxidant capacity (T-AOC), total nitric oxide synthase (TNOS), inducible ni-tric oxide synthase (iNOS), glutathione peroxidase (GSH-Px), superoxide dismutase (SOD), glutamic-pyruvate trans-aminase (GPT), glutamic-oxaloacetic transtrans-aminase (GOT), urea nitrogen, maleic dialdehyde (MDA) and creatinine. All these enzymes activities were determined using commercial kits (Nanjing Jiancheng Bioengineering Institute, Nanjing
City, China) in accordance with the manufacturer’s
instructions.
Statistical analysis
The influence of the dietary treatments on 13C and 15N
time-repeated was also considered. Differences were considered significant whenP<0.05.
Results
Performance and organ weights
There were no significant differences in growth rate and feed intake of rats which received the different stable iso-topic ratio diets in either experiment 1 or 2 (data was not shown). Weights of kidney and heart were not altered by the dietary treatments and neither were the bulk density of liver, kidney and heart (data was not shown).
Antioxidant capacity and critical metabolic parameters
Plasma parameters and hepatic indexes were determined to investigate the influence of different stable isotopic ratios on the antioxidant and metabolic status of the body. In trial 1, the activities of plasma GPT, GOT, T-AOC, SOD, GSH-Px, creatinine, TNOS, iNOS, plasma urea ni-trogen and MDA did not differ between rats fed the two dietary treatments (data was not shown). Similarly, no dif-ferences were observed in the activities of T-AOC, SOD, MDA, iNOS, TNOS, GSH-Px in the liver along with the period of dietary treatment extending. However, in trial 2, the activity of plasma GOT (6.1 IU/L vs. 15.8 IU/L,
P= 0.05) and plasma urea nitrogen (18.3 mmol/L vs.
31.0 mmol/L,P= 0.06) tended to decrease in the rats that
ingested the diet with δ13C of −21.76% and δ15N of
0.53%, whereas plasma MDA tended to increase
(13.3 nmol/mL vs. 10.9 nmol/mL,P= 0.06) compared with
those of rats that ingested δ13C of−19.34%andδ15N of 4.73%.
Stable isotope abundance in tissues
Stable carbon isotopic values showed significant tissue-specificity between adipose tissue and liver, muscle, blood; while each tissue, involving liver, blood, and muscle, had their own nitrogen isotope signature. In particular, both in trial 1 and 2, the adipose tissue13C value was about 3.0% lower than that of the other tissues, while 13C values of the liver, blood and muscle were similar. There were observed relationships among 15N values of the different tissues with liver15N>blood15N>muscle15N.
In trial 1 in which rats were fed with higher 13C diets relative to rat tissues, no difference was observed in the
δ13
C values of the liver, muscle and blood between
treat-ments, whereas adipose tissue δ13C values tended to be
altered by dietary treatment (P= 0.05; Table 2). Lipid
δ13
C values significantly decrease as the period of time the rats exposed to the experimental diet increased (P<0.01). In contrast, δ13C values of liver, muscle and
blood were not altered by dietary δ13C values nor the
length of the time the rat was exposed to the experimental diets (P>0.05). There was no significant
interaction between the dietaryδ13C value and exposure
time on 13C values of the liver, muscle, blood and
adi-pose tissue (P>0.05).
The liverδ15N value was significantly altered by dietary nitrogen isotopic values (P<0.01), but no change was observed in the muscle between dietary treatments (Table 3). Bloodδ15N value tended to be altered by dietary
δ15
N values (P= 0.06). Meanwhile,the lower15N diets rela-tive to the initial tissue δ15N significantly reduced δ15N values of liver and blood along with extending length of time the rats were exposed to the experimental diets (P<0.01). There was no significant interaction between the diet δ15N value and the length of time the rats were exposed to the dietary treatment onδ15N values of liver, muscle and blood (P>0.05).
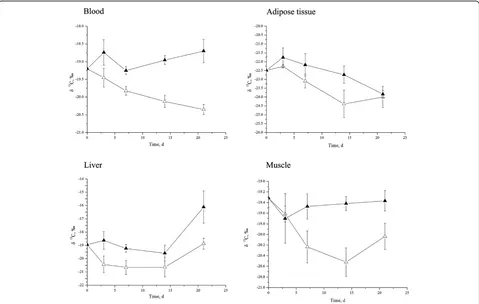
In trial 2, in which rats were fed with equal (as control group) or lowerδ13C value (treatment group) relative to that of the tissues except adipose tissue, it is interesting to find that δ13C values of the liver (P<0.01), muscle (P<0.01) and blood (P<0.01) were significantly
decreased by the diet with δ13C of −21.76% compared
with the other group (Table 4; Figure 1). However, there was no influence of duration of exposure to the treat-ments onδ13C values of the muscle and blood (P>0.05). Dietary of lowδ13C value tended to decrease the adipose tissue δ13C values (P= 0.07) while the length of time the rats were exposed to the treatments significantly reduced
adipose tissue δ13C values (P= 0.01). We could not
understand the shifting of liver δ13C values as it keep constant from d 0 to d14, then increase at d 21, which warrants more meticulously study. There was no inter-action between dietary treatment and the duration of treatment on theδ13C values of the liver, muscle and adi-pose tissue, although the interaction tended to increase in the bloodδ13C value (P= 0.07).
In trial 2, δ15N values of both liver and muscle were significantly changed by the different dietaryδ15N values
(Table 5; Figure 2). Both liver and blood δ15N values
decreased along with the increased duration of exposure to the dietary treatments (P<0.01). The interaction
be-tween dietary δ15N value and the duration of time the
rats were exposed to the dietary treatment significantly influencedδ15N values of the liver (P<0.01) and muscle (P =0.01).
Discussion
In the present study, we investigated whether different dietary stable isotope ratios influenced rat growth rate, critical parameters relating to body antioxidant capacity or metabolism. Our results showed that dietary isotopic signature had no or little effect on rat body antioxidant capacity, metabolism or growth rates.
ingredient source, after accounting for discrimination against heavier isotopes in the digestion and assimilation process [20,21]. Thus, stable isotope analysis is fre-quently used to quantify contributions of different food sources to an animal’s diet and nutrient routing [14,22], which requires a priori estimates of discrimination fac-tors. However, the discrimination factors, particularly, the diet-dependent discrimination factors that influence isotopic incorporation into the tissues remain unknown. It has been emphasized that potential sources of vari-ation for discriminvari-ation factors should not be over-looked, which underpins the isotope model used in studies of ecology and animal nutritional physiology [13]. Many studies have attempted to determine the abun-dance of13C and15N in animal tissues and these studies have shown that stable isotopic signature varies among tissues [9,23-25]. The reasons for tissues differing in
δ13
C andδ15N values were summarized by Martínez del
Rio [8]. For δ13C values, the adipose tissue content and amino acid composition of tissues are two important candidates. It has been proved that adipose tissue
synthe-sis is accompanied by depletion of13C [20]. Meanwhile,
the difference in δ15N value among tissues is due to dif-ferences in their amino acid content and the isotopic composition of individual amino acids. However, effect of different levels of dietary stable isotopic ratios relative to the animal tissues on their incorporation into tissues remains unrevealed.
Prior to the initiation of this experiment, when the rats were fed commercial diets, the ranking of tissue isotopic abundance for13C was liver, muscle and blood>adipose tissue. The same distribution order was maintained when rats ingested different 13C diets for the 21-day experi-ment. These results were somewhat different from some
other reported studies. For example, tissue δ13C values were shown to vary among the tissues with the order of abundance being hair>brain>muscle>liver>adipose tissue in the gerbil [23]. There are limited data on the
tissue 13C turnover of rats, although the half-life of
blood carbon was reported as 24.8 days [26]. We designed the duration of the present trials based on the mouse, using a half-life of liver carbon of 6.4 days [23] and that of muscle of 16.5 days [27]. Since rats have a slower metabolic rate per unit mass than mice [26], the half-life for rat tissue carbon might be longer than that of mice. No difference was observed in the present study
for muscle, liver and blood 13C which might be partly
due to the fact that these tissues had not equilibrated
with dietary 13C during the 21 day experiment. Before
isotopic incorporation achieves equilibrium, the meta-bolic rate that is tissue protein turnover, including
syn-thesis and catabolism, shapes the stable isotopic
composition of the bodies as well as the tissues, although the growth, metabolic rate and nutritional status of the animal providing the tissues would also influence it to certain extent [28].
Regardless of diet, adipose tissue δ13C value was about
3.0% lower than that of other tissues, which was in
accordance with previous studies [29]. It has been sug-gested that adipose tissue depletes 13C faster than other tissues, whereas liver, muscle, blood and hair enrich 13C [8,14,24]. Increases in the mass of tissues through growth have an additional dilution affect which results in faster equilibration to the new diet than would occur by meta-bolic turnover alone [22].
In the current study, the abundance of tissue 15N
values were ranked as liver>blood>muscle. The dis-crimination factor (δ15N tissue - δ15N diet) varied from Table 2 Influence of dietδ13C values (%) onδ13C incorporation into tissues in Trial 1
Tissue Treatments Time, d Pvalue
δ13
C =−17.90% δ13C =−13.89% 0 3 7 14 21 SEM Group Time Group × Time
δ15N = 3.08% δ15N = 2.37%
Liver −19.08a −19.45a −18.95a −19.01a −18.98a −20.02a −19.65a 0.29 0.39 0.35 0.22
Muscle −19.51a −19.45a −19.32a −19.51a −19.74a −19.64a −19.17a 0.14 0.74 0.23 0.83
Blood −19.22a
−19.10a
−19.20a
−19.18a
−19.09a
−19.19a
−19.17a 0.09 0.33 0.93 0.34
Lipid −23.16a
−22.06a
−22.49a
−22.25a
−22.89a
−23.76b
−24.16b 0.22 0.05
<0.01 0.20
a, b, c
Mean values within a row with unlike superscript letters were significantly different (P<0.05).
Table 3 Influence of dietδ15N values (%) onδ15N incorporation into tissues in Trial 1
Tissues Treatments Time, d Pvalue
δ13C =−17.90% δ13C =−13.89% 0 3 7 14 21 SEM Group Time Group × Time δ15
N = 3.08% δ15N = 2.37%
Liver 8.45a 7.76b 9.04a 7.43c 7.72bc 7.83bc 8.40ab 0.19 <0.01 <0.01 0.61
Muscle 5.82a 5.77a 5.85a 5.59a 5.76a 6.30a 5.56a 0.19 0.80 0.30 0.89
Blood 6.90a 5.90a 8.26a 7.94a 7.75a 4.84b 3.93b 0.42 0.06 <0.01 0.52
a, b, c
1.14% to 5.81%, which is similar to previous studies [14,30].
Most animal tissues undergo continual incorporation
of stable isotopes including 13C and 15N, and so the
stable isotope values change over time depending on the diet fed and tissue-specific metabolic rates [31]. In the present study, an interesting phenomenon was observed in that different dietaryδ13C values, compared with that of the tissues, differentially modulated the stable carbon isotope incorporation into tissues. When rats were fed low stable carbon isotopic ratio diets,δ13C values in liver, muscle and blood decreased significantly which is con-sistent with previous research [26]. However, we found
that when rats were fed high isotopic ratio diets, the
δ13
C values of the tissues were not altered during the 21-day experiments. It seems that the tissues tend to
as-similate 12C rather than 13C and remain at a certain
δ13
C value. The finding that adipose tissue δ13C values were unaltered by dietary stable carbon isotope values in the short term might be due to the fact that adipose tis-sue has the highest percentage of carbon element among the tissues analyzed.
Isotopic composition turnover rates vary among tissues, with high rate in tissues such as blood and liver, somewhat lower rates in muscle, and low rates in long-lived tissue such as bone [23]. In the present study, it was surprising Table 4 Influence of dietδ13C values (%) onδ13C incorporation into tissues in Trial 2
Tissues Treatments Time, d Pvalue
δ13
C =−21.76% δ13C =−19.34% 0 3 7 14 21 SEM Group Time Group × Time
δ15N = 0.53% δ15N = 4.73%
Liver −19.78b −18.44a −18.95ab −19.43b −19.87b −20.12b −17.65a 0.32 <0.01 <0.01 0.31
Muscle −19.95b −19.46a −19.32a −19.66ab −19.85ab −19.97a −19.70ab 0.14 <0.01 0.20 0.15
Blood −19.80b
−18.92a
−19.20a
−19.14a
−19.54a
−19.54a
−19.52a 0.11
<0.01 0.15 0.07 Lipid −23.14a
−22.60a
−22.49ab
−22.01a
−22.64ab
−23.45bc
−23.91c 0.28 0.07
<0.01 0.63
a, b, c
Mean values within a row with unlike superscript letters were significantly different (P<0.05).
Figure 1δ13C value change in Sprague
–Dawley rat blood, adipose tissue, liver, and muscle over time.δ13C value change in Sprague
–
to find that the liver δ15N value was rapidly decreased at day 3 and then remained constant over the remaining 21 days of the dietary treatments. However, we cannot ex-plain why the liverδ15N value was decreased at day 3 and then remained theδ15N level. Since liver is a central organ of metabolism in the body, perhaps the liver isotopic
com-position change was balanced by the bodies’metabolism.
Blood δ15N value also decreased significantly at day 3 or 14, and further decreased to day 21. The time divergence existing in the two trials might be due to the protein qual-ity of the diets. Because a 21-day dietary treatment is essentially a short-term study, we did not observe a de-crease in muscleδ15N value during the experiments.
Combining the results of two feed trials, it could be concluded that the liver is the most sensitive organ
reflecting the difference of dietary δ15N values, the
muscle followed second among three tested organs. However, the muscle was resistant to further decrease in
δ15
N once it obtained a new equilibrium ofδ15N values. Bloodδ15N value was similar between dietary treatments but it was decreased along with the increased duration of rat exposure to the dietary treatment, which could be accounted for that the difference ofδ15N between dietary treatments is far smaller than that between the diets and
the initial blood δ15N. In fact, blood δ15N reduced
linearly together with the increased length of rat Table 5 Influence of dietδ15N values (%) onδ15N incorporation into tissues in Trial 2
Tissues Treatment Time, d Pvalue
δ13
C =−21.76% δ13C =−19.34% 0 3 7 14 21 SEM Group Time Group × Time
δ15N = 0.53% δ15N = 4.73%
Liver 6.88b 8.99a 9.04a 7.74b 7.91b 7.85b 7.41b 0.25 <0.01 0.02 <0.01
Muscle 5.24b 6.28a 5.85a 5.55a 5.96a 5.66a 5.81a 0.18 <0.01 0.77 0.01
Blood 5.60a 6.01a 8.26a 5.79b 7.87a 4.98b 3.93c 0.35 0.34
<0.01 0.20
a, b, c
Mean values within a row with unlike superscript letters were significantly different (P<0.05)
Figure 2Nitrogen isotopic value change in Sprague–Dawley rat blood, liver, and muscle over time.Nitrogen isotopic value change in
exposure to the lower δ15N diets, which suggested that blood δ15N values be suitable for assessing the extent of dietary nitrogen contribution to the rat’s tissues. Further-more, the relationship between dietary isotopic ratios and their incorporation rate in tissues warrant more studies. Particularly, in estimating discrimination factors of stable isotopes, the half-life of the stable isotopes in given tissues should be further researched.
Collectively, dietary stable isotopic ratios of carbon or nitrogen may play a vital role in estimating their incorp-oration into the tissues in different animals. Dietary13C incorporation had been shown to be more complex than 15
N. In the short term, before the stable isotopes
achieved equilibrium, the tissues tend to deplete 13C
during the turnover process. Therefore, different levels of dietaryδ13C values have been shown to have different incorporation rates into the tissue. Lower dietary δ13C
values decrease the tissue δ13C values, whereas the
higher dietary δ13C values did not alter the tissue δ13C values as quickly.
Abbreviations
T-AOC: Total antioxidant capacity; TNOS: Total nitric oxide synthase; iNOS: Inducible nitric oxide synthase; GSH-Px: Glutathione peroxidase; SOD: Superoxide dismutase; GPT: Glutamic-pyruvate transaminase; GOT: Glutamic-oxaloacetic transaminase; MDA: Maleic dialdehyde.
Competing interests
The authors declare that they have no competing interests.
Acknowledgements
This study was supported by the Program for New Century Excellent Talents in University (NCET-06-0115).
Authors’contributions
The authors’responsibilities were as follows: JY designed the study; WL, TJ and BY carried out the animal feeding trials, collected and analyzed the samples; BD provided technical expertise; JY and WL performed statistical analysis, WL wrote the manuscript; JY and BD revised the manuscript; Yin obtained funding. All authors have read and approved the final manuscript. And there is no conflict of interest between authors.
Received: 26 March 2012 Accepted: 9 May 2012 Published: 9 May 2012
References
1. Gannes LZ, del Rio CM, Koch P:Natural abundance variations in stable isotopes and their potential uses in animal physiological ecology.Comp Biochem Phys A1998,119:725–737.
2. Kelly S, Heaton K, Hoogewerff J:Tracing the geographical origin of food: The application of multi-element and multi-isotope analysis.Trends Food Sci Tech2005,16:555–567.
3. Ghidini S, Ianieri A, Zanardi E, Conter M, Boschetti T, Iacumin P, Bracchi PG:
Stable isotopes determination in food authentication: A review.Ann Fac Medic Vet Univ Parma2006,XXVI:193–204.
4. Boutton TW, Tyrrell HF, Patterson BW, Varga GA, Klein PD:Carbon kinetics of milk formation in holstein cows in late lactation.J Anim Sci1988,
66:2636–2645.
5. Gannes LZ, O’Brien DM:Martínez del Rio C: Stable isotopes in animal ecology: assumptions, caveats, and a call for more laboratory experiments.Ecology1997,78:1271–1276.
6. Post DM:Using stable isotopes to estimate trophic position: Models, methods, and assumptions.Ecology2002,83:703–718.
7. Bujko J, Schreurs VVAM, Nolles JA, Verreijen AM, Koopmanschap RE, Verstegen MWA:Application of a [13CO
2] breath test to study short-term
amino acid catabolism during the postprandial phase of a meal.Brit J Nutr2007,97:891–897.
8. Martínez del Rio C, Wolf N, Carleton SA, Gannes LZ:Isotopic ecology ten years after a call for more laboratory experiments.Biol Rev2009,84:91–111. 9. Minagawa M, Wada E:Stepwise enrichment of15N along food chains-further
evidence and the relation betweenδ15N and animal age.Geochim
Cosmochim Ac1984,48:1135–1140.
10. Ben-David M, Schell DM:Mixing models in analyses of diet using multiple stable isotopes: a response.Oecologia2001,127:180–184.
11. Vanderklift MA, Ponsard S:Sources of variation in consumer dietδ15N
enrichment: a meta-analysis.Oecologia2003,136:169–182. 12. Robbins CT, Felicetti LA, Sponheimer M:The effect of dietary protein
quality on nitrogen isotope discrimination in mammals and birds.
Oecologia2005,144:534–540.
13. Caut S, Angulo E, Courchamp F:Variation in discrimination factors (δ15N
andδ13C): the effect of diet isotopic values and applications for diet
reconstruction.J Appl Ecol2009,46:443–453.
14. Caut S, Angulo E, Courchamp F:Caution on isotopic model use for analyses of consumer diet.Can J Zool2008,86:438–445.
15. Federation of Animal Science Societies:Guide for the care and use of agricultural animals in research and teaching. 2nd edition. Champaign, IL: 1999.
16. Thiex NJ, Manson H, Anderson S, Persson JA:Determination of crude protein in animal feed, forage, grain, and oilseeds by using block digestion with a copper catalyst and steam distillation into boric acid: Collaborative study.J AOAC Int2002,85:309–317.
17. Association of official analytical chemists [AOAC]:Official methods of analysis. 17th edition. Arlington (VA): Association of Official Analytical Chemists; 2000. 18. Association of official analytical chemists [AOAC]:Official methods of analysis. 16th edition. Arlington (VA): Association of Official Analytical Chemists; 1995. 19. Jim S, Jones V, Ambrose SH, Evershed RP:Quantifying dietary
macronutrient sources of carbon for bone collagen biosynthesis using natural abundance stable carbon isotope analysis.Brit J Nutr2006,
95:1055–1062.
20. Deniro MJ, Epstein S:Mechanism of carbon isotope fractionation associated with lipid-synthesis.Science1977,197:261–263.
21. Deniro MJ, Epstein S:Influence of diet on the distribution of nitrogen isotopes in animals.Geochim Cosmochim Ac1981,45:341–351. 22. Phillips DL, Gregg JW:Source partitioning using stable isotopes: coping
with too many sources.Oecologia2003,136:261–269.
23. Tieszen LL, Boutton TW, Tesdahl KG, Slade NA:Fractionation and turnover of stable carbon isotopes in animal-tissues implications for delta-C-13 analysis of diet.Oecologia1983,57:32–37.
24. De Smet S, Balcaen A, Claeys E, Boeckx P, Van Cleemput O:Stable carbon isotope analysis of different tissues of beef animals in relation to their diet.Rapid Commun Mass Sp2004,18:1227–1232.
25. Reich KJ, Bjorndal KA, del Rio CM:Effects of growth and tissue type on the kinetics of C-13 and N-15 incorporation in a rapidly growing ectotherm.
Oecologia2008,155:651–663.
26. MacAvoy SE, Arneson LS, Bassett E:Correlation of metabolism with tissue carbon and nitrogen turnover rate in small mammals.Oecologia2006,
150:190–201.
27. MacAvoy SE, Macko SA, Arneson LS:Growth versus metabolic tissue replacement in mouse tissues determined by stable carbon and nitrogen isotope analysis.Can J Zool2005,83:631–641.
28. Phillips DL, Eldridge PM:Estimating the timing of diet shifts using stable isotopes.Oecologia2006,147:195–203.
29. Moreno-Rojas JM, Tulli F, Messina M, Tibaldi E, Guillou C:Stable isotope ratio analysis as a tool to discriminate between rainbow trout (O. mykiss) fed diets based on plant or fish-meal proteins.Rapid Commun Mass Sp 2008,22:3706–3710.
30. Arneson LS, MacAvoy SE:Carbon, nitrogen, and sulfur diet-tissue discrimination in mouse tissues.Can J Zool2006,84:989–995. 31. Bauchinger U, McWilliams S:Carbon turnover in tissues of a passerine
bird: allometry, isotopic clocks, and phenotypic flexibility in organ size.
Physiol Biochem Zool2009,82:787–797.
doi:10.1186/2049-1891-3-14