Open Access
Research
Database mining for selection of SNP markers useful in admixture
mapping
Tesfaye M Baye*
1,2, Hemant K Tiwari
2, David B Allison
2,3,4and
Rodney C Go
5Address: 1Current address: Human and Molecular Genetics Center, Medical College of Wisconsin, 8701 Watertown Plank Road, Milwaukee, WI
53226, USA, 2Section on Statistical Genetics, Department of Biostatistics, University of Alabama at Birmingham, Birmingham, AL 35294, USA, 3Clinical Nutrition Research Center, University of Alabama at Birmingham, Birmingham, AL 35294, USA, 4Department of Nutrition Sciences,
University of Alabama at Birmingham, Birmingham, AL 35294, USA and 5Department of Epidemiology, University of Alabama at Birmingham,
Birmingham, AL 35294, USA
Email: Tesfaye M Baye* - [email protected]; Hemant K Tiwari - [email protected]; David B Allison - [email protected]; Rodney C Go - [email protected]
* Corresponding author
Abstract
Background: New technologies make it possible for the first time to genotype hundreds of thousands of SNPs simultaneously. A wealth of genomic information in the form of publicly available databases is underutilized as a potential resource for uncovering functionally relevant markers underlying complex human traits. Given the huge amount of SNP data available from the annotation of human genetic variation, data mining is a reasonable approach to investigating the number of SNPs that are informative for ancestry information.
Methods: The distribution and density of SNPs across the genome of African and European populations were extensively investigated by using the HapMap, Affymetrix, and Illumina SNP databases. We exploited these resources by mining the data available from each of these databases to prioritize potential candidate SNPs useful for admixture mapping in complex human diseases and traits. Over 4 million SNPs were compared between Africans and Europeans on the basis of a pre-specified recommended allele frequency difference (delta) value of ≥ 0.3.
Results: The method identified 15% of HapMap, 11% of Affymetrix, and 14% of Illumina SNP sets as candidate SNPs, termed ancestry informative markers (AIMs). These AIM panels with assigned rs numbers, allele frequencies in each ethnic group, delta value, and map positions are all posted on our website http://www.ssg.uab.edu/downloads/admixture_mapping/SNPAIMs.txt. All marker information in this data set is freely and publicly available without restriction.
Conclusion: The selected SNP sets represent valuable resources for admixture mapping studies. The overlap between selected AIMs by this single measure of marker informativeness in the different platforms is discussed.
Published: 14 February 2009
BioData Mining 2009, 2:1 doi:10.1186/1756-0381-2-1
Received: 24 September 2008 Accepted: 14 February 2009
This article is available from: http://www.biodatamining.org/content/2/1/1
© 2009 Baye et al; licensee BioMed Central Ltd.
Background
The chromosome of an individual from a recently admixed population such as the African-American popu-lation contains large stretches of DNA that resemble mosaics of chromosomal segments [1], each derived from European or African ancestry that have not had sufficient time to break up as a result of recombination. Hence, allelic associations in these populations may extend over distances as large as 20–30 cM [2,3]. Methods to map genes that rely on admixture may therefore require fewer markers to screen the genome than would other approaches for mapping complex disease genes [4,5].
Theoretically, any marker [6-10] that has an allele fre-quency difference between ancestral populations, known as ancestry informative markers (AIMs), can be used for admixture mapping. Such markers can also be used to control for population confounding by variations in back-ground ancestry via structural association testing (SAT) [11]. The ideal AIM has one allele that is monomorphic in one population (p = 1.0) and that is not present in another [12]. However, most alleles are shared among populations [13-15]. Hence, it is important to identify and choose informative AIMs across populations [16].
Several single nucleotide polymorphism (SNP) panels have been reported over the past few years [7,8,16-19] with a focus on identifying markers suitable for admixture studies. Smith et al. [9] screened 744 microsatellite mark-ers for AIMs in 4 different populations and identified a genome spanning set of 315 markers (average spacing 10 cM, frequency difference > 0.3) for mapping in African-Americans and 214 markers (average spacing of 16 cM, frequency difference > 0.25) for mapping in Hispanics. Ninety-seven AIMs were identified for mapping in Afri-can-American populations that show limited variation within Africa [10].
Recently 3011 SNP AIMs were reported for studying Afri-can-American populations [19], who have an average of 80% African and 20% European ancestry, after screening 450,000 SNPs for which allele frequencies were available. This panel is considered the gold standard for admixture mapping in this population. However, the SNPs used to develop these AIMs came mostly from African-American (98.6%, over 443,916 SNPs) populations, and the ances-tral West African frequencies were inferred or estimated by using the expectation-maximization (EM) algorithm [20] rather than by being directly measured.
To date, only a limited amount of information character-izing SNPs across the human genome [21,22] for the majority of ethnic groups is found in the literature [23]. Consequently, mining of SNP frequencies from HapMap and other genomic data sets including Affymetrix 500 K
and Illumina 100 K SNPs with an ethnic-dependent back-ground across the genome is an economical, rapid, and practical strategy for developing a more comprehensive and informative panel of AIMs [19,24]. This may result in a uniform resource that describes nucleotide diversity with sufficient power to infer ancestry for admixed popu-lations [25], beyond the currently available lists of AIMs. The objectives of the present study were to mine databases and develop AIM panels useful in admixture mapping and compare the selected set of AIMs with the widely used AIM panels.
Methods
Materials
SNP markers deposited by the HapMap project, 500 K Affymetrix, 100 K Illumina, and the recently published 3011AIM SNP panels for all autosomal and sex chromo-somes were used to determine AIMs. The distribution of SNPs in each chromosome and database is shown in Table 1.
Data mining, processing, and description
We downloaded the HapMap allele frequency data (http:/ /www.hapmap.org, March 13, 2007 release). The
Hap-Table 1: Number of SNPs investigated for data-mining of AIMs for each chromosome for both Yorubans and European populations listed by genotypic platform or source.
Chr HapMap 500 k Affymetrix 100 k Illumina AIMs
1 286584 39418 9820 241
2 304922 40633 8702 230
3 235256 33120 7207 190
4 224433 31339 6000 132
5 230257 31595 6329 136
6 251838 31130 6579 192
7 196235 25407 5581 124
8 199358 26948 4891 129
9 169079 22596 4480 115
10 197292 28217 5240 144
11 189407 28217 5240 144
12 177798 25998 5928 164
13 146641 24712 5465 129
14 114909 18910 3093 76
15 99603 15432 3420 91
16 101959 14190 3307 87
17 83339 15069 3388 103
18 111158 11127 4079 130
19 51689 14631 2570 83
20 111869 6284 3520 117
21 45994 12266 3007 83
22 51037 7014 1381 59
X 103517 6123 1886 94
Y 54 - -
-Total 3684228 492556 109366 3011
Map project contains genotypes from 60 unrelated indi-viduals (parents) from Yorubans in Ibadan, Nigeria [YRI] and 60 unrelated (parents) Caucasians from the United States with northern and western European ancestry [CEU]. There are ~5.8 million SNPs in the combined phase 1 and phase 2 HapMap projects [26,27].
The Affymetrix 500 K was downloaded from http:// www.affymetrix.com. The Affymetrix 500 K array sets con-tain "quasi-random" or anonymous SNPs that are spread evenly across the genome and are selected on the basis of information content and could lie between genes. These SNPs were developed for genome-wide association and fine mapping studies. The sample sizes used to generate allele frequency datasets of the 500 K SNP array consist of 48 samples containing 13 trios (5 HapMap CEU trios, 5 HapMap Yoruban trios, and 3 other non-HapMap trios) and 9 unrelated HapMap Asian samples. In total, 39 of the 48 samples are parts of the samples used in the HapMap project. About 365,000 or 73% of the Affymetrix 500 K SNPs have also been typed by the HapMap Project.
The Illumina 100 K was downloaded from http:// www.illumina.com. This panel is a gene-centric collection of SNPs (70% of which are located in exons or within 10 kb of transcripts) developed for genome-wide association studies. The sample sizes used to generate the Illumina 100 K allele frequency data were 32 CEU and 28 Yoru-bans. Close to 57,000 of the Illumina 100 K SNPs are in the HapMap project. The recently selected panel of 3011 AIM allele frequencies was obtained from http://
www.cell.com/AJHG/supplemental/S0002-9297(07)64364-X. A total of 66 European Americans and 64 African Americans genotyped by different platforms were used to generate the 3011 AIMs from the total of 450,000 SNPs screened.
Each of these data sets, which differ in the way the SNPs were selected [28], has characteristics that make it useful for the current investigation. The HapMap offers an exten-sive collection of SNPs across ancestral population genomes; the Affymetrix 500 K is a comprehensive widely used chip; the Illumina 100 K has a gene-centric focus; and the AIM panel is the current gold standard SNP panel used in admixture mapping.
Data analysis
A computer program using Python http:// www.python.org was written to export and pre-process the SNP information from the HapMap databases (the codes are available upon request). A SAS [29] program was used to analyze the data. We used 3 criteria to select the markers to be considered in our analysis: (1) the SNP should be shared between the 2 ancestral populations, (2)
a specific marker is retained if it has a delta-value (i.e., the allele frequency difference between 2 parental popula-tions) of 0.3 or higher (a cutoff that has been suggested for AIMs [10], and (3) the physical distance between consec-utive selected SNPs must be at least 0.3 cM to avoid the probability of choosing 2 redundant SNPs that are in strong LD [30,31]. It is expected that markers that are suf-ficiently spaced throughout the genome will offer inde-pendent information about genetic background or ancestry. In each of the 0.3 cM bin, AIMs with the highest delta value were selected to maximize information con-tent of ancestry.
Several methods for measuring marker informativeness for ancestry have been developed and discussed by Rosen-berg et al. [12] and others [19,32]. However, the absolute allele frequency difference (delta) is the most commonly used measure of informativeness for ancestry between 2 parental populations [12]. Marker informativeness for ancestry can be ascertained through the absolute value of the difference in the frequency of a particular allele observed for 2 ancestral populations. If we let p11 repre-sent the frequency of a reference allele in the first parental population and p21 the frequency of the same allele in the second parental population, then the delta value is given by = |p11 - p12|. A marker with a delta value of 1 provides perfect information regarding its ancestry, whereas a marker with a delta value of 0 carries no information for ancestry.
Results
1. SNP allele frequency characterization, racial variation, and databases
Of the total HapMap SNPs for which both Yoruban and CEU allele frequencies were available, we extracted all the monomorphic SNPs and SNPs with various levels of pol-ymorphism, including 100% informative SNPs between the ancestral populations. Table 2 compares the allele fre-quency distributions under each scenario of the different databases and shows that there is a slight increase in the proportion of rare variation in the Affymetrix and Illu-mina groups. From the characterized HapMap, Affyme-trix, and Illumina SNP databases, 17.3%, 2.6%, and 1.3%, respectively, were 100% noninformative for ancestry.
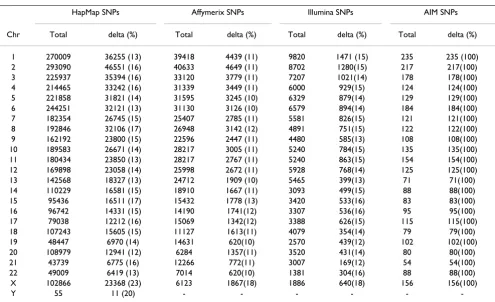
Using a prespecified recommended allele frequency dif-ference (delta) value of ≥ 0.3, on the average across the databases and genome, 15% of HapMap, 19% of Affyme-trix, and 15% of Illumina SNP sets were AIMs (Table 3). However, only 15507 (0.42%) HapMap SNPs had an allele frequency difference of 0.7 and above. Similar to the case with CEU, there were large discrepancies in allele fre-quencies between SNP data for Yoruban populations from the different databases. For example, the reported allele frequencies of the rs55543 SNP from the HapMap, Affymetrix, and Illumina databases were 0.34, 0.31, and
0.42 generated from sample sizes of 120, 48, and 60 sam-ples, respectively. We suspect that the differences in SNP allele frequency data in the different databases were likely due to small sample sizes and respective large sampling errors of the estimates as suggested by Dvornyk et al. [23]. The SNP AIM characteristics with assigned rs numbers, allele frequencies in each ethnic group, delta value, and map positions are all posted on our website http:// www.ssg.uab.edu/downloads/admixture_mapping/ SNPAIMs.txt. All marker information in this data set is freely and publicly available without restriction.
Table 2: Distribution of allele frequency differences (Yoruba vs. European) across SNP marker databases
Allele freq difference HapMap Affymetrix Illumina AIMs
SNPs % SNPs % SNPs % SNPs %
0 635890 17.26 12813 2.60 1392 1.27 -
-0.01–0.29 2477910 67.257 385585 78.28 91992 84.11 -
-0.3–0.50 440866 11.966 73066 14.83 15833 14.62 993 33.83
0.51–0.70 114055 3.096 18910 3.84 1515 51.63
0.71–0.90 14957 0.406 2138 0.44 - - 414 14.11
0.91–0.99 520 0.014 28 0.01 - - 12 0.40
1 30 0.001 - - -
-Chr = chromosome
Table 3: Number of AIMs and percentage with delta ≥ 0.3 (in parentheses) for HapMap, Affymetrix, Illumina and AIM databases.
HapMap SNPs Affymerix SNPs Illumina SNPs AIM SNPs
Chr Total delta (%) Total delta (%) Total delta (%) Total delta (%)
1 270009 36255 (13) 39418 4439 (11) 9820 1471 (15) 235 235 (100) 2 293090 46551 (16) 40633 4649 (11) 8702 1280(15) 217 217(100) 3 225937 35394 (16) 33120 3779 (11) 7207 1021(14) 178 178(100)
4 214465 33242 (16) 31339 3449 (11) 6000 929(15) 124 124(100)
5 221858 31821 (14) 31595 3245 (10) 6329 879(14) 129 129(100)
6 244251 32121 (13) 31130 3126 (10) 6579 894(14) 184 184(100)
7 182354 26745 (15) 25407 2785 (11) 5581 826(15) 121 121(100)
8 192846 32106 (17) 26948 3142 (12) 4891 751(15) 122 122(100)
9 162192 23800 (15) 22596 2447 (11) 4480 585(13) 108 108(100)
10 189583 26671 (14) 28217 3005 (11) 5240 784(15) 135 135(100) 11 180434 23850 (13) 28217 2767 (11) 5240 863(15) 154 154(100) 12 169898 23058 (14) 25998 2672 (11) 5928 768(14) 125 125(100)
13 142568 18327 (13) 24712 1909 (10) 5465 399(13) 71 71(100)
14 110229 16581 (15) 18910 1667 (11) 3093 499(15) 88 88(100)
15 95436 16511 (17) 15432 1778 (13) 3420 533(16) 83 83(100)
16 96742 14331 (15) 14190 1741(12) 3307 536(16) 95 95(100)
17 79038 12212 (16) 15069 1342(12) 3388 626(15) 115 115(100)
18 107243 15605 (15) 11127 1613(11) 4079 354(14) 79 79(100)
19 48447 6970 (14) 14631 620(10) 2570 439(12) 102 102(100)
20 108979 12941 (12) 6284 1357(11) 3520 431(14) 80 80(100)
21 43739 6775 (16) 12266 772(11) 3007 169(12) 54 54(100)
22 49009 6419 (13) 7014 620(10) 1381 304(16) 88 88(100)
X 102866 23368 (23) 6123 1867(18) 1886 640(18) 156 156(100)
Y 55 11 (20) - - -
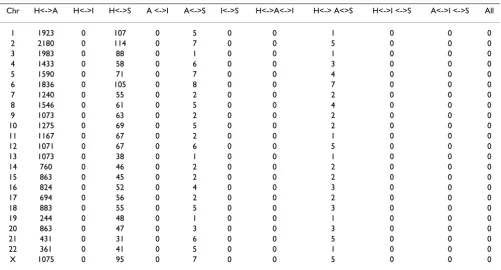
2. Number of overlapping AIMs selected from different platforms
We compared selected AIM lists from among the different databases. Even though 57,000 Illumina 100 K SNPs are in the HapMap dataset, there were no common SNPs selected as AIMs when we used a 0.3 and above delta threshold of informativeness. Interestingly, the recent 3011 AIM panel [19] developed from databases such as Applied Biosystems, Applera, SeatleSNPs, and dbSNP is well represented in HapMap (total of 1479 SNPs were common with HapMap as AIMs). Affymetrix 500 K and HapMap have about 365,000 common SNPs. However, for AIMs with a delta value of ≥ 0.3, there were only 26,388 sets of SNPs overlapping between the 2 databases. As AIMs, few SNPs appeared in both Affymetrix and the recently developed AIM panel; the same was true for Hap-Map, Affymetrix, and the recently developed AIM panel.
However, there was no overlap in the selected AIMs among Affymetrix, Illumina, HapMap, and the recently developed AIM panel (Table 4). This is not surprising because the SNP selection criteria for each platform dif-fered. For example, Affymetrix SNPs are based on proxim-ity to a restriction site and even distribution across the genome, whereas the Illumina platform SNPs are selected in gene-rich regions and thus are not evenly distributed across the genome [28]. Combining nonoverlapping SNPs from different platforms seems a viable approach to increase power and detect signals across the genome.
However, most SNPs are not fixed among ancestral popu-lations and so we cannot rule out the chance that the delta measures of informativeness pick different markers in the different platforms. Moreover, the average sample size (number of individuals) or DNA samples in each of the 2 populations used to estimate allele frequencies and the laboratory procedures used vary between platforms. For instance HapMap data were based on 120 samples, Affymetrix was based on 48 samples, and Illumina used 60 samples. Hence, we believe that the selected SNPs that are present in at least 2 platforms could be considered to be the best candidates for admixture mapping.
3. Private SNP data set
We observed significant differences in allele frequencies of few SNPs in the present study. These SNPs with significant variation in allele frequencies in populations of different ethnicity may be appropriate for studying the genetic basis of between-ethnic differences in the rates of complex dis-eases. Although the small sample sizes in this study pre-clude any definite conclusion regarding the complete absence of a particular allele in any given population, we observed 30 HapMap SNPs (0.001%) that were segregat-ing in only one population sample ("private SNPs"). Most of these private SNPs (77%) were segregating in the Afri-can sample, although private SNPs were also observed for European populations. This may owe to the fact that Afri-can populations harbor more unique polymorphic alleles than non-African populations [35]. Follow-up studies of
Table 4: Number of overlapping SNP AIMs selected by different platforms (HapMap, Affymetrix, Illumina, and AIMs).
Chr H<->A H<->I H<->S A <->I A<->S I<->S H<->A<->I H<-> A<>S H<->I <->S A<->I <->S All
1 1923 0 107 0 5 0 0 1 0 0 0
2 2180 0 114 0 7 0 0 5 0 0 0
3 1983 0 88 0 1 0 0 1 0 0 0
4 1433 0 58 0 6 0 0 3 0 0 0
5 1590 0 71 0 7 0 0 4 0 0 0
6 1836 0 105 0 8 0 0 7 0 0 0
7 1240 0 55 0 2 0 0 2 0 0 0
8 1546 0 61 0 5 0 0 4 0 0 0
9 1073 0 63 0 2 0 0 2 0 0 0
10 1275 0 69 0 5 0 0 2 0 0 0
11 1167 0 67 0 2 0 0 1 0 0 0
12 1071 0 67 0 6 0 0 5 0 0 0
13 1073 0 38 0 1 0 0 1 0 0 0
14 760 0 46 0 2 0 0 2 0 0 0
15 863 0 45 0 2 0 0 2 0 0 0
16 824 0 52 0 4 0 0 3 0 0 0
17 694 0 56 0 2 0 0 2 0 0 0
18 883 0 55 0 5 0 0 3 0 0 0
19 244 0 48 0 1 0 0 1 0 0 0
20 863 0 47 0 3 0 0 3 0 0 0
21 431 0 31 0 6 0 0 5 0 0 0
22 361 0 41 0 5 0 0 1 0 0 0
X 1075 0 95 0 7 0 0 5 0 0 0
the highly differentiated regions might provide significant insight into phenotypic diversity, selection and local adaptation between populations. No private SNPs were observed in the Affymetrix and Illumina data sets.
Discussion
The SNP databases are important resources for performing genetic linkage, association, and admixture studies. Both academic and commercial groups are developing large numbers of genome-wide SNP datasets. These databases now contain over 12.6 million SNPs. However, only a small fraction of these SNPs are well characterized and validated [21]. Users of these data sets have several com-mon questions regarding the existing databases, including the following: What is the frequency spectrum of the SNPs in these databases? What is the distribution picture of these SNPs across different ethnic and geographic popula-tions? What fraction of the total number of SNPs is already captured by these databases?
We mined and compared the HapMap SNP database against Affymetrix 500 K and the gene centric Illumina 100 K SNP chips. This comparison suggests that a rela-tively large fraction (> 80%) of SNPs in these databases do not meet the cutoff for acceptable markers as AIMs [10], which means that they are either of very low frequency or not ancestry informative between the 2 ancestral popula-tions. As a result, we developed and preset the AIM panels for each database individually. Our analyses showed that the SNP databases in their current status might have some limitation for studies of complex disorders, especially in different ethnic groups, as a result of incomplete or une-ven representation of SNPs along the genome [23]. As indicated above, the different databases have different sets of SNPs. Because the SNP allele frequencies were deter-mined by different genotyping labs that used different sample sizes and genotyping methods (see Methods), it would be difficult to perform several tests to assess data quality and identify sources of experimental variation. In critically evaluating our results, it is important to note that our analyses, and hence interpretations, are subject to sev-eral limitations. First, many of our analyses relied on data derived from available databases with contents that are, and will continue to be for some time, in a state of change. Moreover, the allele frequencies across the platforms were based on different sets of DNA samples. Therefore, our results represent a snapshot based on currently available data, and ultimately, when the human genome annota-tion becomes more stable, it will be important to verify these results. Second, the SNP allele frequencies were determined by using relatively small sample sizes (see Methods), and stochastic variation could affect the robustness of our conclusions.
Several studies discussed the similarities between human populations in terms of genetic constituents, and hence a
large sample size may enable the detection of small differ-ences in rare outcomes. Although we observed a strong correlation in allele frequencies between SNPs from dif-ferent platforms (data not shown), confirming these allele frequency estimates in a larger sample size will be impor-tant. The analytical caveats associated with each database, such as how surrogates are Yorubans or CEU to each ancestral population and how much of the data (for example, in HapMap) is transferable to the diverse popu-lations in Africa where there is extreme adaptive variation along the various countries is also debatable.
Most studies consider Europe as a relatively homogeneous population. Consequently, it has been argued that Euro-pean population stratification does not represent a sub-stantial source of bias in epidemiologic studies [36]. However, recent autosomal SNP studies have highlighted significant patterns of structure within Europe along a north-south axis [37] and also the presence of several sig-nificant axes of stratification within Europe, most promi-nently in a northern-southeastern trend, but also along an east-west axis. The study emphasized the importance of considering population stratification in studies using European and European-American individuals, and the need to develop EuroAIMs (European ancestry informa-tive markers) for ancestry estimation and correction [38]. Moreover, the fundamental theorem underpinning Hap-Map is the common disease common variance (CD/CV) hypothesis [39]. How much information we can capture from rare variants is not clear [40].
Conclusion
We presented AIM databases for all SNPs that show prom-ise in distinguishing ancestral populations and thus that will be useful in admixture mapping for finding loci influ-encing complex phenotypes. These databases will also be useful for controlling stratification (or confounding fac-tors) when the variation in admixture levels among indi-viduals causes false-positive associations in genetic association studies. This investment will result in a unique genetic resource of high quality and global importance for genetic studies in admixed populations. Its size and com-plexity will allow systematic research into the genetics of many complex disorders in admixed populations and thus, by serving a wide variety of disciplines, will feed research in this promising area for many years to come.
Competing interests
The authors declare that they have no competing interests.
Authors' contributions
Acknowledgements
This work was supported by the National Institutes of Health grants, R01NS045934, R01MH066181, P30DK056336, R01GM077490, R01DK52431 and R21LM008791. The opinions expressed are those of the authors and not necessarily those of the NIH or any other organization which with the authors are affiliated.
Electronic Database Information
URL for lists of AIM panels extracted from HapMap, Affymetrix, and Illu-mina are given: http://www.ssg.uab.edu/downloads/admixture_mapping/ SNPAIMs.txt
References
1. Reich D, Patterson N: Will admixture mapping work to find dis-ease genes? Philos Trans R Soc Lond B Biol Sci 2005, 360(1460):1605-1607.
2. Stephens JC, Briscoe D, O'Brien SJ: Mapping by admixture link-age disequilibrium in human populations: limits and guide-lines. Am J Hum Genet 1994, 55(4):809-824.
3. McKeigue PM: Mapping genes underlying ethnic differences in disease risk by linkage disequilibrium in recently admixed populations. Am J Hum Genet 1997, 60(1):188-196.
4. Hirschhorn JN, Daly MJ: Genome-wide association studies for common diseases and complex traits. Nat Rev Genet 2005, 6(2):95-108.
5. Smith MW, O'Brien SJ: Mapping by admixture linkage disequi-librium: advances, limitations and guidelines. Nat Rev Genet
2005, 6(8):623-632.
6. Stranger BE, Forrest MS, Dunning M, Ingle CE, Beazley C, Thorne N, Redon R, Bird CP, de Grassi A, Lee C, Tyler-Smith C, Carter N, Scherer SW, Tavare S, Deloukas P, Hurles ME, Dermitzakis ET: Rel-ative impact of nucleotide and copy number variation on gene expression phenotypes. Science 2007, 315(5813):848-853. 7. Shriver MD, Smith MW, Jin L, Marcini A, Akey JM, Deka R, Ferrell RE: Ethnic-affiliation estimation by use of population-specific DNA markers. Am J Hum Genet 1997, 60(4):957-964.
8. Parra EJ, Marcini A, Akey J, Martinson J, Batzer MA, Cooper R, For-rester T, Allison DB, Deka R, Ferrell RE, Shriver MD: Estimating African American admixture proportions by use of popula-tion-specific alleles. Am J Hum Genet 1998, 63(6):1839-1851. 9. Smith MW, Lautenberger JA, Shin HD, Chretien JP, Shrestha S,
Gil-bert DA, O'Brien SJ: Markers for mapping by admixture linkage disequilibrium in African American and Hispanic popula-tions. Am J Hum Genet 2001, 69(5):1080-1094.
10. Collins-Schramm HE, Phillips CM, Operario DJ, Lee JS, Weber JL, Hanson RL, Knowler WC, Cooper R, Li H, Seldin MF: Ethnic-differ-ence markers for use in mapping by admixture linkage dise-quilibrium. Am J Hum Genet 2002, 70(3):737-750.
11. Redden DT, Divers J, Vaughan LK, Tiwari HK, Beasley TM, Fernandez JR, Kimberly RP, Feng R, Padilla MA, Liu N, Miller MB, Allison DB: Regional admixture mapping and structured association testing: conceptual unification and an extensible general lin-ear model. PLoS Genet 2006, 2(8):e137.
12. Rosenberg NA, Li LM, Ward R, Pritchard JK: Informativeness of genetic markers for inference of ancestry. Am J Hum Genet
2003, 73(6):1402-1422.
13. Cavalli-Sforza LL, Menozzi P, Piazza A: The history and geography of human genes'. Princeton University Press, Princeton, NJ; 1994. 14. Deka R, Shriver MD, Yu LM, Ferrell RE, Chakraborty R: Intra- and inter-population diversity at short tandem repeat loci in diverse populations of the world. Electrophoresis 1995, 16(9):1659-1664.
15. Edwards AW: Human genetic diversity: Lewontin's fallacy.
Bioessays 2003, 25(8):798-801.
16. Shriver MD, Parra EJ, Dios S, Bonilla C, Norton H, Jovel C, Pfaff C, Jones C, Massac A, Cameron N, Baron A, Jackson T, Argyropoulos G, Jin L, Hoggart CJ, McKeigue PM, Kittles RA: Skin pigmentation, biogeographical ancestry and admixture mapping. Hum Genet
2003, 112(4):387-399.
17. Bonilla C, Parra EJ, Pfaff CL, Dios S, Marshall JA, Hamman RF, Ferrell RE, Hoggart CL, McKeigue PM, Shriver MD: Admixture in the His-panics of the San Luis Valley, Colorado, and its implications
for complex trait gene mapping. Ann Hum Genet 2004, 68(Pt 2):139-153.
18. Akey JM, Zhang G, Zhang K, Jin L, Shriver MD: Interrogating a high-density SNP map for signatures of natural selection.
Genome Res 2002, 12(12):1805-1814.
19. Smith MW, Patterson N, Lautenberger JA, Truelove AL, McDonald GJ, Waliszewska A, Kessing BD, Malasky MJ, Scafe C, Le E, De Jager PL, Mignault AA, Yi Z, De The G, Essex M, Sankale JL, Moore JH, Poku K, Phair JP, Goedert JJ, Vlahov D, Williams SM, Tishkoff SA, Winkler CA, De La Vega FM, Woodage T, Sninsky JJ, Hafler DA, Altshuler D, Gilbert DA, O'Brien SJ, Reich D: A high-density admixture map for disease gene discovery in african americans. Am J Hum Genet 2004, 74(5):1001-1013.
20. Dempster AP, Laird NM, Rubin DB: Maximum likelihood from incomplete data via the EM algorithm. J R Stat Soc Ser B 1977, 39:1-38.
21. Jiang R, Duan J, Windemuth A, Stephens JC, Judson R, Xu C: Genome-wide evaluation of the public SNP databases. Phar-macogenomics 2003, 4(6):779-789.
22. Miller RD, Phillips MS, Jo I, Donaldson MA, Studebaker JF, Addleman N, Alfisi SV, Ankener WM, Bhatti HA, Callahan CE, Carey BJ, Conley CL, Cyr JM, Derohannessian V, Donaldson RA, Elosua C, Ford SE, Forman AM, Gelfand CA, Grecco NM, Gutendorf SM, Hock CR, Hozza MJ, Hur S, In SM, Jackson DL, Jo SA, Jung SC, Kim S, Kimm K, Kloss EF, Koboldt DC, Kuebler JM, Kuo FS, Lathrop JA, Lee JK, Leis KL, Livingston SA, Lovins EG, Lundy ML, Maggan S, Minton M, Mock-ler MA, Morris DW, Nachtman EP, Oh B, Park C, Park CW, Pavelka N, Perkins AB, Restine SL, Sachidanandam R, Reinhart AJ, Scott KE, Shah GJ, Tate JM, Varde SA, Walters A, White JR, Yoo YK, Lee JE, Boyce-Jacino MT, Kwok PY: High-density single-nucleotide pol-ymorphism maps of the human genome. Genomics 2005, 86(2):117-126.
23. Dvornyk V, Long JR, Xiong DH, Liu PY, Zhao LJ, Shen H, Zhang YY, Liu YJ, Rocha-Sanchez S, Xiao P, Recker RR, Deng HW: Current limitations of SNP data from the public domain for studies of complex disorders: a test for ten candidate genes for obesity and osteoporosis. BMC Genet 2004, 5:4.
24. Kim SK, Borevitz J: Mining the HapMap to dissect complex traits. Genome Biol 2006, 7(3):310.
25. Salas A, Phillips C, Carracedo A: Ancestry vs physical traits: the search for ancestry informative markers (AIMs). Int J Legal Med 2006, 120(3):188-189. author reply 190.
26. Altshuler D, Brooks LD, Chakravarti A, et al.: A haplotype map of the human genome. Nature 2005, 437(7063):1299-1320. 27. Thorisson GA, Smith AV, Krishnan L, Stein LD: The International
HapMap Project Web site. Genome Res 2005, 15(11):1592-1593. 28. Motsinger AA, Ritchie MD, Dobrin SE: Clinical applications of whole-genome association studies: future applications at the bedside. Expert Rev Mol Diagn 2006, 6(4):551-565.
29. SAS I: SAS ver. 9.1.3. Cary, NC: SAS Institute Inc; 2002. 30. Price AL, Patterson N, Yu F, Cox DR, Waliszewska A, McDonald GJ,
Tandon A, Schirmer C, Neubauer J, Bedoya G, Duque C, Villegas A, Bortolini MC, Salzano FM, Gallo C, Mazzotti G, Tello-Ruiz M, Riba L, Aguilar-Salinas CA, Canizales-Quinteros S, Menjivar M, Klitz W, Henderson B, Haiman CA, Winkler C, Tusie-Luna T, Ruiz-Linares A, Reich D: A genomewide admixture map for Latino popula-tions. Am J Hum Genet 2007, 80(6):1024-1036.
31. Myers S, Bottolo L, Freeman C, McVean G, Donnelly P: A fine-scale map of recombination rates and hotspots across the human genome. Science 2005, 310(5746):321-324.
32. McKeigue PM: Mapping genes that underlie ethnic differences in disease risk: methods for detecting linkage in admixed populations, by conditioning on parental admixture. Am J Hum Genet 1998, 63(1):241-251.
33. Rosenberg NA, Pritchard JK, Weber JL, Cann HM, Kidd KK, Zhivot-ovsky LA, Feldman MW: Genetic structure of human popula-tions. Science 2002, 298(5602):2381-2385.
34. Carlson CS, Eberle MA, Rieder MJ, Yi Q, Kruglyak L, Nickerson DA: Selecting a maximally informative set of single-nucleotide polymorphisms for association analyses using linkage dise-quilibrium. Am J Hum Genet 2004, 74(1):106-120.
Publish with BioMed Central and every scientist can read your work free of charge "BioMed Central will be the most significant development for disseminating the results of biomedical researc h in our lifetime."
Sir Paul Nurse, Cancer Research UK
Your research papers will be:
available free of charge to the entire biomedical community
peer reviewed and published immediately upon acceptance
cited in PubMed and archived on PubMed Central
yours — you keep the copyright
Submit your manuscript here:
http://www.biomedcentral.com/info/publishing_adv.asp
BioMedcentral 36. Wacholder S, Rothman N, Caporaso N: Counterpoint: bias from
population stratification is not a major threat to the validity of conclusions from epidemiological studies of common pol-ymorphisms and cancer. Cancer Epidemiol Biomarkers Prev 2002, 11(6):513-520.
37. Seldin MF, Shigeta R, Villoslada P, Selmi C, Tuomilehto J, Silva G, Bel-mont JW, Klareskog L, Gregersen PK: European population sub-structure: clustering of northern and southern populations.
PLoS Genet 2006, 2(9):e143.
38. Bauchet M, McEvoy B, Pearson LN, Quillen EE, Sarkisian T, Hovhan-nesyan K, Deka R, Bradley DG, Shriver MD: Measuring European population stratification with microarray genotype data. Am J Hum Genet 2007, 80(5):948-956.
39. Reich DE, Lander ES: On the allelic spectrum of human disease.
Trends Genet 2001, 17(9):502-510.