Open Access
Software article
Fast Gene Ontology based clustering for microarray experiments
Kristian Ovaska, Marko Laakso and Sampsa Hautaniemi*
Address: Computational Systems Biology Laboratory, Institute of Biomedicine and Genome-Scale Biology Program, Biomedicum Helsinki, University of Helsinki, PO Box 63 (Haartmaninkatu 8), 00014 UNIVERSITY OF HELSINKI, Finland
Email: Kristian Ovaska - [email protected]; Marko Laakso - [email protected]; Sampsa Hautaniemi* - [email protected]
* Corresponding author
Abstract
Background: Analysis of a microarray experiment often results in a list of hundreds of
disease-associated genes. In order to suggest common biological processes and functions for these genes, Gene Ontology annotations with statistical testing are widely used. However, these analyses can produce a very large number of significantly altered biological processes. Thus, it is often challenging to interpret GO results and identify novel testable biological hypotheses.
Results: We present fast software for advanced gene annotation using semantic similarity for
Gene Ontology terms combined with clustering and heat map visualisation. The methodology allows rapid identification of genes sharing the same Gene Ontology cluster.
Conclusion: Our R based semantic similarity open-source package has a speed advantage of over
2000-fold compared to existing implementations. From the resulting hierarchical clustering dendrogram genes sharing a GO term can be identified, and their differences in the gene expression patterns can be seen from the heat map. These methods facilitate advanced annotation of genes resulting from data analysis.
Background
A microarray experiment may result in hundreds of differ-entially expressed genes that are subject to interpretation and further analysis. As analysing these lists gene-by-gene is tedious and error prone, the genes in the lists are rou-tinely annotated using Gene Ontology (GO) with an aim to identify statistically significant biological processes or pathways [1]. However, statistical analysis of GO annota-tions can produce a very large number of significantly enriched or down-regulated biological processes. Thus, it is often challenging to interpret GO results and identify novel testable biological hypotheses.
The GO project provides a species-independent control-led vocabulary for describing gene products (an RNA or
protein product encoded by a gene) in terms of their bio-logical processes, cellular components and molecular functions [1]. The GO annotations are carried out by cura-tors of several bioinformatics databases, so the GO data-base is constantly updated. The ontology defines terms that are linked together to form a directed acyclic graph. Gene products are annotated with a number of ontology terms. Annotation with a given term also implies annota-tion with all ancestors of the term.
In this study we present methodology and software to cluster genes based on their biological functionality using GO annotations. Integral part of the methodology is the ability to rapidly compute pair-wise distances between the gene annotation similarities.
Published: 21 November 2008
BioData Mining 2008, 1:11 doi:10.1186/1756-0381-1-11
Received: 8 April 2008 Accepted: 21 November 2008
This article is available from: http://www.biodatamining.org/content/1/1/11
© 2008 Ovaska et al; licensee BioMed Central Ltd.
Two approaches to gene similarity computation are graph structure -based (GS) and information content -based (IC) measures. GS-based methods use the hierarchical structure of GO in computing gene similarity. IC-based methods additionally consider the a priori probabilities, or information contents, of GO terms in a reference gene set. IC-based measures have been found to perform better than pure graph-based measures [2,3].
Czekanowski-Dice similarity [4] is a GS-based method. Distance of genes G1 and G2 is defined as
where Δ is the symmetric set difference, # is the number of elements in a set and GO(Gi) is the set of GO annotations for gene Gi. Similarity can be defined as 1 - d(G1, G2).
In Kappa statistics [5], each gene is represented as a binary vector (g1,...,gN), where gi is 1 if the gene is annotated with the GO term gi and 0 otherwise. N is the total number of GO terms under consideration.
Similarity of genes G1 and G2 is defined as
where represents observed co-occurrence of GO
terms and represents random co-occurrence.
is the relative frequency of agreeing locations in
the two binary vectors, i.e., locations that are either both 0 or both 1. is the expected relative frequency of
such locations if the binary vectors were random, taking into account the observed probabilities of 0's and 1's.
The following discussion considers IC-based similarity measures. The information content of a GO term is com-puted by the frequency of the term occurring in annota-tions; a rarely used term contains a greater amount of information. Probability for observing a term t is defined
as , where MaxFreq is the maximum
fre-quency of all terms [6]. The information content for a term t is given as IC(t) = -log2p(t). Probabilities can be esti-mated from a corpus of annotations, such as the Gene Ontology database.
Several related similarity metrics are based on the most informative common ancestor (MICA) of two GO terms
and were introduced in the context of GO by Lord et al. [7]. To compute the semantic similarity between terms t1
and t2, we first find the most informative common ances-tor A of t1 and t2, i.e., A is a term that is an ancestor of both
t1 and t2 and has the maximum IC among common ances-tors CommonAnc(t1,t2) of the terms. Now, the Resnik sim-ilarity [8] is defined as
SimResnik(t1, t2) = IC(A).
Several other measures are defined that also take the infor-mation contents of t1 and t2 into account. The Lin measure [9] is defined as
Jiang and Conrath [10] define a semantic distance metric as
dJC(t1, t2) = IC(t1) + IC(t2) - 2IC(A).
The corresponding similarity measure for dJC(t1, t2) [6] is given by
Finally, the Relevance measure [11] that combines Lin's and Resnik's measures is defined as
The MICA-based measures can be modified to take into account so called disjunctive ancestor terms [6]. Two ancestors a1 and a2 of a term t are disjunctive if there are independent paths from a1 to t and from a2 to t. Such ancestors represent distinct interpretations of the term t. In the GraSM enhancement, all common disjunctive ancestors of terms t1 and t2 are considered when comput-ing Sim(t1,t2) [6]. GraSM modifies the computation of
IC(A) and can be applied to the Resnik, Lin and Jiang-Conrath measures.
After computing the pair-wise term similarities, the next step in MICA-based measures is to calculate the similarity between genes G1 and G2. This can be done in several ways and our package supports three most commonly used methods. In the two simplest methods, the maximum or the mean of pair-wise GO term similarities between anno-tation sets of G1 and G2 is used as the similarity value [12]. That is, when G1 is annotated with terms t1,...,tn and G2
with terms , pair-wise term similarities form an n d G G GO G GO G
GO G GO G GO G GO G
( , ) #( ( ) ( ))
#( ( ) ( )) #( ( ) ( ))
1 2 1 2
1 2 1 2
=
∪ + ∩
Δ ,,
K OG G AG G AG G
G G1 2
1 2 1 2
1 1 2
, , , , , = − −
OG G
1, 2
AG G1, 2
OG G
1, 2
AG G1, 2
p t( )= MaxFreqFreq t( )
SimLin t t
IC A IC t IC t
( , ) ( ) ( ) ( ). 1 2 2 1 2 = + (1)
SimJC t t
d JC t t
( , )
( , ) .
1 2
1
1 2 1
=
+
SimRel
t CommonAnc t t
t t p t p t
p t
( , ) max log ( )( ( )) log ( ( , ) 1 2 1 2 2 1 1 = −
∈ )) log ( )
( )( ( )) ( ) ( ) . + = − + p t
IC A p A IC t IC t 2
2 1
1 2
′ ′
× m matrix S. Now, Simgene(G1, G2) is the maximum or the mean of the matrix. In the third method, similarity is defined as Simgene(G1, G2) = max{rowScore, columnScore} [11], where
In addition to MICA- and GraSM-based measures, we have implemented the cosine similarity and SimGIC measures. In cosine similarity [13], each gene G is repre-sented as a vector (w1, w2,...,wN), where each wi is IC(ti) if
G is annotated with the term ti, or 0 otherwise. N is the total number of GO terms under consideration. Similarity
of genes G1 and G2 is defined as , where · is the
dot product and |v| is the vector norm. This is the cosine of the angle between vectors G1 and G2. In the SimGIC (Graph Information Content) measure [3], similarity of genes G1 and G2 is defined as
where GO(Gi) gives the GO annotations of gene Gi. Sim-GIC is a hybrid of GS- and IC-based methods.
Given similarities between the genes we use hierarchical clustering with heat map presentation to visualise both semantic similarities and expression levels of the genes. First, similarity measures are converted to distances using
d(x, y) = 1 - Sim(x, y) when the similarity range is [0, 1] (Czekanowski-Dice, Kappa, Lin, Jiang-Conrath, Rele-vance, Cosine, SimGIC) or using d(x, y) = 1/(Sim(x, y) + 1) when the range is [0, ∞) (Resnik). Second, a hierarchi-cal clustering algorithm is run using the converted dis-tances. The results are visualised as a dendrogram and heat map. The dendrogram is generated using the GO semantic distances and allows identification of clusters containing genes contributing to the same biological process. For each cluster we compute statistical signifi-cance with a permutation test. The heat map illustrates gene expression data obtained from microarray analysis. Thus, the visualisation framework integrates both func-tional gene expression levels to biological processes, which facilitates interpretation of the gene expression analysis results.
Implementation
The semantic similarity package, csbl.go, is available for R [14]. The package computes similarities for arbitrary number of genes and supports the following measures:
Czekanowski-Dice, Kappa, Resnik (with GraSM as an option), Jiang-Conrath (GraSM), Lin (GraSM), Relevance, Cosine and SimGIC. The MICA-based measures (Resnik, Lin, Jiang-Conrath, Relevance and GraSM enhancements) are implemented as a combination of R and C++ code; the four other measures are implemented in R. In addition to the regular R package, csbl.go is available as a component for Anduril [15], a framework for high-throughput data analysis we recently developed. The package is extensively tested and includes a user guide.
Similarity computation needs GO term probabilities for the reference gene set. We provide precomputed probabil-ity tables for Homo sapiens, Saccharomyces cerevisiae,
Caenorhabditis elegans, Drosophila melanogaster, Mus muscu-lus and Rattus norvegicus. The tables are computed based on all gene and protein annotations for the given organ-ism found in the geneontology.org database. As GO is constantly updated and revised, we update the tables every six months. The package also has an option to use custom tables. The taxonomy ID of the organism is stored along with probability tables as metadata, which enables selection of a table by organism ID. The package also includes an option to compute GO term enrichment using Fisher's Exact Test [16].
Results and discussion
We evaluated the package by using a performance bench-mark and by applying the methods to microarray data from a testicular germ cell tumor study [17].
Performance benchmark
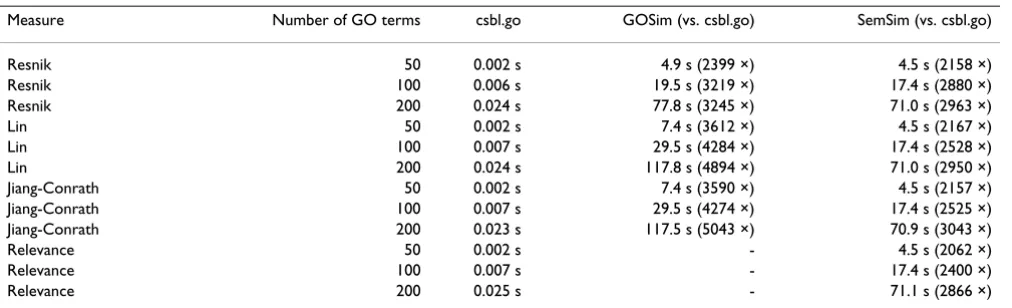
We compared the performance of our package to two ear-lier introduced semantic similarity packages, SemSim 1.6.0 [18] and GOSim 1.1.5.1 [12]. The benchmark com-putes semantic similarities for GO term set sizes 50, 100 and 200. For csbl.go and SemSim, the measures Resnik, Jiang-Conrath, Lin and Relevance are used in the bench-mark. GOSim does not support the Relevance measure so only the three other measures are used for it. The GraSM enhancement was not used in the benchmark as SemSim does not support GraSM.
The benchmark computes a symmetric n × n similarity matrix for the GO term sets. The three packages handle matrix computation in different ways. GOSim and csbl.go take a single term list and compute the symmetric matrix by computing half of of the pair-wise similarities (n2/2) and mirroring the matrix by the diagonal. SemSim takes two potentially different term lists and computes all n2 pair-wise similarities. To compare the packages, we halved the execution times of SemSim in order to consider a situ-ation where all packages perform n2/2 operations. The benchmark computes GO term similarities instead of rowScore
n j m ij columnScore m
i n
i n ij j = = ≤ ≤ = = ≤ ≤
∑
1 1 11 11
maxS and maxS
m m
∑
. G G G G 1 2 1 2 ⋅ | || | Σ Σt GO G GO G IC t t GO G GO G IC t
gene similarities because the former is the most time-con-suming part of similarity computation.
Benchmark results are in shown in Table 1. With the csbl.go package we obtained 2400- to 5000-fold (GOSim) and 2100- to 3000-fold (SemSim) speed gains. The speed gain achieved by csbl.go becomes more obvious with larger number of GO terms. For example, with 1000 terms SemSim and GOSim take more than 30 minutes while csbl.go takes less than one second.
Case study
As a case study, we applied similarity measures to identify common GO classes for differentially expressed genes involved in testicular germ cell tumors (TGCTs). The TGCT microarray study here consists of five undifferenti-ated embryonal carcinoma samples and 12 differentiundifferenti-ated testicular cell samples, which include both tumors and healthy samples [17].
We re-analysed the data set with the goal of finding differ-entially expressed genes (DEGs) between four undifferen-tiated samples (EC_0502, EC_0564, EC_1017 and EC_1740) and 10 differentiated samples (Cc_0915, N_9013, N_9014, N_0140, Ter_0691, Ter_0696, YST_0216, YST_0307, YST_0738, YST_2110). Three sam-ples (EC_1838, Ter_1282 and Ter_2201) were excluded due to data quality problems. Data from the two-channel Agilent Human 1A were background corrected and proc-essed with LOWESS [19]. DEGs were selected using t-test followed by false discovery rate correction [20]. We obtained 65 genes that have q-value below 0.1 and have also fold change of at least 1.5. We found GO annotations for 58 of the 65 genes using Ensembl version 50 [21]. Among the 58 genes, the median number of GO annota-tions per gene is eight.
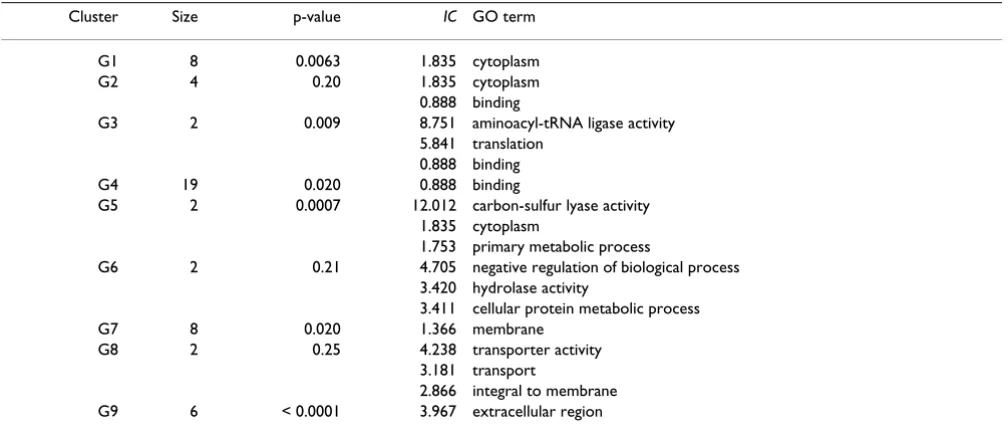
We computed the similarities between the 58 DEGs using the Lin measure and converted the similarity matrix into distance using d(x, y) = 1 - Sim(x, y). Then we used agglomerative hierarchical clustering in R to generate gene clusters based on the GO distance matrix. The heat map that combines GO clusters and expression data is shown in Figure 1. GO-based clustering for the genes is visualised with a dendrogram on the left. To visualise the relation-ships between samples, a second dendrogram based on expression profiles is shown on the top. Using a dendro-gram cutoff value of 0.35 we obtained nine clusters that are numbered G1,...,G9. The gene names for these nine clusters are given in Table 2 in the same order as Figure 1. To gain further insight into the clusters, we extracted the most informative GO terms for each cluster. These are terms that occur in every gene of the cluster (taking par-ent-child relationships into account) and have the largest information contents. The most informative terms for each cluster and their IC values are listed in Table 3. To assess the significance of the IC values, we computed p-values using a permutation test [16]. To obtain the p-value for a cluster with the size k, we generated 10000 random clusters with size k and computed IC of the most inform-ative term in each cluster. The p-value is then the fraction of clusters having IC at least as great as the cluster under study.
The cluster G5 consists of two genes: cystathionase (CTH) and glyoxalase I (GLO1). These two genes correlate strongly in their GO terms as their extremely high IC-value of 12.0 indicates. Also their gene expression patterns are almost identical across the samples as shown in the heat map in Figure 1. GLO1 is a glutathione-binding pro-tein that contributes to several pathways that are associ-ated with various diseases, such as cancers [22]. As glutathione plays a key role in the process where tumor cells acquire resistance to anti-cancer drugs, GLO1 inhibi-tors are considered as potential anti-cancer agents [22,23].
Table 1: Benchmark results.
Measure Number of GO terms csbl.go GOSim (vs. csbl.go) SemSim (vs. csbl.go)
Resnik 50 0.002 s 4.9 s (2399 ×) 4.5 s (2158 ×)
Resnik 100 0.006 s 19.5 s (3219 ×) 17.4 s (2880 ×)
Resnik 200 0.024 s 77.8 s (3245 ×) 71.0 s (2963 ×)
Lin 50 0.002 s 7.4 s (3612 ×) 4.5 s (2167 ×)
Lin 100 0.007 s 29.5 s (4284 ×) 17.4 s (2528 ×)
Lin 200 0.024 s 117.8 s (4894 ×) 71.0 s (2950 ×)
Jiang-Conrath 50 0.002 s 7.4 s (3590 ×) 4.5 s (2157 ×)
Jiang-Conrath 100 0.007 s 29.5 s (4274 ×) 17.4 s (2525 ×)
Jiang-Conrath 200 0.023 s 117.5 s (5043 ×) 70.9 s (3043 ×)
Relevance 50 0.002 s - 4.5 s (2062 ×)
Relevance 100 0.007 s - 17.4 s (2400 ×)
Relevance 200 0.025 s - 71.1 s (2866 ×)
CTH is a critical factor in glutathione synthesis and has recently been associated with increased risk of bladder cancer [24]. While detailed discussion of the exact roles of CTH and GLO1 in embryonal carcinomas is out of scope
of this study, our results suggest that GLO1 and CTH may function in concert, and contribute to tumor progression and drug resistance in embryonic cancers.
GO heat map and clustering
Figure 1
GO heat map and clustering. GO based clustering dendrogram of the selected genes (vertical axis) is visualised along with
the expression patterns that are used to cluster the samples (horizontal axis). There are nine GO-based clusters named G1,...,G9 that contain more than one gene. The GO clusters are separated by a horizontal bar in the heat map. Genes without annotations are omitted from the heat map. Overexpressed genes are shown with white or yellow color and underexpressed genes with red color.
low high
Ter_0691
Ter_0696
YST_2110
YST_0738
YST_0307
YST_0216
N_9013
N_9014
N_0140
Cc_0915
EC_0502
EC_0564
EC_1740
EC_1017
G1 G2 G3 G4 G5 − − G6 G7 G8 − G9 − −
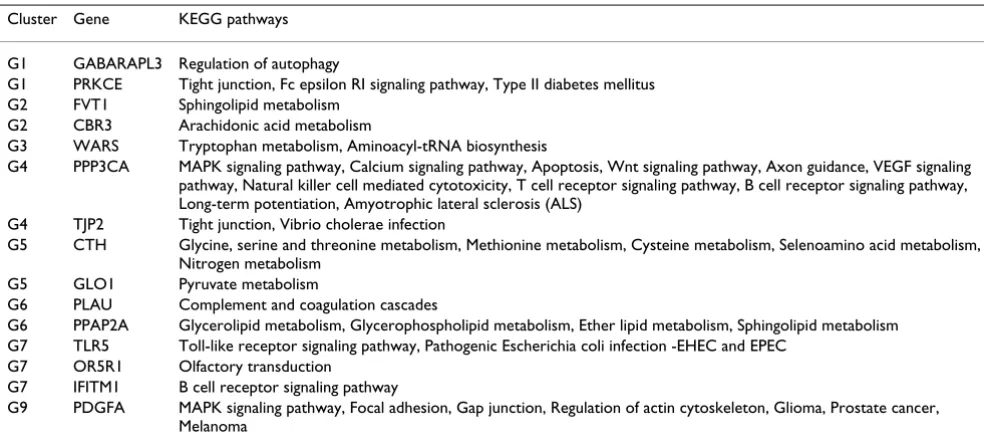
Interestingly, CTH and GLO1 contribute to the same bio-logical process but do not have common pathways in the KEGG pathway database [25] as shown in Table 4 that contains all KEGG pathways associated to genes in Table 2. Thus, CTH and GLO1 would not have been grouped together with standard pathway analyses despite the fact that, based on literature, their biological function is mark-edly similar.
Conclusion
We have developed tools to cluster genes from microarray experiments using semantic similarity measures. Using benchmark tests we demonstrated clear speed gain as compared to existing implementations. Our efficient implementation of similarity measures enables analysis of
gene sets with hundreds of genes that are typically seen in microarray experiments. We then combined expression data and GO annotations using hierarchical clustering and a heat map visualisation that together enable rapid identification of genes sharing similar biological func-tions. In our case study we further analysed genes that are differentially expressed in testicular germ cell tumors between undifferentiated embryonal carcinomas and dif-ferentiated testicular cells. Our results suggest that GO-based annotation analysis approaches may be able to take advantage of the accumulated knowledge available in lit-erature over approaches using pathway databases, which are typically updated in a much slower pace than the GO database. In summary, the csbl.go package allows rapid
Table 2: Genes corresponding to the most statistically significant clusters found in the case study.
Cluster Genes
G1 PDCL3 MAGED1 (two probe sets) PRKCE PRDX1 CLIC4 MRPS23 GABARAPL3
G2 CBR3 RANBP17 NBEA FVT1
G3 LRRC47 WARS
G4 NANOGP8 ZNF215 POU5F1 MYBL2 L1TD1 CITED2 TCEA2 SMARCAD1 MKI67IP CPSF4 PPFIBP2 WDSUB1 PPP3CA ISG20L1 TIPARP CEP290 DPPA4 TJP2 NLRP7
G5 CTH GLO1
G6 PLAU PPAP2A
G7 TLR5 OR5R1 TMEM106C IFITM1 PCDHB5 PCDHB11 AC069513.28 PLK3
G8 SLC22A17 FLVCR1
G9 PDGFA IGSF21 GDF3 CCDC80 GAL TF
MAGED1 has two distinct differentially expressed probe sets. Genes are ordered from bottom to top in Figure 1. For example, the genes in cluster G1 in Figure 1 are, from bottom to top, PDCL3, two probe sets for MAGED1, PRKCE, etc.
Table 3: Most informative GO terms for the clusters obtained from microarray data.
Cluster Size p-value IC GO term
G1 8 0.0063 1.835 cytoplasm
G2 4 0.20 1.835 cytoplasm
0.888 binding
G3 2 0.009 8.751 aminoacyl-tRNA ligase activity
5.841 translation 0.888 binding
G4 19 0.020 0.888 binding
G5 2 0.0007 12.012 carbon-sulfur lyase activity 1.835 cytoplasm
1.753 primary metabolic process
G6 2 0.21 4.705 negative regulation of biological process 3.420 hydrolase activity
3.411 cellular protein metabolic process
G7 8 0.020 1.366 membrane
G8 2 0.25 4.238 transporter activity
3.181 transport
2.866 integral to membrane G9 6 < 0.0001 3.967 extracellular region
visualisation of gene GO and expression profiles, and thereby facilitates hypothetisising gene functions in cells.
Availability and requirements
• Project name: csbl.go• Project home page: http://www.ltdk.helsinki.fi/sysbio/ csb/downloads/GeneOntologyHeatmap/
• Operating system(s): Platform independent; tested on Windows and Linux
• Programming language: R (version 2.6 or greater)
• License: GNU General Public License
Competing interests
The authors declare that they have no competing interests.
Authors' contributions
KO implemented the semantic similarity measures and GO based clustering functionality, and wrote the manu-script. ML implemented the heat map visualisation, pro-vided a tool to retrieve Ensembl annotations and critically commented the manuscript. SH coordinated the study and was involved in writing the manuscript. All authors read and approved the final manuscript.
Acknowledgements
We thank Dr Rolf I Skotheim for providing the testicular germ cell tumor microarray data. Financial support from Helsinki University Funds, Sigrid Jusélius Foundation, Biocentrum Helsinki, Academy of Finland (project 125826) and the Graduate School in Computational Biology, Bioinformat-ics, and Biometry (ComBi) is gratefully acknowledged.
References
1. Ashburner M, Ball C, Blake J, Botstein D, Butler H, Cherry J, Davis A, Dolinski K, Dwight S, Eppig J, Harris M, Hill D, Issel-Tarver L, Kasar-skis A, Lewis S, Matese J, Richardson J, Ringwald M, Rubin G, Sherlock G: Gene ontology: tool for the unification of biology. The Gene Ontology Consortium. Nat Genet 2000, 25:25-9. 2. Guo X, Liu R, Shriver C, Hu H, Liebman M: Assessing semantic
similarity measures for the characterization of human regu-latory pathways. Bioinformatics 2006, 22(8):967.
3. Pesquita C, Faria D, Bastos H, Ferreira A, Falcão A, Couto F: Metrics for GO based protein semantic similarity: a systematic eval-uation. BMC Bioinformatics 2008, 9(5):S4.
4. Brun C, Chevenet F, Martin D, Wojcik J, Guenoche A, Jacq B: Func-tional classification of proteins for the prediction of cellular function from a protein-protein interaction network. GENOME BIOLOGY 2004, 5:6-6.
5. Huang D, Sherman B, Tan Q, Collins J, Alvord W, Roayaei J, Stephens R, Baseler M, Lane H, Lempicki R: The DAVID Gene Functional Classification Tool: a novel biological module-centric algo-rithm to functionally analyze large gene lists. Genome Biol 2007, 8(9):R183.
6. Couto FM, Silva MJ, Coutinho PM: Measuring semantic similarity between Gene Ontology terms. Data Knowl Eng 2007, 61:137-152.
7. Lord P, Stevens R, Brass A, Goble C: Investigating semantic sim-ilarity measures across the Gene Ontology: the relationship between sequence and annotation. Bioinformatics 2003, 19(10):1275-1283.
8. Resnik P: Using information content to evaluate semantic similarity in a taxonomy. Proceedings of the 14th International Joint Conference on Artificial Intelligence 1995, 1:448-453.
9. Lin D: An information-theoretic defiition of similarity. Pro-ceedings of the 15th International Conference on Machine Learning 1998:296-304.
10. Jiang J, Conrath D: Semantic similarity based on corpus statis-tics and lexical taxonomy. Proceedings of International Conference on Research in Computational Linguistics 1997:19-33.
11. Schlicker A, Domingues F, Rahnenführer J, Lengauer T: A new measure for functional similarity of gene products based on Gene Ontology. BMC Bioinformatics 2006, 7:302.
12. Frohlich H, Speer N, Poustka A, Beißbarth T: GOSim-An R-pack-age for computation of information theoretic GO similari-ties between terms and gene products. BMC Bioinformatics 2007, 8:166.
Table 4: KEGG pathways for differentially expressed genes.
Cluster Gene KEGG pathways
G1 GABARAPL3 Regulation of autophagy
G1 PRKCE Tight junction, Fc epsilon RI signaling pathway, Type II diabetes mellitus G2 FVT1 Sphingolipid metabolism
G2 CBR3 Arachidonic acid metabolism
G3 WARS Tryptophan metabolism, Aminoacyl-tRNA biosynthesis
G4 PPP3CA MAPK signaling pathway, Calcium signaling pathway, Apoptosis, Wnt signaling pathway, Axon guidance, VEGF signaling pathway, Natural killer cell mediated cytotoxicity, T cell receptor signaling pathway, B cell receptor signaling pathway, Long-term potentiation, Amyotrophic lateral sclerosis (ALS)
G4 TJP2 Tight junction, Vibrio cholerae infection
G5 CTH Glycine, serine and threonine metabolism, Methionine metabolism, Cysteine metabolism, Selenoamino acid metabolism, Nitrogen metabolism
G5 GLO1 Pyruvate metabolism
G6 PLAU Complement and coagulation cascades
G6 PPAP2A Glycerolipid metabolism, Glycerophospholipid metabolism, Ether lipid metabolism, Sphingolipid metabolism G7 TLR5 Toll-like receptor signaling pathway, Pathogenic Escherichia coli infection -EHEC and EPEC
G7 OR5R1 Olfactory transduction G7 IFITM1 B cell receptor signaling pathway
G9 PDGFA MAPK signaling pathway, Focal adhesion, Gap junction, Regulation of actin cytoskeleton, Glioma, Prostate cancer, Melanoma
Publish with BioMed Central and every scientist can read your work free of charge
"BioMed Central will be the most significant development for disseminating the results of biomedical researc h in our lifetime."
Sir Paul Nurse, Cancer Research UK
Your research papers will be:
available free of charge to the entire biomedical community peer reviewed and published immediately upon acceptance cited in PubMed and archived on PubMed Central yours — you keep the copyright
Submit your manuscript here:
http://www.biomedcentral.com/info/publishing_adv.asp
BioMedcentral
13. Bodenreider O, Aubry M, Burgun A: Non-lexical approaches to identifying associative relations in the Gene Ontology. Pacific Symposium on Biocomputing. Pacific Symposium on Biocomputing 2005:91. 14. R Development Core Team: R: A Language and Environment for Statis-tical Computing 2007 [http://www.R-project.org]. R Foundation for Statistical Computing, Vienna, Austria
15. Anduril framework [http://csbi.ltdk.helsinki.fi/anduril/]
16. Good P: Permutation tests: a practical guide to resampling methods for testing hypotheses Springer series in statistics; 2000.
17. Skotheim R, Lind G, Monni O, Nesland J, Abeler V, Fossa S, Duale N, Brunborg G, Kallioniemi O, Andrews P, Lothe R: Differentiation of human embryonal carcinomas in vitro and in vivo reveals expression profiles relevant to normal development. Cancer Research 2005, 65(13):5588-5598.
18. SemSim package [http://bioconductor.org/packages/2.1/bioc/ html/SemSim.html]
19. Draghici S: Data Analysis Tools for DNA Microarrays Chapman & Hall/ CRC; 2003.
20. Pounds S, Cheng C: Robust estimation of the false discovery rate. Bioinformatics 2006, 22(16):1979.
21. Hubbard T, Barker D, Birney E, Cameron G, Chen Y, Clark L, Cox T, Cuff J, Curwen V, Down T, Durbin R, Eyras E, Gilbert J, Hammond M, Huminiecki L, Kasprzyk A, Lehvaslaiho H, Lijnzaad P, Melsopp C, Mongin E, Pettett R, Pocock M, Potter S, Rust A, Schmidt E, Searle S, Slater G, Smith J, Spooner W, Stabenau A: The Ensembl genome database project. Nucleic Acids Research 2002, 30:38.
22. Laga M, Cottyn A, Van Herreweghe F, Berghe W, Haegeman G, Van Oostveldt P, Vandekerckhove J, Vancompernolle K: Methylglyoxal suppresses TNF-α-induced NF-κB activation by inhibiting NF-κB DNA-binding. Biochemical Pharmacology 2007, 74(4):579-589.
23. Balendiran G, Dabur R, Fraser D: The role of glutathione in can-cer. Cell Biochemistry And Function 2004, 22:343-352.
24. Moore L, Malats N, Rothman N, Real F, Kogevinas M, Karami S, Gar-cia-Closas R, Silverman D, Chanock S, Welch R, Tardffon A, Serra C, Carrato A, Dosemeci M, García-Closas M: Polymorphisms in one-carbon metabolism and trans-sulfuration pathway genes and susceptibility to bladder cancer. Int J Cancer 2007, 120(11):2452-8.