R E S E A R C H
Open Access
Comparative description of ten transcriptomes of
newly sequenced invertebrates and efficiency
estimation of genomic sampling in non-model
taxa
Ana Riesgo
1,2*, Sónia C S Andrade
1, Prashant P Sharma
1, Marta Novo
1,3, Alicia R Pérez-Porro
1,2, Varpu Vahtera
1,4,
Vanessa L González
1, Gisele Y Kawauchi
1and Gonzalo Giribet
1Abstract
Introduction:Traditionally, genomic or transcriptomic data have been restricted to a few model or emerging model organisms, and to a handful of species of medical and/or environmental importance. Next-generation sequencing techniques have the capability of yielding massive amounts of gene sequence data for virtually any species at a modest cost. Here we provide a comparative analysis ofde novoassembled transcriptomic data for ten non-model species of previously understudied animal taxa.
Results:cDNA libraries of ten species belonging to five animal phyla (2 Annelida [including Sipuncula], 2
Arthropoda, 2 Mollusca, 2 Nemertea, and 2 Porifera) were sequenced in different batches with an Illumina Genome Analyzer II (read length 100 or 150 bp), rendering betweenca. 25 and 52 million reads per species. Read thinning, trimming, andde novoassembly were performed under different parameters to optimize output. Between 67,423 and 207,559 contigs were obtained across the ten species, post-optimization. Of those, 9,069 to 25,681 contigs retrieved blast hits against the NCBI non-redundant database, and approximately 50% of these were assigned with Gene Ontology terms, covering all major categories, and with similar percentages in all species. Local blasts against our datasets, using selected genes from major signaling pathways and housekeeping genes, revealed high
efficiency in gene recovery compared to available genomes of closely related species. Intriguingly, our transcriptomic datasets detected multiple paralogues in all phyla and in nearly all gene pathways, including housekeeping genes that are traditionally used in phylogenetic applications for their purported single-copy nature. (Continued on next page)
* Correspondence:[email protected]
1Museum of Comparative Zoology, Department of Organismic and
Evolutionary Biology, Harvard University, 26 Oxford Street, Cambridge, MA 02138, USA
2
Centro de Estudios Avanzados de Blanes, CSIC, c/ Accés a la Cala St. Francesc 14, Blanes, Girona 17300, Spain
Full list of author information is available at the end of the article
(Continued from previous page)
Conclusions:We generated the first study of comparative transcriptomics across multiple animal phyla (comparing two species per phylum in most cases), established the first Illumina-based transcriptomic datasets for sponge, nemertean, and sipunculan species, and generated a tractable catalogue of annotated genes (or gene fragments) and protein families for ten newly sequenced non-model organisms, some of commercial importance (i.e.,Octopus vulgaris). These comprehensive sets of genes can be readily used for phylogenetic analysis, gene expression profiling, developmental analysis, and can also be a powerful resource for gene discovery. The characterization of the transcriptomes of such a diverse array of animal species permitted the comparison of sequencing depth, functional annotation, and efficiency of genomic sampling using the same pipelines, which proved to be similar for all considered species. In addition, the datasets revealed their potential as a resource for paralogue detection, a recurrent concern in various aspects of biological inquiry, including phylogenetics, molecular evolution, development, and cellular biochemistry.
Keywords:Annelida, Arthropoda, Illumina, Mollusca, Nemertea, Next-generation sequencing, Porifera, Sipuncula
Background
Genetic studies in non-model organisms have been hin-dered by the lack of reference genomes, necessitating researchers to adopt time consuming and/or expensive experimental approaches. The advent of next-generation sequencing platforms (e.g., 454, Illumina, and SOLID), with concomitant decreases in sequencing costs due to escalating technological development, has made genomic and transcriptomic data increasingly accessible to re-search groups. To date, most de novo transcriptomes have been generated using Roche/454 (e.g.[1-5]) and have focused on single species. More recently, Illumina short reads have been used to build transcriptomic data-sets in non-model species [6-11], or combined with 454 data to assemble whole genomes [12], offering promising prospects for the availability of such data for taxa of bio-logical significance.
The advantages of transcriptomic data over genome sequencing range from their tractable size (ten to hun-dred times smaller than genomes) to their rapid pro-curement via large numbers of reads (from tens to a few hundred millions of short reads per lane, 100–150 bp) to facile assembly with intuitive software [13-15]. Tran-scriptomic sequencing offers advantages in the detection of rare transcripts with regulatory roles, given the enor-mous amount of reads covering each base pair (from 100 to 1,000x/bp generally) [16]. Also, transcriptomes contain fewer repetitive elements than genomes, redu-cing analytical burden during post-sequenredu-cing assembly.
De novo assembled transcriptomes have been employed
for gene discovery [3], phylogenomic analysis (e.g., [8,11,17-19]), microRNA and piRNA detection [16], detecting selection in closely related species [20], as well as for studies of differential gene expression (e.g.[2,7,21-23]), among other applications. Disadvantages of using transcriptomes for de novoassembly include issues with gene duplication, genetic polymorphism, alternative spli-cing, and transcription noise (e.g.[24,25]).
Many invertebrate phyla have been overlooked for gen-ome and transcriptgen-ome sequencing priority, and for sgen-ome groups, genomic data are particularly scarce. Among them, sponges (Porifera), ribbon worms (Nemertea), and peanut and segmented worms (Annelida) are particularly poorly studied with regard to genomics. The significance of such taxa stems from their utility for investigation of fundamental questions in evolutionary biology, such as the origins of metazoan organogenesis (e.g.[26], the tion and loss of segmentation (e.g.[27-29]), and the evolu-tion of terrestriality [30,31]. Lack of genomic data for these lineages is often accompanied by poor knowledge of basal relationships and evolutionary history. Furthermore, currently available genomic resources are often insuffi-cient for studying a broad diversity of organisms, given the phylogenetic distance between the lineage of interest and the available model organisms. For example, among arthropods, traditional model organisms are restricted to Holometabola—the lineage of insects with complete meta-morphosis—although many questions of evolutionary sig-nificance involve lineages outside of this derived group, such as the origin of flight at the base of Palaeoptera, and the evolution of terrestriality at the base of Hexapoda.
toxicology—among other applications of interest to us— we report here de novo assembled transcriptomes from 10 non-model invertebrate species belonging to five ani-mal phyla: Porifera (Petrosia ficiformis, Crella elegans), Nemertea (Cephalothrix hongkongiensis, Cerebratulus marginatus), Annelida (Hormogaster samnitica,
Sipuncu-lus nudus), Mollusca (Chiton olivaceus, Octopus
vul-garis) and Arthropoda (Metasiro americanus, Alipes
grandidieri). Two species per phylum were selected (we
grouped the annelid and the sipunculan species for com-parison; although the relationships between these lineages are not well established, most studies favor ei-ther a sister relationship of the two or a paraphyletic Annelida that includes Sipuncula [18,29,33,34]) to allow comparisons within and among phyla. Among the spe-cies selected, one is important for fisheries (the common octopus,Octopus vulgaris) and another has medical sig-nificance due to its potent venom (e.g., the African centipedeAlipes grandidieri).
In this article we characterized the effectiveness of the Illumina platform transcriptome sequencing strategy across these selected species with respect to data yield and quality. We compared the completeness of the data-sets obtained for each taxon by assessing the sequencing depth and recovery of gene ontology identifications, as well as protein families. Also, searches of targeted genes (e.g., elements of conserved signaling pathways as well as housekeeping genes) in our datasets and their coun-terparts in three fully sequenced invertebrate genomes were used to compare and assess the suitability of our transcriptome datasets for gene discovery. Our study should thus contribute towards assessing the use of Illu-mina sequencing for de novotranscriptome assembly in non-model organisms as a cost-effective and efficient way to obtain vast amounts of comparable data for ap-plication in a broad array of downstream procedures.
Results and discussion Transcriptome analysis
Assembling reads and selecting optimal assemblies
cDNA libraries were obtained from high quality mRNA (Additional file 1) for the ten species (Figure 1) and yielded betweenca. 25 and 52 million short reads using Illumina GAII (Table 1 and Additional file 2). After adaptor removal, thinning and trimming, we were left withca. 15 to 45 million high quality reads per species, which were assembled using de novo assembly algo-rithms (Table 2 and Additional file 2).De novoassembly of either genomic or transcriptomic data poses substan-tial computational challenges [16,35,36]. Several short-read assemblers are now available, such as Velvet [13], ABySS [14], Trinity [36], and CLC Genomics Work-bench (CLCbio, Aarhus, Denmark), among others. Most of these use de Bruijn graphs to assemble the reads,
although there are slight variations among them, with few showing more efficiency [9,16,37-40]. We selected CLC for its desktop application with a graphical user-interface, which facilitates analysis of the transcriptomic data.
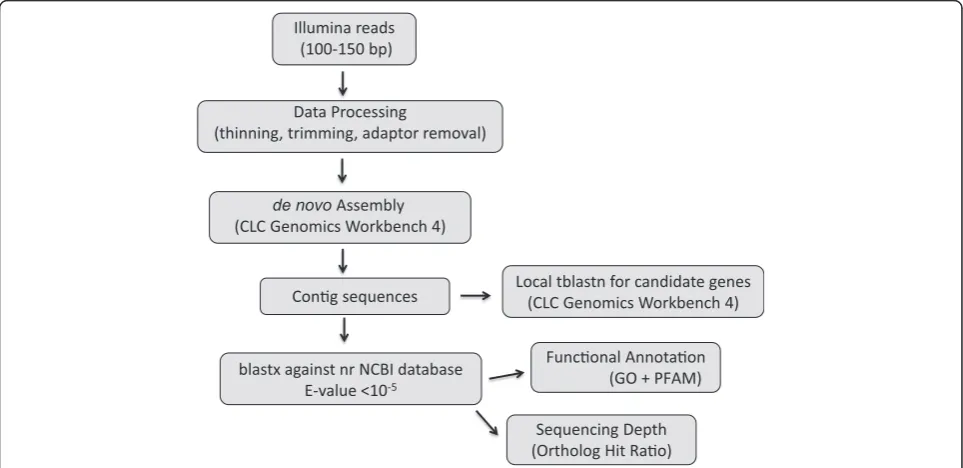
We processed the sequences obtained following the workflow shown in Figure 2. The filtering of reads based on quality parameters when using 0.005 as the limit resulted in removal of a larger portion of each read when low quality was detected, and in many instances an entire low-quality read was removed. Trimming per-formed with 0.005 as the limit was preferred if the initial quality of the reads was not very high. Otherwise, the least stringent value was preferred. Mean length of reads ranged between 65.4 bp inPetrosia ficiformisto 134.8 bp for Alipes grandidieri (Additional file 2). Although one may expect to have longer contigs with higher numbers of reads (Table 2), contig size did not have a direct cor-relation with the number of input reads. The length of the reads used for the assembly appeared to have an ef-fect on the length of the assembled contigs—the longest contigs appearing when the read length was greater than 120 bp (Table 2 and Additional files 2 and 3). Assem-blies performed with reads originally sequenced at 101 bp had an average maximum contig length of 6,939 bp ± 1,744.9 bp, whereas those obtained with reads originally sequenced at 150 bp showed larger numbers (9,809 ± 5,505.1 bp) of longest contigs.
Among the two resulting assemblies for each species (A and B, see Methods section; Additional file 2), we selected one (Table 2) based on combinations of opti-mality criteria (Additional file 4). The assemblies per-formed with the largest numbers of reads were not always the optimal ones (see Table 2 and Additional file 2). Parameters that affected the final decision were: number of contigs, number of bases, N50, number of contigs longer than 2 Kb, and maximum contig length (Additional file 4). In all cases, the selected assembly was that containing the largest amount of contigs over 2 Kb (Additional file 2). Only the selected assemblies are discussed below (Table 2 and Additional file 2).
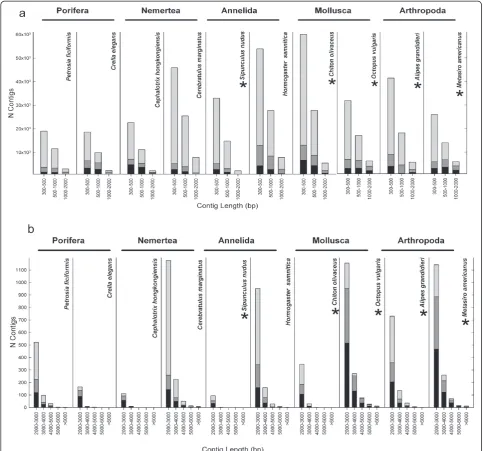
Transcriptome descriptors: number and length of contigs More than 40% of the reads were successfully assembled into contigs in all cases (Table 2), with more than 85% of the reads matching to resulting contigs inP.ficiformis
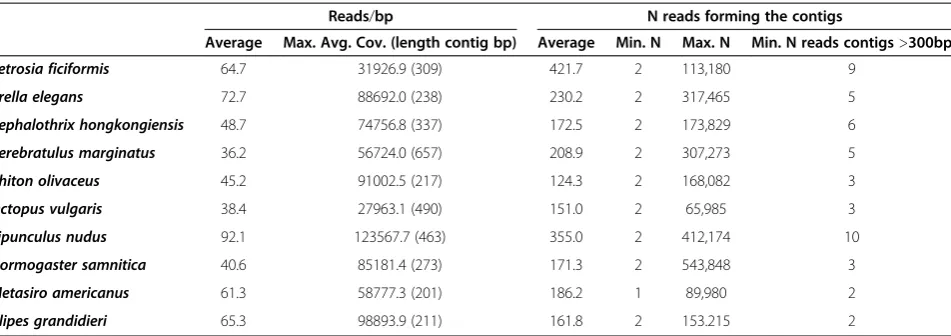
(Table 2). Coverage values for our transcriptomes (defined by number of reads covering a single base in each contig) varied between the lowest value of 36.2 in
Cerebratulus marginatus to the highest value of 92.1 in
Sipunculus nudus (see Table 3). In all cases, the longer the contig, the higher the coverage for each base (Additional file 5), although in some cases such as
were much higher in shorter contigs (Additional file 5). Coverage values are usually higher for Illumina than for other NGS platforms, ranging from around 5 to 7 for 454 datasets [1,41,42], to more than 30 for Illumina [9,39,43]. The average number of reads building each contig varied greatly, ranging from 421.7 reads for
Petro-sia ficiformis to 124.3 reads for Chiton olivaceus (see
Table 3). The maximum number of reads used to build each contig ranged from 65,985 in Octopus vulgaris to 543,848 in Hormogaster samnitica, and the minimum of 1 or 2 reads for each species (Table 3). Since very short contigs could be built with 1 paired-end read, we removed all contigs below 300 bp for each species prior to subsequent analyses. The minimum coverage for the
sub-selections was highly variable: between 2 and 10 reads per contig (see Table 3). Our coverage results suggested the possibility of redundancy in the sequen-cing process (i.e., a great number of reads assembling into one contig, meaning a much deeper sequencing of some DNA fragments). This redundancy was tolerated because the downstream applications for these datasets, include gene expression and/or population genetics, for which redundancy can be addressed at a later analytical step [44].
An average of 47.1 Mb (ranging from 26.7 for Crella
elegans to 75.9 Mb for Chiton olivaceus and
Hormoga-ster samnitica; Table 2) were assembled into contigs in our datasets, with results falling in a range comparable Homoscleromorpha
Choanozoa
Demospongiae
Calcarea
Cnidaria Ctenophora
Placozoa
Acoelomorpha
Deuterostomia
Chaetognatha
Priapulida
Kinorhyncha Loricifera Nematoda
Onychophora Tardigrada
Arthropoda
Polyzoa
Brachiopoda
Nemertea Annelida Mollusca
Ne
Sc E
Phoronida
Platyzoa Nematomorpha Hexactinellida
Pf: Porifera
Pf
P: Protostomia E: Ecdysozoa
T: Trochozoa S: Spiralia Sc: Scalidophora Ne: Nematozoa
M
B
N
P
S T
B: Bilateria M: Metazoa
to other previous studies with non-model species using 454 [41,45], although in many cases the assemblies were smaller [1]. Likewise, prior assemblies performed with Illumina reads ranged from 20 to 30 Mb [24,43,46-48], values lower than ours, probably because they used shorter sequencing lengths.
Contig N50 is a weighted median statistic such that 50% of the entire assembly is contained in contigs equal to or larger than this value (in bp). N50 for a genome is usually around 1 Kb, which represents the average size of an exon for animals [49]. The lowest N50 recovered among our selected datasets was that ofChiton olivaceus
(372, with an average length of 627.0 ± 305.3 bp) and the highest was for Octopus vulgaris(599, with an aver-age length of 1,122.9 ± 660.5 bp) (see Table 2). These values are smaller than those observed for transcrip-tomes assembled from 454 pyrosequencing data (e.g., 900 bp for the chickpea [39]; 893 bp forOncopeltus[41]; 693 bp for Acropora [1]) but similar to N50s obtained with Illumina RNAseq (e.g.[24,48]).
Our datasets contained a larger number of short con-tigs when compared to data obtained with 454 pyrose-quencers (e.g.[2,4,50]), with only 4.7% to 15.7% of our assemblies constituted by contigs > 1 Kb (Additional file 3). However, the proportion of contigs over 1 Kb found in our data was surprisingly high for transcriptomic data (Additional files 2 and 6), surpassing that of 454 sequen-cing in other invertebrates with comparable sequensequen-cing
effort, and similar to assemblies built with equal num-bers of Illumina reads [8,46]. For instance, the transcrip-tome of the deep-sea mollusk Bathymodiolus azoricus
(sequenced with 454) contained 3,071 contigs over 1 Kb [45], a smaller number than the > 5,000 contigs longer than 1 Kb in our mollusks,Chiton olivaceusandOctopus vulgaris (Additional file 6). Similarly, our results for arthropods (Additional file 6) outperform those obtained with 454 for several arthropod species [2,4,50]. Interest-ingly, our results for the number of contigs over 1 Kb (and also contigs > 500 bp) in the spongesPetrosia fici-formis and Crella elegans (Additional file 6) are similar to those found for the coral Acropora millepora, using 454 [22], indicating a similar sequencing depth.
Detection of chimeric sequences
The maximum contig length for each species varied greatly, ranging from 3,032 bp for Sipunculus nudus—
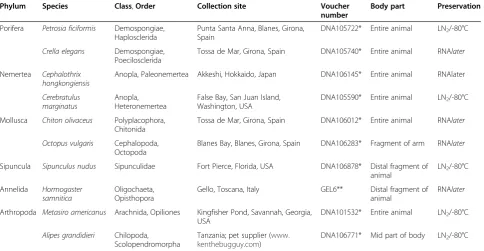
the library with the lowest values for most metrics of data quality—to 16,472 bp forOctopus vulgaris(Table 2). The appearance of very long contigs in transcriptomic assemblies can be due to the existence of chimeric or miss-assembled sequences. Therefore, to check for puta-tive chimeras (assembly artifacts), we translated the longest contig for each assembly to all 6 possible reading frames, took the longest open reading frame, and re-blasted it using the blastp program in NCBI. We also blasted the first and last 500 bases of each contig to Table 1 Collecting information for the 10 species used for this study
Phylum Species Class,Order Collection site Voucher number
Body part Preservation
Porifera Petrosia ficiformis Demospongiae, Haplosclerida
Punta Santa Anna, Blanes, Girona, Spain
DNA105722* Entire animal LN2/-80°C
Crella elegans Demospongiae, Poecilosclerida
Tossa de Mar, Girona, Spain DNA105740* Entire animal RNAlater
Nemertea Cephalothrix hongkongiensis
Anopla, Paleonemertea Akkeshi, Hokkaido, Japan DNA106145* Entire animal RNAlater
Cerebratulus marginatus
Anopla, Heteronemertea
False Bay, San Juan Island, Washington, USA
DNA105590* Entire animal LN2/-80°C
Mollusca Chiton olivaceus Polyplacophora, Chitonida
Tossa de Mar, Girona, Spain DNA106012* Entire animal RNAlater
Octopus vulgaris Cephalopoda, Octopoda
Blanes Bay, Blanes, Girona, Spain DNA106283* Fragment of arm RNAlater
Sipuncula Sipunculus nudus Sipunculidae Fort Pierce, Florida, USA DNA106878* Distal fragment of animal
LN2/-80°C
Annelida Hormogaster samnitica
Oligochaeta, Opisthopora
Gello, Toscana, Italy GEL6** Distal fragment of
animal
RNAlater
Arthropoda Metasiro americanus Arachnida, Opiliones Kingfisher Pond, Savannah, Georgia, USA
DNA101532* Entire animal LN2/-80°C
Alipes grandidieri Chilopoda, Scolopendromorpha
Tanzania; pet supplier (www. kenthebugguy.com)
DNA106771* Mid part of body LN2/-80°C
check whether they recovered the same blast hit. For all assemblies, except for Sipunculus nudus, the longest contig translated to well-known proteins with e-values
ca. 10-5with both the beginning and end retrieving the same blast hits. The longest contigs corresponded to a protocadherin forP.ficiformis, an Ets DNA binding pro-tein forCrella elegans, fibrillin 2 proteins forC.marginatus
andM. americanus, a collagen type IV for C. hongkon-giensis, an apolipophorin for C. olivaceus, titin for O.
vulgaris, CCR4-NOT transcription complex forH.
sam-nitica, and a low density lipid receptor-related protein forA.grandidieri. In the case ofS.nudus, the two long-est contigs contained small reading frames, while the third longest contig contained a sequence resembling a Table 2 Assembly parameters
N reads BT
N reads AT % reads discarded
Avg. L AT
NRMC N contigs
N bases (Mb)
Avg. L Contigs
SD Maximum Contig Length (bp)
N50 Avg. L SD
Petrosia ficiformis
49,758,556 32,612,454* 34.5 65.4 28,439,277 67,423 29.9 443.3 370.7 7,377 503 926.8 496.6
Crella elegans 26,513,534 25,951,906* 2.1 93.1 16,464,495 71,524 26.7 372.7 261.7 4,637 437 682.1 333.1
Cephalothrix hongkoiensis
51,091,244 26,631,980* 47.9 79.8 14,447,555 76,507 28.8 376.7 242.7 5,198 390 652.8 300.1
Cerebratulus marginatus
51,711,276 46,967,592* 9.2 73.8 22,977,409 109,947 57.1 518.0 394.2 7,731 559 991.0 521.6
Chiton olivaceus
46,265,184 40,889,060* 11.6 98.5 32,085,523 207,559 75.9 366.0 238.6 9,374 372 627.0 305.3
Octopus vulgaris
16,431,468 15,422,631* 6.1 125.0 11,670,780 77,383 41.7 540.0 125.0 16,472 599 1122.9 660.5
Sipunculus nudus
45,973,825 43,842,184** 4.6 100.5 25,679,520 71,960 31.2 431.7 228.0 3,032 437 676.2 262.5
Hormogaster samnitica
50,789,952 47,857,894** 5.8 96.5 32,511,666 190,189 75.9 399.8 312.5 7,319 423 766.6 426.8
Metasiro americanus
24,943,641 23,959,711** 3.9 129.6 19,735,275 101,929 43.9 439.5 423.0 10,407 477 1,010.3 621.7
Alipes grandidieri
32,294,430 31,561,359** 2.3 134.8 25,457,734 162,326 59.9 380.9 306.9 9,323 377 710.7 443.4
Grey background indicates libraries sequenced for 150 bp; otherwise they are 100 bp. Abbreviations:N, number;BT, before thinning and trimming;AT, after thinning and trimming;NMRC, number of reads matched to contigs;Mb, megabases;bp, base pairs;avg., average;L, length;SD, standard deviation; *, thinning limit of 0.05; **, thinning limit of 0.005.
growth hormone inducible transmembrane protein. The success in sequencing a complete transcriptome is diffi-cult to assess without a reference genome or without functional assays. Therefore, even though our transcrip-tome datasets did not show evidence of chimeric match-ing of reads, we cannot ascertain the overall sequencmatch-ing success in terms of coverage of the corresponding gen-ome. However, one of the advantages of the large se-quencing depth generated by Illumina is that it ensures more complete and effective coverage of the transcrip-tomes [24,51] than that of 454, preventing the appear-ance of mismatched assemblies of reads from different genes. Overall, our results also indicate that the produc-tion of dozens of millions of reads with Illumina often provide more complete transcriptomic datasets at a lower cost than those obtained with 454 (which usually render less than 1 million reads). This has been recently shown in a study on mollusk phylogenomics [8], where matrix completeness for Illumina data is superior to 454 data, and comparable to the data forLottia gigantea, for which a whole genome was available.
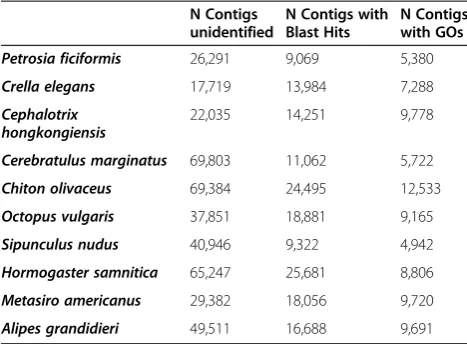
Functional annotation Gene ontology terms
Contigs above 300 bp for each of the selected assemblies were blasted against a selection of the nr database (Metazoa + Fungi). Roughly between 9,000 and 26,000 transcripts per species recovered blast hits (Table 4 and Additional file 7), only half of these being annotated (i.e., with an assigned GO term) in each case (Table 4 and Additional file 7). These numbers are similar to those of previous studies with both animal [1,9,41,45,52,53] and plant [39,42,47,48] de novo assembled transcriptomes. When the frequencies of contigs with blast hits and annotations were plotted against contig size, it became obvious that the longest contigs yielded blast hits and
annotations with a higher frequency (Figure 3). Very short contigs (300–500 bp) rarely returned blast hits or annotations, with approximately 60% to 90% of these sequences having an unidentifiable affiliation (Figure 3a). In nearly all transcriptomes, around 70% of the contigs between 2,000 and 3,000 bp retrieved blast hits and annotations (Figure 3b), (except inCerebratulus
margin-atusandHormogaster samnitica; 22% and 35%,
respect-ively) (Figure 3b). In the case of the nemertean, this could be due to the lack of a closely related reference genome. For the longest contigs (more than 3,000 bp), the percentage of blasted or annotated contigs was al-ways higher than 70% (Figure 3b). The total number of contigs annotated with BLAST2GO ranged between 4,942 inS.nudusand 12,533 inC.olivaceus(Table 4).
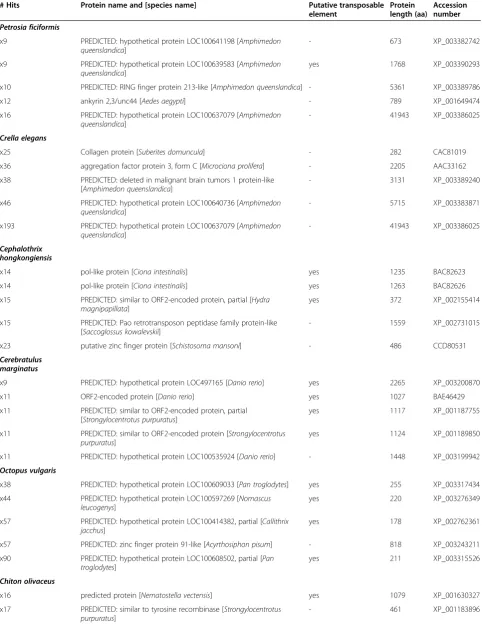
It should be noted that we are not considering all unique hits as individual genes, because transcriptomic assemblies can contain sequences belonging to non-overlapping fragments of the same gene. As a result, if a redundancy test is not performed, the number of unique blast hits found in transcriptomic data may be a gross overestimation of the number of genes present in the genomes of the focal taxa. We analyzed the level of re-dundancy in the blast searches (i.e., unique hits = only one contig matching each protein; redundant hits = more than one contig matching the same protein).
Crella elegans showed the highest redundancy levels,
with only 80.1% as unique hits, whereas Cerebratulus
marginatus recovered 93.6% unique hits in the blast
searches (Figure 3). Among the redundant hits, most of them were putative transposable elements (Table 5), which are known to comprise a large portion of gen-omes [54-56]. However, sequences of the metazoan transponsable elements are known for very few species [55], and therefore the occurrence of several hits to the same protein sequence could reflect lack of knowledge, Table 3 Coverage for the selected assemblies per species, estimated as the number of reads per bp and number of reads used to build the contigs (average value and maximum and minimum values)
Reads/bp N reads forming the contigs
Average Max. Avg. Cov. (length contig bp) Average Min. N Max. N Min. N reads contigs>300bp
Petrosia ficiformis 64.7 31926.9 (309) 421.7 2 113,180 9
Crella elegans 72.7 88692.0 (238) 230.2 2 317,465 5
Cephalothrix hongkongiensis 48.7 74756.8 (337) 172.5 2 173,829 6
Cerebratulus marginatus 36.2 56724.0 (657) 208.9 2 307,273 5
Chiton olivaceus 45.2 91002.5 (217) 124.3 2 168,082 3
Octopus vulgaris 38.4 27963.1 (490) 151.0 2 65,985 3
Sipunculus nudus 92.1 123567.7 (463) 355.0 2 412,174 10
Hormogaster samnitica 40.6 85181.4 (273) 171.3 2 543,848 3
Metasiro americanus 61.3 58777.3 (201) 186.2 1 89,980 2
Alipes grandidieri 65.3 98893.9 (211) 161.8 2 153.215 2
rather than redundant sequencing or deficient assembly. Interestingly, none of the most redundant hits in
Hormo-gaster samnitica was a transposable element (Table 5),
and in this case the redundancy might be due to the oc-currence of several splice variants of the same gene and non-overlapping fragments of the gene. In the case of the most redundant protein of Cerebratulus marginatus, the redundancy was caused by both factors in equal propor-tion: there were 3 paralogous sequences (or splice var-iants) that were fragmented. In both sponges, the most redundant hit corresponded to the putative eukaryotic ini-tiation factor 4E ofAmphimedon queenslandica(Table 5), which is a protein ofca. 42,000 amino acids, and thus the several contigs that matched it are fragments of the same gene that failed to be assembled.
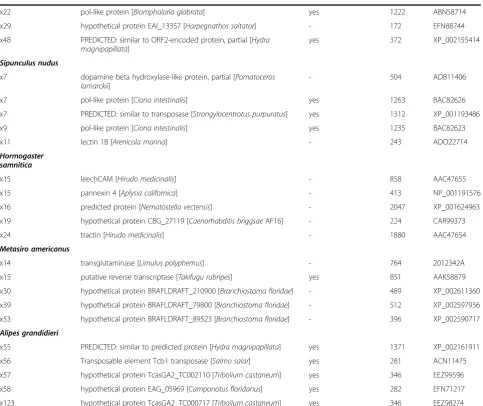
Following the criteria of Ewen-Campen et al. [41] we performed a search for specific GO terms of the categories “biological process”, “molecular function”, and “cellular component”(see Figure 4 and Additional file 8) in all spe-cies, and compared them among members of the same phylum (in the case of Annelida, betweenS.nudusandH.
samnitica). The GO assignment revealed that no
func-tional category of gene function was lacking in any of our transcriptomes. Irrespective of how many sequences were used for the GO assignment (which ranged from 9,069 to 25,681, see Table 4), the percentages of sequences mapped to given GO terms were highly similar for all species (Figure 4 and Additional file 8) and comparable to other animal transcriptomes [1,9,41,45,52,53]. However, the total numbers of GO terms retrieved for each transcrip-tome were very different across species (Additional file 8), suggesting the lack of sampling bias in the distribution of genes in the nr database. Our results reflect the compar-ability of the NGS datasets and the pipelines used for their annotation, in spite of intrinsic differences between vari-ous assembly strategies.
Detailed comparisons of GOs among our results and other published transcriptome datasets are not easy, be-cause different researchers have focused on GOs rele-vant to targeted biological questions. For the category “biological process”, we found that around 20% of the sequences grouped under “localization” in all species (Figure 4 and Additional file 8), and more than 10% showed also the categories“gene expression”,“signaling” and “signal transmission” (Figure 4). For “molecular function”, more than 50% of the sequences in every spe-cies fell under the “catalytic activity” category (ranging between 2,462 forSipunculus nudusand 6,068 forC. oli-vaceus; Additional file 7). Also, “hydrolase activity” con-tained more than 20% of the sequences in all species (Figure 4 and Additional file 8). For “cellular compo-nent”, most sequences belonged to “cytoplasm” (>20%) and “nucleus”(>10%), with very few sequences grouping under“ribosome”(Figure 4 and Additional file 8). Simi-lar results were reported for the categories “molecular function” and “cellular component” in the arthropods
Oncopeltus fasciatus [41] andParhyale hawaiensis [52],
however the most abundant nodes for those arthropods in“biological process”were“gene expression”,“ develop-mental process”,“multicellular organismal development” and “anatomical structure development” (>20%). The over-representation of development-related categories could be the consequence of the use of embryonic tis-sues for generating transcriptomes, which was the pur-pose of those studies. This was generally not the case for the species used in this study, exceptingMetasiro ameri-canus, for which both adults and various juvenile stages were pooled to facilitate comparison with a separate transcriptome of Opiliones that we generated for developmental applications [57,58]. Apropos, the Meta-sirotranscriptome had a higher number of GOs for em-bryonic development than the other 9 transcriptomes (Figure 4).Octopus vulgarisalso showed a high percent-age of GOs for embryonic development (Figure 4), even though in this case only a piece of an arm was used for the extraction. Also, Chiton olivaceus showed many sequences with GO associated term for the category“ devel-opmental process” (under “biological process”) (Figure 4), and also in this case we did not detect any reproductive tis-sue prior to homogenization. This could be due to a better annotation of molluscan developmental proteins to which the contigs blasted in this species, given that during the adulthood of some groups, there is a certain level of ex-pression of embryonic and developmental proteins.
For many characterized transcriptomes, among the most abundant categories in “biological function” are “metabolic”and“establishment of localization”processes [43,45,47,48,52]. The category“establishment of localization” was also abundant in our datasets (between 16.5 and 21.7%), with similar results for “metabolic processes” Table 4 Number of transcripts with blast hits and
associated Gene Ontology (GO) terms for each transcriptome
N Contigs unidentified
N Contigs with Blast Hits
N Contigs with GOs
Petrosia ficiformis 26,291 9,069 5,380
Crella elegans 17,719 13,984 7,288
Cephalotrix hongkongiensis
22,035 14,251 9,778
Cerebratulus marginatus 69,803 11,062 5,722
Chiton olivaceus 69,384 24,495 12,533
Octopus vulgaris 37,851 18,881 9,165
Sipunculus nudus 40,946 9,322 4,942
Hormogaster samnitica 65,247 25,681 8,806
Metasiro americanus 29,382 18,056 9,720
(Figure 4 and Additional file 8; not shown for“metabolic process”). All gene ontology assignments on transcrip-tomic data (including ours, see Figure 4 and Additional file 8) provided similar results for the categories“ molecu-lar function”and“cellular component”, wherein“catalytic (and mainly hydrolase) activity”, and“cytoplasm”and“ nu-cleus” contained the majority of the sequences with assigned GO terms [4,39,43,45,47,48,52,59,60].
Protein families
Searching for conserved domains in the Pfam database showed that ankyrin, WD40, protein kinase,
calcium-binding EGF domain, and fibronectin type III domain containing proteins were among the most abundant pro-tein families in all species (Figure 5), as found for other invertebrate transcriptomes [59]. The most abundant protein families in our transcriptomes are known to be involved in integration of cells into tissues, cell adhesion, signal transduction and transcription regulation to cell cycle control, autophagy and apoptosis.
Some protein families, such as those containing death domains, scavenger receptor cysteine-rich domains, and NHL repeats, were very abundant in sponges, whereas in bilaterians they were represented in much lower
*
Table 5 Protein names and lengths (in aminoacids, aa) for the five most redundant hits in each transcriptome
# Hits Protein name and [species name] Putative transposable element
Protein length (aa)
Accession number
Petrosia ficiformis
x9 PREDICTED: hypothetical protein LOC100641198 [Amphimedon
queenslandica]
- 673 XP_003382742
x9 PREDICTED: hypothetical protein LOC100639583 [Amphimedon
queenslandica]
yes 1768 XP_003390293
x10 PREDICTED: RING finger protein 213-like [Amphimedon queenslandica] - 5361 XP_003389786
x12 ankyrin 2,3/unc44 [Aedes aegypti] - 789 XP_001649474
x16 PREDICTED: hypothetical protein LOC100637079 [Amphimedon
queenslandica]
- 41943 XP_003386025
Crella elegans
x25 Collagen protein [Suberites domuncula] - 282 CAC81019
x36 aggregation factor protein 3, form C [Microciona prolifera] - 2205 AAC33162
x38 PREDICTED: deleted in malignant brain tumors 1 protein-like [Amphimedon queenslandica]
- 3131 XP_003389240
x46 PREDICTED: hypothetical protein LOC100640736 [Amphimedon
queenslandica]
- 5715 XP_003383871
x193 PREDICTED: hypothetical protein LOC100637079 [Amphimedon queenslandica]
- 41943 XP_003386025
Cephalothrix hongkongiensis
x14 pol-like protein [Ciona intestinalis] yes 1235 BAC82623
x14 pol-like protein [Ciona intestinalis] yes 1263 BAC82626
x15 PREDICTED: similar to ORF2-encoded protein, partial [Hydra magnipapillata]
yes 372 XP_002155414
x15 PREDICTED: Pao retrotransposon peptidase family protein-like [Saccoglossus kowalevskii]
- 1559 XP_002731015
x23 putative zinc finger protein [Schistosoma mansoni] - 486 CCD80531
Cerebratulus marginatus
x9 PREDICTED: hypothetical protein LOC497165 [Danio rerio] yes 2265 XP_003200870
x11 ORF2-encoded protein [Danio rerio] yes 1027 BAE46429
x11 PREDICTED: similar to ORF2-encoded protein, partial [Strongylocentrotus purpuratus]
yes 1117 XP_001187755
x11 PREDICTED: similar to ORF2-encoded protein [Strongylocentrotus purpuratus]
yes 1124 XP_001189850
x11 PREDICTED: hypothetical protein LOC100535924 [Danio rerio] - 1448 XP_003199942
Octopus vulgaris
x38 PREDICTED: hypothetical protein LOC100609033 [Pan troglodytes] yes 255 XP_003317434
x44 PREDICTED: hypothetical protein LOC100597269 [Nomascus leucogenys]
yes 220 XP_003276349
x57 PREDICTED: hypothetical protein LOC100414382, partial [Callithrix jacchus]
yes 178 XP_002762361
x57 PREDICTED: zinc finger protein 91-like [Acyrthosiphon pisum] - 818 XP_003243211
x90 PREDICTED: hypothetical protein LOC100608502, partial [Pan troglodytes]
yes 211 XP_003315526
Chiton olivaceus
x16 predicted protein [Nematostella vectensis] yes 1079 XP_001630327
x17 PREDICTED: similar to tyrosine recombinase [Strongylocentrotus purpuratus]
numbers (Figure 5). In contrast, other protein families (e.g., zinc finger Cys2His2-like proteins, trypsins, and C-type lectins) appear in much higher numbers in bilater-ians than in sponges (Figure 5). In our Pfam searches, the MAM domain [61], which is present in proteins like neuropilin, meprin or zonadhesins, was found only in our bilaterian transcriptomes but not in the sponges, and was particularly abundant in Chiton olivaceus and
Sipunculus nudus(Figure 5).
While we found around 550 protein kinases in sponges,
theAmphimedongenome includes 705 kinases,
represent-ing the largest metazoan kinome [62]. Between 380 and 580 protein kinases were also found for both nemerteans, both molluscs, and both arthropods (Figure 5), which constitute higher numbers than those observed for the protein kinase family in the genomes of Nematostella
vectensis, Caenorhabditis elegans, Drosophila melanoga-ster,Ciona intestinalis, or Homo sapiens[63,64]. Interest-ingly, in our annelids we found another extreme case, the lowest expressed protein kinase repertoire found in
Sipunculus nudus, whereas the oligochaete Hormogaster
samnitica contained more than one thousand protein
kinases (Figure 5).
Estimation of transcriptome completeness Local blast
Transcriptomic datasets can be used as a resource for functional gene screenings or to identify new phylogen-etic markers in poorly known organisms. Here, we defined 28 genes belonging to four different categories (the Notch, transforming growth factor β [TGF-β], and Hedgehog signaling pathways; and 7 housekeeping
Table 5 Protein names and lengths (in aminoacids, aa) for the five most redundant hits in each transcriptome
(Continued)
x22 pol-like protein [Biomphalaria glabrata] yes 1222 ABN58714
x29 hypothetical protein EAI_13357 [Harpegnathos saltator] - 172 EFN88744
x48 PREDICTED: similar to ORF2-encoded protein, partial [Hydra magnipapillata]
yes 372 XP_002155414
Sipunculus nudus
x7 dopamine beta hydroxylase-like protein, partial [Pomatoceros lamarckii]
- 504 ADB11406
x7 pol-like protein [Ciona intestinalis] yes 1263 BAC82626
x7 PREDICTED: similar to transposase [Strongylocentrotus purpuratus] yes 1312 XP_001193486
x9 pol-like protein [Ciona intestinalis] yes 1235 BAC82623
x11 lectin 1B [Arenicola marina] - 243 ADO22714
Hormogaster samnitica
x15 leechCAM [Hirudo medicinalis] - 858 AAC47655
x15 pannexin 4 [Aplysia californica] - 413 NP_001191576
x16 predicted protein [Nematostella vectensis] - 2047 XP_001624963
x19 hypothetical protein CBG_27119 [Caenorhabditis briggsaeAF16] - 224 CAR99373
x24 tractin [Hirudo medicinalis] - 1880 AAC47654
Metasiro americanus
x14 transglutaminase [Limulus polyphemus] - 764 2012342A
x15 putative reverse transcriptase [Takifugu rubripes] yes 851 AAK58879
x30 hypothetical protein BRAFLDRAFT_210900 [Branchiostoma floridae] - 489 XP_002611360
x39 hypothetical protein BRAFLDRAFT_79800 [Branchiostoma floridae] - 512 XP_002597956
x53 hypothetical protein BRAFLDRAFT_89523 [Branchiostoma floridae] - 396 XP_002590717
Alipes grandidieri
x55 PREDICTED: similar to predicted protein [Hydra magnipapillata] yes 1371 XP_002161911
x56 Transposable element Tcb1 transposase [Salmo salar] yes 281 ACN11475
x57 hypothetical protein TcasGA2_TC002110 [Tribolium castaneum] yes 346 EEZ99596
x58 hypothetical protein EAG_05969 [Camponotus floridanus] yes 282 EFN71217
x123 hypothetical protein TcasGA2_TC000717 [Tribolium castaneum] yes 346 EEZ98274
proteins; see details in Table 6) and searched the tran-scriptome datasets for homologs of each gene. To en-gender comparability with fully sequenced and annotated invertebrate genomes, we isolated the coun-terparts of these 28 genes from the complete genomes of
Amphimedon queensladica [62], Lottia gigantea (JGI),
andCapitella teleta(JGI) using tblastn.
Duplications of genes and entire genomes are believed to be important mechanisms underlying morphological variation and functional innovation in the evolution of life, and especially for development of diversity both at a small and a large scale [65-67]. Even though the sig-nificance of signaling gene duplications in evolution is not well understood, metazoan phyla demonstrably dif-fer in their number of signaling genes [68]. In silico
comparisons of the evolution of signaling pathways might reveal then important conclusions. Here, with a very simple approach, we tested the sampling of our transcriptomes for detection of important signaling molecules and their possible duplications in species with limited availability of other genetic resources. For instance, in sponges 100% of the selected genes for the Notch, TGF-β, and Hedgehog signaling pathways that were found in the A. queenslandica genome were also found in our transcriptomes of P. ficiformis and Crella
elegans (Table 6). Our datasets even found gene
tran-scripts inP.ficiformis(mothers-against-decapentaplegic-1) and in Crella elegans (mothers-against-decapentaplegic-1 andmothers-against-decapentaplegic-2) not recovered for
A.queenslandica(Table 6) in our searches or in the gen-ome characterization [62].
Likewise, a high percentage of genes for the Notch, TGF-β, and Hedgehog signaling pathways were found both in theLottiagenome and the transcriptomes of our nemerteans and mollusks, with very few absences in each case (see Table 6). Duplication of genes in nemerteans was detected innotch,hairy/enhancer-of-split (HES), and del-tex (Table 6); while in mollusks gene duplication was found only forHES, with three paralogues inC.olivaceus, and two in O. vulgaris (Table 6), and frizzled, with two paralogues in O. vulgaris(Table 6). The comparisons be-tween the results obtained for our transcriptomes and the reference genomes of annelids and arthropods were very similar (Table 6). However, the data for S. nudus were markedly different, as very few genes were recovered from the transcriptome, mainly due to the high redundancy observed in the transcripts.
Other studies with arthropods have taken the same ap-proach, searching for signaling pathway genes in their transcriptome datasets in comparison to reference gen-omes (e.g.[41,52]). Those cases corroborate comparabil-ity between the transcriptomic and the genomic data we observed, although, as in our case, the sequences recov-ered from the transcriptomes were shorter than the gen-omic ones. Nevertheless, many of these transcripts are sufficiently long that they can be readily used for phylo-genetic inference as well as experimental applications such as in situ hybridization and RNAi-mediated gene knockdown (a fragmentca. 500 bp in length is sufficient for either of these techniques [52,57,58]).
histories, owing to paralog losses, subfunctionalization, and/or neofunctionalization [65,66,69,70]. Failure to de-tect paralogues can lead to misinterpretations of cellular biochemistry, and often inaccuracies in reconstructions of phylogeny and molecular evolution [71,72]. Here, transcriptome sequencing proved to be useful in paralo-gue detection, for which traditional methods (e.g.,
cloning and colony PCR) are inefficient. All housekeep-ing genes were found among our transcriptomes, barrhousekeep-ing a few absences (see Table 6), with very similar results also found in the selected genomes. However, the most interesting results involved the paralogues found for four housekeeping genes. The poriferans A. queenslandica
and P. ficiformis (both constituents of the order
Table 6 Individual searches for our transcriptome datasets (no background color) and the JGI genomes of a sponge (pink), a mollusk (violet), and an annelid (green)
Notch
Notch Delta Jagged/ Serrate
Fringe HES SuH Deltex
Petrosia ficiformis 578 247 680 346 234 510 157
Crella elegans 472 247 247 307 85 300 147
Amphimedon queenslandica
1667/614 539 1320 413/
370/279
290 656 454
Cephalotrix hogkongiensis
272/173/103 139 - 137 343/309/110 205 168/89
Cerebratulus marginatus
286/495 101 131 140 358/109/167 271 233
Chiton olivaceus 498 358 - 123 289/174/96 168 65
Octopus vulgaris 916 217 - - 324/247 445 101
Lottia gigantea 2404 724 1245 350 231 549 230
Sipunculus nudus 451/232/241 - - -
-Hormogaster samnitica
464/546/684/ 456
521/268/260/ 388/314/170
- 200/197 350/314/238/
173/133/108
521/ 482
171/ 952
Capitella teleta 2580/2612/ 2673/2985
785 1204 207 307/199/141 459/
445 610
Metasiro americanus
600 780 552 340 58/179/ 344 493
-Alipes grandidieri 196/203 151 115/416 66/82 80/294 273 415
TGF-β
TGF-β1 Activin Smad 1 Smad 2 Smad 3 dpp BMP1 BMP3 BMP5 BMP6
Petrosia ficiformis 435 - 230 - 186 - 184 - - 102
Crella elegans 90 - 408 98 190 - 150 - - 140
Amphimedon queenslandica
371 - 408/412/181 - - - 1035 - - 413
Cephalotrix hogkongiensis
251 118 151 - 307 - 208 - 114
-Cerebratulus marginatus
413 120 473 - 266 - 172 - 114
-Chiton olivaceus 109 285 77 - 242 181 110 - 152
Octopus vulgaris - 500 302 - - 97 107 308 - 679
Lottia gigantea 516 523/576 466 428 - 406 332 381 104
-Sipunculus nudus - 59 - - - - 153 - -
-Hormogaster samnitica
446/317 192 472 - 417 104 226 96 -
-Capitella teleta 511 471/429 309 452 339 1 239 -
-Metasiro americanus
362/374 407/71 - 287 - 351 340/
613
117 411 160
Alipes grandidieri 425/507 - 117 - 94 173 113 480 -
-Hedgehog Housekeeping genes
Hedgehog/ Hedgling
Patched Smoothened/ Frizzled
Ci/Gli TPI ATPB MAT PFK FBA EF-1α CAT
Petrosia ficiformis 1212 - 288/252/133 343 165 180 94 239 231 253 383/
422
Crella elegans 327 - 165/156 517 218 267 377/
162
139 172/
128
460 374
Haplosclerida) have two paralogues for catalase (CAT; Table 6) of ca. 400 amino acids in length. The gene fruc-tose biphosphate aldolase(FBA) has also two paralogues inCrella elegansandS.nudus(Table 6). The nemertean
C. hongkongiensis and the annelid H. samnitica each
have two paralogues for elongation factor-1α (EF-1α)
(Table 6). Two or three paralogues were found for all species for the gene elongation factor thermo unstable
(EF-Tu; not shown in Table 6) which contains a very similar domain to EF-1α and is localized in the mito-chondria [73]. Methionine adenosyltransferase (MAT) has two paralogues in the spongesA.queenslandicaand
Crella elegans, in the earthworm H. samnitica, and in the arthropods M. americanus and A. grandidieri
(Table 6).
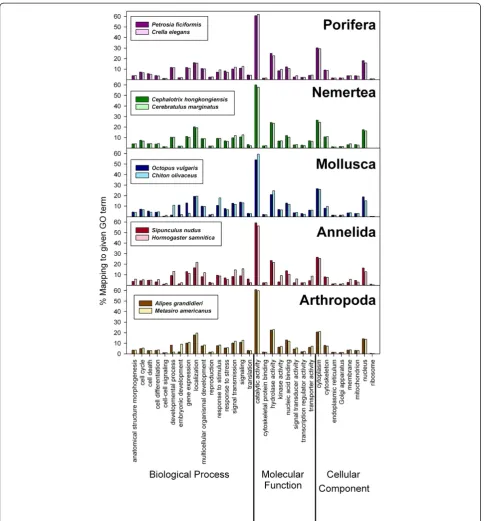
Housekeeping genes are frequently used as phylogen-etic markers because they are putatively paralogy-free [72]. According to our survey of housekeeping genes, at least five are shown to have two or more paralogues. In order to test whether they bear similar or contradicting phylogenetic signals, we constructed a phylogenetic tree using all paralogues we found in our transcriptomes for the geneMAT(Figure 6). While the paralogues ofC. ele-gansand H.samniticaclustered, neither the two paralo-gues ofM. americanus, nor those of another Opiliones,
Phalangium opilio, formed a clade, suggesting the possi-bility of ancient duplications of MAT in chelicerate arthropods. Thus, the use of each paralogue sequence for phylogenetic purposes needs to be carefully evalu-ated, as ignorance of paralogy or erroneous assumption
of single-copy genes can confound inference of tree top-ology. This might be the case for several arthropod phy-logenies, which were constructed using genes afflicted by paralogy. For example, in centipedes (Arthropoda, Myriapoda, Chilopoda), it was previously observed that datasets dominated by nuclear ribosomal genes favored one topology that accorded greatly with morphological and paleontological data [74,75]. By contrast, datasets comprised of three nuclear protein-encoding genes (elongation factor-1α,elongation factor-2, andRNA poly-merase II) favored a radically different topology, with a derived placement of the lineage traditionally considered sister to the remaining centipedes [76]. It was shown that this conflict originated in the nuclear coding mar-kers [74,77], and a subsequent phylogenomic analysis using 62 protein-coding genes [78] vindicated the trad-itional phylogeny of the group (sensu [79]). This was also the case for the arthropodM.americanus, in which direct sequencing of clones for elongation factor-1α
revealed numerous and non-concerted paralogous copies of elongation factor-1α (as in MAT, above), hindering use of this marker in studies of statistical phylogeogra-phy [80]. It is possible that conflicts documented be-tween ribosomal and protein-encoding data partitions in arthropod (and other) phylogenies are attributable to paralogy in one or both types of data. In addition to re-fining phylogeny analysis, recognition of paralogy will improve our understanding of the evolutionary processes that generated biochemical, cellular, and developmental innovations [70].
Table 6 Individual searches for our transcriptome datasets (no background color) and the JGI genomes of a sponge
(pink), a mollusk (violet), and an annelid (green)(Continued)
Amphimedon queenslandica
439/ 385
508/ 498
Cephalotrix hogkongiensis
- - 199 - 141 264 - 698 - 191/
79 152
Cerebratulus marginatus
- - 100 248 393 100 705 38 331 255
Chiton olivaceus 303 - 465 105 235 499 247 421 121 - 190
Octopus vulgaris - 145 590/305/221 - 79 509 332 815 60 109 335
Lottia gigantea 355 527 879/572/489 1493 252 521 410 770 273 469 510
Sipunculus nudus 91 - - - 222 325 247 - 243/
113
333 509
Hormogaster samnitica
386/301/127 555/536/107 838 695 150 178 402/
106
585 213 230/
133 458
Capitella teleta 329 1465 589/597/591 235 240 479 393 826 364 463 534
Metasiro americanus
236 670 75/577 597 236 210 261/
182
766 213 207 101
Alipes grandidieri 285 132 66 681 235 289 107/78 525 202 124 431
Ortholog hit ratio
The ortholog hit ratio (OHR) is an estimate of the amount of a transcript contained in a gene, with respect to a reference sequence. Ortholog hit ratios greater than 1.0 likely indicate large insertions in genes [60]. It is im-portant to note that to calculate the OHR, we used as reference the first blast hit for each of the contigs; final OHR estimation is a function of the completeness of
especially affected. However, we observed that the aver-age values for the OHR in all our species were around 0.3 (Figure 7 and Additional file 9), similar to OHR values of the organisms in which OHR had been previ-ously calculated (all arthropods [41,52,81]). Given that sequences were obtained with short read transcriptomic data, it was expected that the length of the sequence would be inversely proportional to OHR (Figure 7 and Additional file 9). We did not observe significant differ-ences between the medians or quartiles of the OHR across our taxa (Figure 8). It may be that the quality of the RNA extraction, and also an unbiased mRNA frag-mentation, may be better predictors of the mean OHR than the phylogenetic affinity of the focal taxon, al-though this prediction was not tested in our study. These data suggest that in the future, as complete gen-omes are obtained for all animal phyla, the OHR values
presently obtained might change, but in a manner irre-spective of phylogenetic affinity.
Reassembly of datasets
We assessed the completeness of the datasets by reassem-bling all datasets, adding 5 million reads per iteration. Fol-lowing this approach, number of contigs for most transcriptomes had saturated by the time the 5 million reads where added (Figure 9), except forS.nudusandO. vulgaris. For the N50, onlyO.vulgaris,C.hongkongiensis,
C. marginatus, and H. samnitica increased slightly their values when adding the last batch of reads. With this ana-lysis, we accrue confidence that sequencing efforts were sufficient to estimate accurately the completeness of our transcriptomic datasets (excepting S. nudus, which had other limitations in data quality and assembly). It is im-portant to note that the assembly statistics obtained
Capsaspora owczarzaki
Monosiga brevicollis
Trichoplax adhaerens Obelia sp.
Hydra vulgaris
Aphrocallistes vastus Oscarella carmela
Plakortis angulospiculatus Aplysina fulvaVerongula rigida
Leucilla nutingi Leucosolenia sp.
Sycon lingua
Caenorhabditis elegans Haliclona sp.
Cinachyrella alloclada
Geodia gibberosa
Trochospongilla pennsylvanica Petrosia ficiformis Suberites sp.
Tethya actinia
Crella elegans 2
Microciona prolifera
Crella elegans 1
Ophelia limacina
Nereis vexillosa
Alipes grandidieri
Daphnia pulex Artemia franciscana
Metasiro americanus 2
Amblyomma maculatum
Metasiro americanus 1
Ixodes scapularis Clonorchis sinensis Enallagma aspersum Lestes congener Pediculus humanus Culex quinquefasciatus Aedes aegypti Glossina morsitans Drosophila melanogaster Tribolium castaneum Bombyx mori Danaus plexippus Harpegnathos saltator Nasonia vitripennis Megachile rotundata Camponotus floridanus Xenoturbella bocki Acromyrmex echinatior Brugia malayi Antedon mediterranea Patiria miniata Strongylocentrotus purpuratus
Ophiopholis sp.
Ptychodera flava Saccoglossus kowaleskii Priapulus caudatus Schistosoma mansoni Brachionus plicatilis Phoronopsis harmeri Tubulanus polymorphus Amphiporus angulatus Cerebratulus lacteus Lineus viridis Terebratulina retusa Leptochiton asellus Schistomeringos neglecta Owenia fusiformis Tonicella rubra Antalis entalis Haliotis rufescens Nautilus pompilius Euprymna scolopes Oligochaetasp. Arenicola marina Lumbricus rubellus
Hormogaster samnitica 1
Hormogaster samnitica 2
Erpobdella octoculata Eurythoe complanata Sipunculus nudus Nephasoma pellucidum Plumatella repens Octopus vulgaris
Phalangium opilio 1
Phalangium opilio 2
Deuterostomia Platyzoa Ecdysozoa Trochozoa Cnidaria Placozoa Metazoa
during reassembly were not strictly in concordance with those obtained in the firstde novoassembly for the data-sets, as a newer version of the software was used in this case (CLC Genomics Workbench 5.1).
Conclusions
Reduction in sequencing costs and the unprecedented amount of data facilitated by NGS foretells access to a plethora of biological applications in many disciplines, and provides genetic resources essential for expanding understanding of comparative organismal biology and evolutionary history. Here we generated comparative transcriptomic data for ten non-model invertebrates in multiple phyla (Annelida, Arthropoda, Mollusca, Nemer-tea, and Porifera) using the Illumina sequencing plat-form, and produced a tractable catalogue of raw contig sequences and annotated genes for application in phylo-genetic analysis, gene expression profiling, and/or devel-opmental analysis. The identity of the lineage and genomic resources previously available for each phylum did not affect metrics of assembly quality. Gene Ontol-ogy assignments indicated that no functional gene cat-egory was absent or insufficiently sampled in any of the transcriptomes, corroborating the consistency of our pipelines with regard to sequencing and depth of anno-tation. Finally, we found that our datasets are a useful resource for paralogue detection.
Methods Sample collection
We collected tissue samples from 10 invertebrate spe-cies, belonging to five phyla, Annelida (including Sipun-cula), Arthropoda, Mollusca, Nemertea, and Porifera, (Figure 1), which include members of several major ani-mal clades [82]. Collecting information is provided in Table 1.
Sample preparation
For sponge and earthworm samples, in order to avoid contaminations from epibionts, tissues were carefully cleaned (and the gut removed in the earthworm) using a stereomicroscope. Tissue excisions were always per-formed with sterilized razor blades rinsed in RNAse-ZapW (Ambion, Texas, US). All cleaning procedures were operated as quickly as possible to avoid RNA de-generation in an RNAse-free and cold environment (in dishes kept on ice, for example).
Preservation of tissues was performed soon after the animals were collected, usually 1 to 5 hours later de-pending on the time required for cleaning samples. Tis-sues were cut into pieces from 0.25 cm to 0.5 cm in thickness, except for tissues of C.hongkongiensis, which were not chopped due to small size. Usually, between 20 to 80 mg of tissue were placed in each eppendorf tube for subsequent processing. Tissue samples were either flash-frozen in liquid nitrogen and immediately stored at −80°C; or they were immersed in at least 10 volumes of
RNAlaterW at 4°C for 1 hour, incubated overnight at
−20°C, and subsequently stored in the same buffer at −80°C until RNA was extracted (sometimes samples placed in RNAlater were transported back to the lab at room temperature, and then stored at−80°C).
mRNA extractions
Two different methods of RNA extraction were used: 1) total RNA extraction followed by mRNA purification for nemerteans, molluscs, annelids, and arthropods, and 2) direct mRNA extraction for sponges. Protocols used for both extraction types are available elsewhere [83].
Quantity and quality control of mRNA
Quantity and quality (purity and integrity) of mRNA were assessed by three different methods. We measured
the absorbance at different wavelengths using a Nano-Drop ND-1000 UV spectrophotometer (Thermo Fisher Scientific, Wilmington, Massachusetts, USA). Quantity of mRNA was also assessed with the fluorometric quan-titation performed by the QubiTW Fluoremeter
(Invitrogen, California, USA). Also, capillary electro-phoresis in an RNA Pico 6000 chip was performed using an Agilent Bioanalyzer 2100 System with the “mRNA pico Series II” assay (Agilent Technologies, California, USA). Integrity of mRNA was estimated by the
a
b
electropherogram profile and lack of rRNA contamin-ation (based on rRNA peaks for 18S and 28S rRNA given by the Bioanalyzer software).
Next-generation sequencing
Next-generation sequencing was performed using the Illumina GAII platform (Illumina, Inc., San Diego, Cali-fornia, USA) at the FAS Center for Systems Biology at Harvard University. mRNA concentrations between 11.5 and 77.4 ng/μL (Additional file 1) were used for cDNA synthesis, which was performed following methods pub-lished elsewhere [83]. cDNA was ligated to homemade adapters (designed by Steve Vollmer,personal
communi-cation) in Petrosia ficiformis (50-ACA CTC TTT CCC
TAC ACG ACG CTC TTC CGA TCT GGT T-3') and
in Crella elegans ( 50-ACA CTC TTT CCC TAC ACG
ACG CTC TTC CGA TCT CAG T-3') whereas ds cDNA was ligated to Illumina adapters in the rest of species. Size-selected cDNA fragments of around 300 bp (Additional file 1) excised from a 2% agarose gel were amplified using Illumina PCR Primers for Paired-End reads (Illumina, Inc.) and 18 cycles of the PCR program 98°C-30 s, 98°C-10 s, 65°C-30 s, 72°C-30 s, followed by an extension step of 5 min at 72°C.
The concentration of the cDNA libraries was mea-sured with the QubiTW dsDNA High Sensitivity (HS) Assay Kit using the QubiTW Fluoremeter (Invitrogen, Carlsbad, California, USA). The quality of the library and size selection were checked using the “HS DNA assay” in a DNA chip for Agilent Bioanalyzer 2100 (Agi-lent Technologies, California, USA). Four different pro-files of cDNA libraries were obtained consistently: 1, a tight band of targeted size with high cDNA concentra-tion; 2, a tight band of targeted size and additional “bumps”of smaller or larger fragments; 3, no bands; 4, a tight band of targeted size with low cDNA concentra-tion. cDNA libraries were considered successful when the final concentration was higher than 1 ng/μL and the Bioanalyzer profile was optimal (1 or 2) [83]. Successful libraries were brought to 10 nM or 7nM depending on the initial concentration prior to sequencing. The paired-end reads had lengths of 101 bp for the sponge, nemertean, annelid, and sipunculan species, and 150 bp for the mollusk and arthropod species.
Sequence assembly
Removal of low quality reads or portions of them (i.e., thinning and trimming analyses) for the raw reads was done with CLC Genomics Workbench 4.6.1 (CLC bio, Aarhus, Denmark). Thinning refers to discarding of nucleotides and/or entire reads based on quality para-meters. It was performed using 0.05 (Assembly A) and 0.005 (Assembly B) as the limit (based onPhredquality scores (q) [84], where the q is converted into a
probability (p) of error in 10q/-10, and the limit – p will be negative when the quality is low). The resulting qual-ity of the thinned reads was visualized FastQC (http:// www.bioinformatics.bbsrc.ac.uk/projects/fastqc/). After thinning, only those terminal bases with a Phred quality score under 30 were trimmed (where a Phred score of 30 corresponds to a probability of 10-3of incorrect base calling; see Table 2 and Additional file 2), producing sequences of unequal size (i.e., trimming). Reads were re-screened to check for presence of adapter or primer sequences using FastQC, and if present, they were removed using CLC Genomics Workbench 4.6.1.
De novo assemblies with all datasets thinned and
trimmed with various parameters were performed with CLC Genomics Workbench 4.6.1 (CLC bio, Aarhus, Denmark) using the same protocol. Global alignments for the de novo assemblies were always done using the following default parameters: mismatch cost=2; insertion cost=3; deletion cost=3; length fraction=0.5; similar-ity=0.8; and randomly assigning the non-specific matches. Best k-mer length was estimated by the soft-ware. The best assembly for each species was selected using an adaptation of the optimality criteria forde novo
assembly with 454 data (see Additional file 3), [38], being the number of contigs, the mean contig length, the N50, the number of contigs greater than 1 Kb, and the maximum contig length, the most relevant criteria utilized.
Sequence annotation
For each species, contigs shorter than 300 bp were removed, as very few of these short contigs retrieved results for Gene Ontology assignments. For example, for
Petrosia ficiformis, 49,246 contigs were shorter than 300 bp, only 22.3% returning blast hits, and only 1.5% of them returning a Gene Ontology ID. The remainder contigs were mapped against a selection of the non-redundant (nr) NCBI database (only proteins of Metazoa and Fungi) using the blastx program of the BLAST suite. All searches were conducted with Blastall [85,86] using an e-value cut-off of 1e-5. With the resulting file, we then used Blast2GO v2.5.0 [87] to retrieve the Gene Ontology (GO) terms and their parents associated with the top 20 BLAST hits for each sequence. Also, using Interproscan tools (http://www.ebi.ac.uk/Tools/pfa/iprs-can/), the hidden Markov models (HMMs) that are present in the PFAM Protein families database were recovered.
Estimating sequence depth
phylogenetic purposes (Table 6). We downloaded three different orthologues of the selected protein targets from several invertebrate species (trying to cover the animal phylogenetic span), and searched them in our transcrip-tomes (using the tblastn engine implemented in CLC Genomics Workbench 4.6.1). We selected only the hits with the maximum similarity (which varied greatly be-tween groups), and checked each open reading frame with ORF finder (http://www.ncbi.nlm.nih.gov/gorf/orfig. cgi). Each predicted protein sequence was re-blasted against the database nr in NCBI using the blastp pro-gram (http://blast.ncbi.nlm.nih.gov/) and the domain structure rechecked with SMART (http://smart.embl-heidelberg.de/) using HMMER, PFAM domain, and in-ternal repeats searching. If two independent genes blasted (in the re-blasting) against the same protein of a metazoan that could not be considered an epibiont or symbiont but most likely our sequenced species, we con-sidered them tentative paralogues. These tentative para-logues were aligned with SEAVIEW 4.3.0 [88] and only those with overlapping regions were taken into account. Then, pairwise comparisons were performed between all the paralogues for the same gene, and only those show-ing more than 20 percent of identity were used. We used the genomes of Amphimedon queenslandica, Lottia gigantea, andCapitella capitata (available in JGI: http:// genome.jgi.doe.gov/genome-projects/) to compare the results obtained using the same strategy searching for the selected genes.
We also estimated the ortholog hit ratio (OHR), as defined by O’Neil et al. [60], which describes the per-centage of an ortholog found in a contig by dividing the number of non-gap characters in the query hit by the length of the subject, using the script of Ewen-Campen et al. [41]. The workflow used to analyze all our tran-scriptomic data is shown in Figure 2.
In addition, to analyze the level of completeness of our datasets (since no reference genome is available for the species selcected), we divided the original sequence files (raw reads) in smaller files containing 5 million reads each, and reassembled all the transcriptomes adding up a file each time. We then measured the number of con-tigs and N50 for each sequential assembly.
Phylogenetic analysis
The discovery of multiple paralogues for several house-keeping genes, which were putatively in single-copy, encouraged us to test whether the different paralogues bore distinct phylogenetic signals. We selected the gene methionine adenosyltransferase, which showed two para-logues for the spongeCrella elegans, the annelid
Hormo-gaster samnitica, and the arthropod Metasiro
americanus (the arthropod Alipes grandidieri also had
two paralogues for the gene, but one of the transcripts
was very short and not suitable for phylogenetic compar-isons). Sequences for sponges and arthropods were downloaded from GenBank (Additional file 10) and in-dependent protein alignments were built for sponges and arthropods using SEAVIEW 4.3.0 [88]. Maximum likelihood analysis was conducted using RAxML ver. 7.2.7 [89] on 20 CPUs of a cluster at Harvard University, FAS Research Computing (odyssey.fas.harvard.edu). For the maximum likelihood searches, a unique WAG model of sequence evolution with corrections for a discrete gamma distribution (WAG + Γ) was specified for each data partition, and 500 independent searches were con-ducted. Nodal support was estimated via the rapid boot-strap algorithm (1000 replicates) using the WAG-CAT model [90]. Bootstrap resampling frequencies were thereafter mapped onto the optimal tree from the inde-pendent searches.
Additional files
Additional file 1:Details of mRNA concentration, cDNA
concentration, library quality, and fragment size of the sequenced fraction of the library for each studied species.
Additional file 2:Assembly parameters for all assembly trials per species.Thinning was performed using 0.05 (Assembly A) and 0.005 (Assembly B) as the limit in CLC Genomics Workbench. The number of bases removed from the 30end after trimming is indicated. Selected assemblies are shown in orange. Abbreviations: N, number; BT, before thinning and trimming; AT, after thinning and trimming; Mb, megabases; bp, base pairs; avg., average; L, length; SD, standard deviation.
Additional file 3:Correlation between read length after trimming in base pairs (bp) and the maximum contig length in bp obtained for each assembly.
Additional file 4:Optimality criteria for the selection of best assembly.
Additional file 5:Coverage values for each transcriptome dataset. Additional file 6:Contigs over 1Kb for each species and the respective percentage (%) of the total number of contigs.N: number.
Additional file 7:Percentage of contigs showing no blast hit (none), blast hits against the NCBI database nr (blast), and Gene Ontology assignments (annot) for each species.
Additional file 8:Number of sequences with Gene Ontology (GO) assignment for defined functional categories in each species. Additional file 9:Plot of the Ortholog Hit Ratio (OHR) for each species. Note the logarithmic nature of the Reference length (x-axis).
Additional file 10:Accession numbers of GenBank (regular font) and Short Read Archive (SRA; in bold letters) for amino acid sequences of the protein Methionine adenosyltransferase.
Competing interests
The authors declare that they have no competing interests.
Authors’contributions