Open Access
Research
A statistical analysis of the three-fold evolution of genomic
compression through frame overlaps in prokaryotes
Fabrizio Lillo
1,2and David C Krakauer*
1Address: 1Santa Fe Institute, 1399 Hyde Park Road, Santa Fe, NM 87501, USA and 2Dipartimento di Fisicae Tecnologie Relative, Università di
Palermo, Viale delle Scienze, I-90128 Palermo, Italy
Email: Fabrizio Lillo - [email protected]; David C Krakauer* - [email protected] * Corresponding author
Abstract
Background: Among microbial genomes, genetic information is frequently compressed, exploiting redundancies in the genetic code in order to store information in overlapping genes. We investigate the length, phase and orientation properties of overlap in 58 prokaryotic species evaluating neutral and selective mechanisms of evolution.
Results: Using a variety of statistical null models we find patterns of compressive coding that can not be explained purely in terms of the selective processes favoring genome minimization or translational coupling. The distribution of overlap lengths follows a fat-tailed distribution, in which a significant proportion of overlaps are in excess of 100 base pairs in length. The phase of overlap – pairing of codon positions in complementary reading frames – is strongly predicted by the translation orientation of each gene. We find that as overlapping genes become longer, they have a tendency to alternate among alternative overlap phases. Some phases seem to reflect codon pairings reducing the probability of non-synonymous substitution. We analyze the lineage-dependent features of overlapping genes by tracing a number of different continuous characters through the prokaryotic phylogeny using squared-change parsimony and observe both clade-specific and species-clade-specific patterns.
Conclusion: Overlapping reading frames preserve in their structure, features relating to mutational origination of new genes, but have undergone modification for both immediate benefits and for variational buffering and amplification. Genomes come under a variety of different mutational and selectional pressures, and the structure of redundancies in overlapping genes can be used to detect these pressures. No single mechanism is able to account for all the variability observed among the set of prokaryotic overlapping genes but a three-fold analysis of evolutionary events provides a more integrative framework.
Reviewers: This article was reviewed by Eugene Koonin, Marten Huynem, and Han Liang.
Background
One of the remarkable discoveries arising from the study of microbial genomes is that a single sequence of nucleic
acid bases can encode multiple different genes in overlap-ping reading frames [1-5]. This represents compression of genetic information, much like the compression of sound
Published: 18 September 2007
Biology Direct 2007, 2:22 doi:10.1186/1745-6150-2-22
Received: 12 July 2007 Accepted: 18 September 2007
This article is available from: http://www.biology-direct.com/content/2/1/22
© 2007 Lillo and Krakauer; licensee BioMed Central Ltd.
or video data in MP3 or MPEG formats [6]. Compression is possible when there are redundancies in a message, and genomic compression minimizes redundancies in a nucleotide sequence by exploiting degeneracies in the assignment rules of the canonical genetic code. A com-mon framework according to which we might understand overlapping genes has not been available, and recent papers have called for some form of unified, evolutionary explanation [7]. In this paper, we analyze length, polarity and phase properties of genetic overlap in prokaryotes adopting a common framework of genome compression [8]. We consider three periods of the evolutionary process starting with the origin of overlap and the subsequent direct and indirect selection pressures acting on overlap length and phase. To clarify the exposition we call these: (1) mutational origins, (2) immediate benefits, and (3) variational benefits.
The mutational origin of overlapping genes typically involves point mutations to stop codons. These lead to the extension of a reading frame over an existing gene produc-ing a genetic palimpsest in which one gene is inscribed above another. Once an overlap has arisen it can either impose a cost in terms of increased mutational sensitivity and regulatory interference [9], it can have no effect and behave as a neutral trait, or confer benefits. Benefits can be either immediate or variational.
The immediate benefits of overlap are features that have a direct impact on the replicative or metabolic efficiency of a genome within a single generation. Immediate benefits are often hypothesized to account for variation in the length of the overlapping sequences. The two immediate benefits of overlap are: (1) that overlapping sequences evolve under a pressure to foster replicative compression thereby increasing the rate of DNA or RNA synthesis for a fixed number of genes, and/or (2) for regulatory compres-sion, reducing the independent regulatory overheads on different genes. In viruses immediate benefits are consid-ered a dominant pressure on genome size and multiple overlapping genes are frequently present, often with genes embedded within genes.
The variational benefits are features that influence the standing, phenotypic variation in the population and thereby modulate the strength of selection on a lineage. These features are intended to account for variation in the overlap phases. The two variational benefits are that: (1) variation in the overlap phase is chiefly to be accounted for in terms of a compensatory alignment of genes leading to a maximum mutational redundancy, or (2) its inverse – aligning overlapping genes in order to encourage greater sequence mutability by promoting multiple amino acid replacements upon a single nucleotide mutation.
All three sets of evolutionary process are tested against data derived from prokaryotic genomes. Previous work on overlap [2,10,11] has stressed sequence polarity and length variability, typically in relation to mutational ori-gins and immediate benefits associated with translation or replication rates. These prior studies tend to emphasize the detailed properties of the overlapping genes in a small sample of species [12,13]. A summary of a few related ear-lier papers is given in Table 1. In this paper we explore the selective implications of statistical regularities in phase diversity, we explicitly introduce statistical, null models against which we compare the data, and we identify the ongoing legacy of mutational origins in established pat-terns of overlap in a large set of prokaryotic genes. A cou-ple of observations that becomes apparent when reading over the many previous studies on this topic are (Table 1) an emphasis on gene regulation in eukaryotes and genome compression in prokaryotes, and (2) a clear divi-sion into those studies focused on the mutational origin of overlap favoring neutral hypotheses, and those focus-ing on ongofocus-ing selection pressures to minimize the muta-tional load of overlap while maximizing the coding potential. Throughout this paper it will be stressed that while these positions can serve as an useful focus for investigation, a full understanding of overlap requires an appreciation of all of these evolutionary processes and their corresponding evolutionary sequence.
1 Mutation, Length and Phase
In this section we introduce several evolutionary processes by briefly stepping through a series of events starting with a random mutation producing an overlap, followed by an immediate benefit of the overlap leading to the fixation the overlapping variant, and the subsequent differential selection acting on overlap phase to satisfy variational constraints.
1.1 Origination
1.2 Minimization
Once overlap is established in a single genome it must fix in a population. Fixation can be neutral or selective. Immediate selective benefits can arise through both more efficient regulation and increased rates of replication [8,9,11,17]. In replicative compression, the total genome length is minimized by increasing the number of overlap-ping genes without loss of protein function. All else being equal, overlap can lead to an increase in the rate of repli-cation by reducing the number of bases that need to be synthesized. For a constant per base per genome mutation rate, reducing genome size also reduces the mutation load which is an important factor in promoting fixation of genomes reduced through deletion events [18]. Having said this, in some cases maximal growth rates become independent of genome size suggesting alternative rate limiting reactions [19]. Regulatory compression works in two ways, both of which eliminate the need for independ-ent transcription of genes. One mechanism, which applies to overlapping genes in an operon, is co-translation. Co-translation renders the Co-translation of a distal gene dependent on the prior translation of an upstream gene [20,2]. Co-translation can increase the rate of protein syn-thesis and ensures a strict stoichiometry among gene products. In the second mechanism, overlapping genes are alternately translated through infrequent ribosomal frame-shifts of a single mRNA transcript. Each frameshift favors one polycistronic gene over another [22].
1.3 Phase modification
One consequence of the triplet code, is that overlapping sequences can overlap in different translational phases – the incidence of codon position pairings between genes. For example, codon position 1 of gene 1 overlaps with codon position 3 of gene 2 [9,10]. The evolutionary stabil-ity of variation in overlap phase can not be explained sim-ply in terms of increased translation or replication rates within individuals, as these are largely insensitive to phase. Phase is a "variational property" meaning that it does not contribute directly to organismal replication rates within one generation, but indirectly, by modulating the phenotypic effects of point mutations on descendant sequence variability. In addition to phase differences stemming from neutral mutations, we consider the varia-tional principles of redundancy [23] and amplification [24] in explaining phase variation in overlapping genes.
Redundancy describes the ability of overlapping sequences to minimize non-synonymous substitutions at the level of two or more proteins encoded by a single over-lapping sequence. Whereas overlap can increase rates of replication, it is also expected to increase mutation load by increasing the number of amino acid substitutions for a single base pair mutation. Overlapping sequences can compensate for this sensitivity by pairing degenerate codon positions with non-degenerate codon positions through a suitable choice of phase.
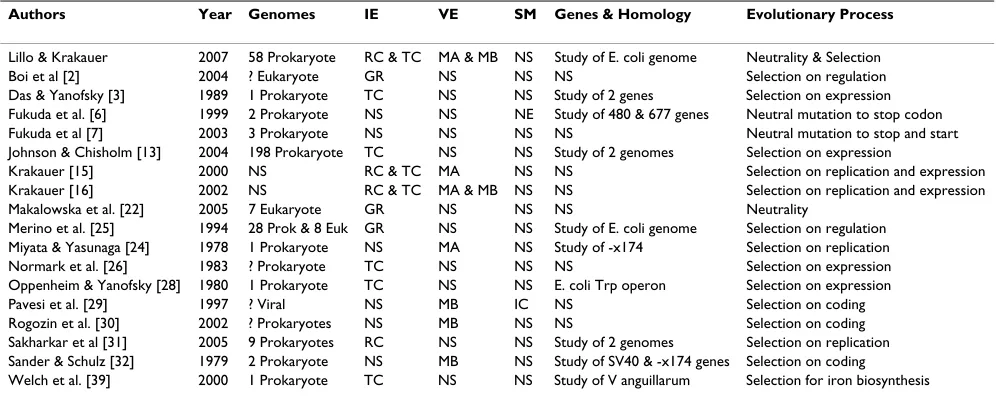
Table 1: A few representative studies on overlapping genes, organized alphabetically with summary of principle conclusions and data type
Authors Year Genomes IE VE SM Genes & Homology Evolutionary Process
Lillo & Krakauer 2007 58 Prokaryote RC & TC MA & MB NS Study of E. coli genome Neutrality & Selection
Boi et al [2] 2004 ? Eukaryote GR NS NS NS Selection on regulation
Das & Yanofsky [3] 1989 1 Prokaryote TC NS NS Study of 2 genes Selection on expression Fukuda et al. [6] 1999 2 Prokaryote NS NS NE Study of 480 & 677 genes Neutral mutation to stop codon
Fukuda et al [7] 2003 3 Prokaryote NS NS NS NS Neutral mutation to stop and start
Johnson & Chisholm [13] 2004 198 Prokaryote TC NS NS Study of 2 genomes Selection on expression
Krakauer [15] 2000 NS RC & TC MA NS NS Selection on replication and expression
Krakauer [16] 2002 NS RC & TC MA & MB NS NS Selection on replication and expression
Makalowska et al. [22] 2005 7 Eukaryote GR NS NS NS Neutrality
Merino et al. [25] 1994 28 Prok & 8 Euk GR NS NS Study of E. coli genome Selection on regulation Miyata & Yasunaga [24] 1978 1 Prokaryote NS MA NS Study of -x174 Selection on replication
Normark et al. [26] 1983 ? Prokaryote TC NS NS NS Selection on expression
Oppenheim & Yanofsky [28] 1980 1 Prokaryote TC NS NS E. coli Trp operon Selection on expression
Pavesi et al. [29] 1997 ? Viral NS MB IC NS Selection on coding
Rogozin et al. [30] 2002 ? Prokaryotes NS MB NS NS Selection on coding
Sakharkar et al [31] 2005 9 Prokaryotes RC NS NS Study of 2 genomes Selection on replication Sander & Schulz [32] 1979 2 Prokaryote NS MB NS Study of SV40 & -x174 genes Selection on coding Welch et al. [39] 2000 1 Prokaryote TC NS NS Study of V anguillarum Selection for iron biosynthesis
Amplification or increased "mutational effect", relates to increased protein polymorphism following mutations to genes occupying certain phases of overlap. Amplification is achieved by pairing non-degenerate codon positions of two or more overlapping sequences, thereby maximizing the probability of non-synonymous substitutions. Another way to think about overlap phase is that it behaves analogously to 'adaptive-mutation' in prokaryo-tes [25], whereby genes experience different effective raprokaryo-tes of amino acid substitution by virtue of differential overlap phase [26].
1.4 A multi-step process
As the foregoing paragraphs have suggested, patterns of overlap are difficult to interpret, as at least three different mechanisms can be adduced for extant patterns of diver-sity: mutations leading to overlap with neutral effects and slow fixation rates, selective benefits accruing through replicative and regulatory minimization leading to rapid fixation, and indirect selective benefits associated with increased or reduced standing variation through changes in phase. In this paper we shall endeavor to tease apart these contributions, bearing in mind that they are all likely to play an enduring role.
2 Methods
We analyze 58 different species of prokaryotes whose genomes have been completely sequenced (See Figure 1) We selected the species (and the corresponding strains) that are included in the COG (Clusters of Orthologous Groups of proteins) database [27,28]. Each COG consists of individual proteins or groups of paralogs from at least 3 lineages and thus corresponds to an ancient conserved domain. We have analyzed all bacterial species available at the COG database except Mycobacterium leprae, because it is known that in this genome less than half of the genome contains functional genes and pseudogenes are abundant. For species, such as E. coli, for which more strains are annotated we selected only one of them to avoid duplicates. It is worth noting that by repeating the analysis for a larger set of 83 species and by including all the genes in the annotation, our results do not change sig-nificantly. While the use of the COGs database reduces the false positive rate in our analysis, we do not have access to the ribosomal binding sites for all overlapping genes, which would further increase our confidence.
In our dataset there are 13 Archaea (10 Euryarchaeota and 3 Crenarchaeota) and 45 Bacteria. The length of genomes range from 580 kbp to 7 Mbp. A scatter plot of the number of genes plotted against the genome length shows a good linear relation (R2 = 0.98), with a density of one gene per
1130 bp. The proportion of noncoding material in the genome is around 13%, with extremal values of 6% ( Ther-motoga maritima) and 26% (Methanosarcina acetivorans).
There is no evident difference in these two properties between Archaea and Bacteria.
In the following we consider only overlapping sequences between two (or more) genes that are both annotated as belonging to one COG. In this way we minimize the inci-dence of annotation errors. On average 76% (min = 58%, max = 99%) of the annotated genes are annotated as belonging to one COG. This makes our analysis represent-ative of the behavior of genes in the genome. For increased confidence we have repeated our analysis for a more restrictive subset. We include in the restricted set only those overlapping sequences that are conserved in two or more species. A sequence is conserved in two genomes if in the two species the overlap is created by two pairs of genes belonging to the same COGs. We have found that our results are replicated when using this restricted data-set.
An overlapping sequence is a portion of the genome that encodes some part of two or more protein coding genes. We do not include in our analysis pairs of genes in which one of the two genes is completely contained (embedded) within the other. The number of overlapping sequences is relatively high when compared to the total number of genes in the genome. The mean number of genes involved in at least one overlap is 27% with extremal values 8% (Nostoc sp.) and 56% (Aquifex aeolicus and Thermotoga mar-itima). As a consequence, in prokaryote genomes a signif-icant proportion of genes have an overlapping sequence. Top panel of Figure 2 shows a scatter plot of the number of overlaps versus the total number of overlapping bases. A linear fit on the data gives an estimate of the mean length of the overlapping sequences equal to ⯝26 bp (cor-relation coefficient U= 0.82, p = 10-15).
3 Results and Discussion
3.1 Length and Strand Statistics
Replicative benefits predict negative correlations among the frequency of overlapping sequences, the genome length and the noncoding DNA. The observation that
Thermotoga maritima possesses both the genome with the smallest fraction of noncoding DNA and the largest
frac-tion of genes involved in an overlap, suggests that a repli-cative compression argument might explain the variation in overlapping sequences in our database. In other words, a bacterium for which a short genome is important is expected to have a small fraction of noncoding DNA and
Supertree of 58 prokaryotic species with principal clades indicated
Figure 1
a high fraction of overlapping genes. We are, in resorting to this hypothesis, for simplicity assuming that noncod-ing DNA is not carrynoncod-ing adaptive information and that a genome can experience a reduction in the noncoding por-tion without significantly influencing funcpor-tion.
We test this hypothesis by plotting in the top panel of Fig. 3 the fraction of genes involved in an overlap against the percentage of noncoding DNA. Each species is repre-sented by a single strain and we do not correct for
phylog-eny. This is largely because not all species in the data set are well time-resolved and in addition we have no com-pelling model of genetic substitution within overlapping genes. Parsimony might be an acceptable first approxima-tion, but without an exhaustive empirical study this remains conjectural. We do however, use parsimony to trace more coarse-grained features of overlapping genes, such as phase, in subsequent sections. The fraction of genes are here defined as the number of genes annotated as COG and involved in at least one overlap divided by the total number of genes annotated as COG. A statisti-cally significant anticorrelation (U = 0.53, p = 10-5) is
found indicating that when genome compression is important the overlap is high and the noncoding fraction is low (and vice-versa).
A smaller but statistically significant correlation (U = -0.33, p = 0.01) is observed between the fraction of genes involved in an overlap and total genome length (see bot-tom panel of Fig. 3). Here we reason that selective pres-sures for increased compression are favored in shorter genomes (in absolute terms), and hence the observed neg-ative correlation between the genome length and overlap frequency. Of course, organisms cannot completely mini-mize their genomes as they need to retain the ability to synthesize essential proteins. This requirement establishes a lower bound on the correlation. Finally we observe a correlation coefficient of 0.32 between the fraction of noncoding genomes and the genome length (plot not shown).
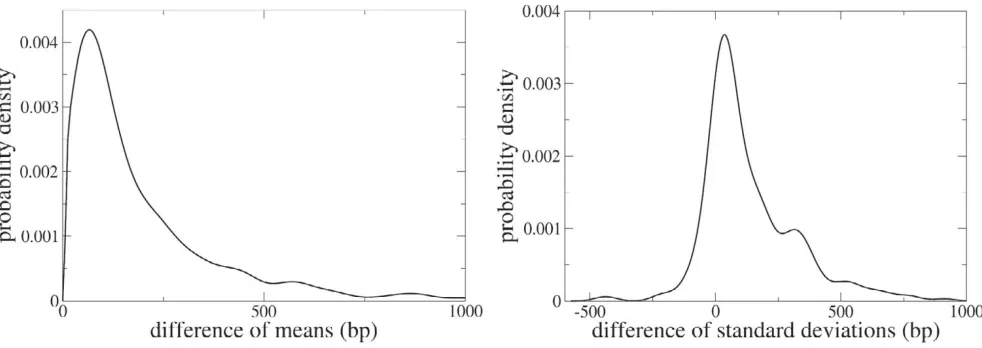
An additional way to investigate whether selection pres-sures for compression favor overlap is to compare the length of the overlapping genes to their orthologues which do not overlap. Under the hypothesis that a shorter genome is favored by selection one might expect that overlapping genes are shorter than their orthologues that do not overlap. For each of the 5412 COGs we extract all of the genes from the 58 genomes belonging to one COG and we divide this collection in two subsets, one contain-ing those genes that contribute to an overlap and the other containing the orthologous genes that are not involved in any overlap. We then perform a t test with the null hypothesis that the mean length of the genes in the two subsets is equal. The requirement that there are at least two genes in both subsets decreases the number of COGs to 2059. For 290 (14.1%) COGs one must reject the null hypothesis that the two means are equal within 95% con-fidence. In all of these cases the mean gene length of the subset of overlapping genes is shorter than the mean gene length of the complement of orthologous, non-overlap-ping genes. The difference between mean gene length in the two subsets is quite large. The left panel of Fig. 4 shows the distribution of the differences between the mean sequence lengths in the two subsets. On average,
overlap-Top. Scatter plot of the number of overlapping sequences versus the total number of overlapping bases for the 58 investigated genomes
Figure 2
ping genes are 220 bp shorter than their orthologues that do not overlap (the median value of the difference is 110 bp). The distribution of the differences between the stand-ard deviations in lengths is fairly asymmetric. The right panel of Fig. 4 shows the distribution of the differences of the standard deviations in the two subsets. The distribu-tion has more mass for positive values indicating that the sequence length of overlapping genes has a smaller dis-persion than the sequence length of orthologous genes that do not overlap.
The hypothesis of immediate regulatory benefits requires that overlaps should preferentially be found on the same strand and be short. Given a pair of consecutive genes in a prokaryotic circular genome, they can occupy four pos-sible orientations. When the two genes are in the normal
strand or both are in the complementary strand (we call them codirectional), when the first is in the normal strand and the second in the complementary strand (conver-gent), and finally when the first is in the complementary strand and the second in the normal strand (divergent). If the two genes are overlapping, each of the 3 different con-figurations leads to a distinct type of overlapping sequences. The arrows inside the panels of Figure 5 give a graphical representation of the different overlap types.
We have investigated the joint probability of finding a pair of consecutive genes (not necessarily overlapping) in one of the three orientations described above. This prop-erty will prove to be important serving as a null hypothe-sis for comparison with the distribution of configurations of overlapping sequences. In a circular genome the number of convergent gene pairs needs to be exactly equal to the number of divergent gene pairs. In a linear genome one of the two can be at most larger than the other by one. Since the number of genes is quite large (of the order of thousands of genes) the percentage of convergent pairs is approximately equal to the percentage of divergent pairs.
For the full set of 58 species the percentage of codirec-tional sequences is larger than 50%. As has been observed in prior studies, this probably reflects the advantage of having genes in the same strand in order to coordinate the regulation of genes in operons [2]. Archaea have on aver-age a smaller fraction of consecutive genes on the same strand when compared to Bacteria (see below the discus-sion of Figure 5). The differences between Archaea and Bacteria are probably related to the reduced incidence of operons in Archaea. In many prokaryotic species the per-centage of codirectional sequences in the normal strand is close to the percentage of codirectional sequences in the complementary strand, indicating the absence of a func-tional preference for either one of the two strands [17].
We now compare the empirical frequencies of the differ-ent configurations of consecutive genes with the distribu-tion of configuradistribu-tions for overlapping genes. Clearly there are 3 configurations of overlapping genes depending on the orientation of the two genes involved in the overlap. We will make use of the same terms, codirectional, con-vergent, and dicon-vergent, to indicate different configura-tions of overlapping genes. Figure 5 shows the percentage of the 3 configurations of overlapping genes in the 58 genomes versus the percentage of consecutive (non neces-sary overlapping) genes of the same type.
Assuming that the occurrence of an overlapping sequence was equally efficient in terms of the compression of infor-mation for the three possible configurations, one might expect that the probabilities for the 3 configurations of overlapping sequences were approximately equal to the
Top. Scatter plot of the fraction of genes involved in (at least) an overlap versus the fraction of noncoding genome
Figure 3
probabilities for the 3 configurations of non-overlapping, paired genes. Figure 5 indicates that this is not the case. In fact, in the vast majority of cases, divergent overlapping genes are strongly underrepresented. Moreover, the con-vergent overlapping sequences are more common in Archaea (but also in the Chlamydiae and Cyanobacteriae) than in most Bacteria. The under representation of diver-gent overlapping sequences is probably the result of the necessity of encoding regulatory elements in the upstream region of genes for this configuration [17].
We test the null hypothesis that the configurations of overlapping sequences are distributed identically to the configurations of consecutive genes. In 53 cases the F2 test
rejects the null hypothesis with 99% confidence. The 5 prokaryotes for which the null hypothesis cannot be rejected are Halobacterium (Archaea), Mycoplasma pene-trans, Ureaplasma urealyticum (Firmicutes), Buchnera aphidicola, (Proteobacteria bacteria), Treponema pallidum
(Spirochaetes). In summary the analysis of the frequen-cies of overlap configurations lends support to the imme-diate regulatory hypothesis.
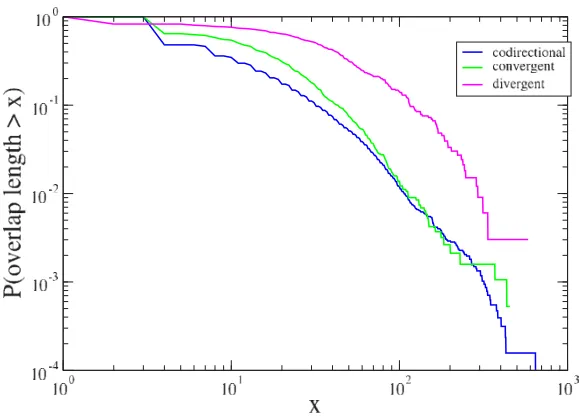
The second prediction of the immediate regulatory benefit hypothesis is that overlapping sequence should be short. The inset of the bottom panel of Figure 2 shows that, even if long sequences are frequently observed, the modal over-lap length is 4 bp. This result can be better appreciated if one considers the overlap length distribution for the three different configurations discussed above. Figure 6 shows the cumulative density function of the length of the 3 types of overlapping genes. The figure indicates that
codi-rectional and convergent overlapping sequences are simi-larly distributed, whereas the divergent sequences, that constitute a small fraction of the total overlapping sequences (see Fig. 5), are distributed in a different way.
A closer inspection of Fig. 6 illustrates the presence of dis-continuities in the cumulative density functions at x = 4 for codirectional and convergent overlapping sequences. These jumps are a result of overlapping sequences of length 4 with a start (ATG) and a stop (TAA, TAG and TGA) codon. For the codirectional overlapping sequences, the tetramer ATGA contains the stop codon (TGA) of the first gene and the start codon (ATG) of the second gene. For convergent overlapping sequences, four tetramers CTAA, TTAA, CTAG, and TTAG are consistent with the ter-mination of the two genes in opposite strands. Thus the abundance of short overlaps, and specifically those on the same strand and of length 4 bp, is an indication that reg-ulatory genomic compression is a key factor in promoting short overlapping sequences.
Assuming that overlapping genes provide immediate reg-ulatory benefits (for example when there is a short codi-rectional overlap) they can also create new challenges for the regulation of gene expression. Consider the case of convergent overlapping genes. One important mecha-nism of transcriptional termination in Prokaryotes is rho-independent termination. The signal for termination is a stable hairpin followed by a U-rich sequence. For E. coli
approximately half of the transcriptional units are thought to be terminated by a rho-independent termina-tor [31]. For genes involved in a convergent overlap, the
Left. Distribution of the differences between the mean sequence length of the overlapping genes and the mean sequence length of their orthologues that do not overlap
Figure 4
rho-independent terminators must be present in the cod-ing sequence of one of the overlappcod-ing genes. With this constraint one might expect that the genes participating in convergent overlaps rarely make use of rho-independent motifs. We investigate this in the E. coli genome where 58 convergent overlaps are observed. We extract those genes that have a putative rho-independent terminator among those descibed in Ref. [31]. Somewhat surprisingly we find that in 19 overlaps one of the two genes makes use of a rho-independent terminator and in 2 overlaps, both genes have two (different) rho-independent terminators. In total only 23 (20%) of the 116 convergent overlapping genes have a rho-terminator. These results suggest that selection often succeeds in creating compressed sequences with dual coding and regulatory properties.
3.1.1 Phylogenetic patterns in abundance statistics
Using squared-change parsimony ([32]) we have traced the total number of overlaps, in addition to the number of co-directional, convergent and divergent overlapping genes through the consensus Prokaryotic phylogeny illus-trated in Figure 1. The results are shown in figure 7 where the color coding relates the numerical values as indicated in the accompanying color-scales. When it comes to the total number of overlaps there is no outstanding clade-level regularity other than the appearance of an elevated number of overlaps in the proteobacterial clades, the cre-narchaeota and the euryarchaeota. Interestingly, based on the wide distribution of abundant overlaps over the tips of the tree, many of the more ancestral groups would seem to have possessed a higher than average number of over-lapping genes than their descendants. Derived reduction in overlap is most pronounced in the firmicutes which
Percentage of overlapping genes in a given configuration (codirectional (a), convergent (b), divergent (c), see text) versus the percentage of consecutive genes in the same configurations to include non-overlapping genes
Figure 5
possess a below average number of overlapping genes. Co-directional overlaps are fairly abundant across most species (other than the firmicutes), whereas convergent and divergent overlaps are restricted from most clades and are most common in the crenarchaeota and euryarchae-ota. Exceptions to this pattern are found for the alpha-pro-teobacteria, where a few species, most notably the
Caulobacter sp. shows a substantial, derived increase in the abundance of both convergent and divergent overlapping genes.
3.2 Phase Statistics
In order to test for variational benefits, above and beyond biases resulting from mutation, we investigate the statisti-cal properties of different phases in which a given overlap can be found. For each configuration of overlapping sequence there are three possible phases, that is, ways of placing codon positions coupled to one another. Depend-ing on which codon positions are complementary in an overlap, the effect of DNA mutations on the two genes can be different. We make use of the following notation for the different phases [17]. For codirectional overlaps we shall indicate the three phases as (123:123), (123:231), (123:312), depending on whether the first codon base of the first gene is also the first, second, or third codon base of the second gene. We use the same notation for codirec-tional sequences both in the normal and in the comple-mentary strand, although the orientation of the two genes is opposite in the two cases. For overlapping genes of type
convergent and divergent the three phases are (123:321), (123:132), and (123:213). As in the previous section we do not include embedded genes in order to avoid ambigu-ities. For each type of overlap, we compute the percentage of overlaps in each phase. Table 2 shows the result of this analysis. Before commenting on this table, recall that many overlaps have a length equal to 4, as a result of a match between start and stop codons or between two stop codons in complementary strands (see Fig. 6). In Table 3 we have repeated the analysis of the different phases by restricting the analysis to overlaps longer than 4 nucle-otides. The comparison of Tables 2 and 3 illustrates the importance of excluding overlaps of length 4 bp from this analysis, as their high incidence biases the relative phase frequencies. Moreover, we find an inversion of phase occurrence in codirectional overlaps in Firmicutes as a consequence of the reduced occurrence of overlaps of length 4 in species belonging to this clade.
For codirectional overlapping genes longer than 4 bp the empirical analysis suggests that (i) there are essentially no overlaps of phase (123:123). This is reasonable as the stop codon of the first gene is translated in frame through the second gene and this would lead to a premature termina-tion of transcriptermina-tion of the second gene. (ii) The phase (123:231) is less frequent than the (123:312) phase. This is true on average (Table 3) but it is also systematically true for all the genomes. This result is quite surprising as these two phases are in some sense indistinguishable from
Cumulative density function of the length of the 3 configurations of overlapping sequences in our dataset
Figure 6
Cumulative density function of the length of the 3 configurations of overlapping sequences in our dataset. The color code is blue for codirectional (12, 737 sequences), green for convergent (1, 890 sequences), and magenta for divergent (331
The overlapping phase relations traced through the prokaryotic phylogeny using squared-change parsimony and color-coded in each of the 4 trees
Figure 7
the statistical perspective of the distribution of paired nucleotides. In both phases a first nucleotide comple-ments a third nucleotide, a first complecomple-ments a second nucleotide, and the remaining pair comprises a second and a third nucleotide.
For overlapping genes on different strands (type conver-gent and diverconver-gent) we observe two different patterns. Convergent sequences are more frequently observed in the phase (123:132) whereas divergent sequences are more frequent in phase (123:213). It is worth noting at this point that the phase frequencies indicated in Table 2 and 3 are also observed when we restrict the analysis to those overlapping sequences shared by at least two spe-cies.
We now consider phase preference as a function of over-lap length. We have analyzed the distribution of overover-lap lengths, investigating independently different phases of overlap. In the right panel of Figure 8 we show the histo-gram of the number of occurrences of different phases of overlap as a function of overlap length. Since fluctuations in the histogram are large, we investigate overlap length distribution for alternative phases using a different method. Specifically in the right panel of figure 8 we plot the quantity p(f|ᐍ > x), the probability of observing one of
the three phases f1, f2, and f3 in an overlap of a configura-tion (codirecconfigura-tional, convergent, and divergent) condi-tioned on the constraint that the overlap is longer than x
base pairs. The three phases are plotted relative to their configuration through a normalization for each value of x, i.e. p(f1|ᐍ > x) + p(f2|ᐍ > x) + p(f3|ᐍ > x) = 1. Interestingly, the curves for the codirectional overlapping sequences display a crossing at length ~75 base pairs. There are more than 300 codirectional sequences longer than 75 bp. For sequences shorter than this value the phase (123:312) is more frequent than the phase (123:231), whereas for longer sequences the order is reversed. Similarly for con-vergent sequences the conditional frequencies tend to equality for very large overlap. Finally for divergent over-laps, no crossing is observed.
3.2.1 Phylogenetic patterns in phase statistics
In the preceding section we found that phase is strongly dependent on the polarity of transcription of the overlap-ping genes. We also observe a phylogenetic determinant (see Fig. 9). Among those species possessing co-direc-tional overlap phase (123:231) the firmicutes and cyano-bacteria are rare. Members of the Archaeota and Proteobacteria are better represented. For overlap phase (123:312) there are many firmicutes. There are very few species of any clade possessing phase (123:123). For con-vergent overlap the Archeaota are the most abundantly represented clade for both (123:132) and (123:321) phases. The two species, Aquifex aeolicus and Thermotoga maritima also possess a high frequency of genes in these two phases. The species Pseudomonas aeruginosa has a very high abundance of phase (123:213). Among the remain-ing clades only a few cyanobacteria show evidence of a convergent overlap above the prokaryotic average. For divergent overlaps the pattern is very similar to the con-vergent case with only a few species behaving contrary to their clade, in particular Mycobacterium tuberculosis has an elevated frequency of (123:213) in comparison to the Actinobacteria, whereas Caulobacter crescentus is elevated in (123:321) in comparison to the remaining Alpha-pro-teobacteria. Overall, co-directional overlap would seem to be a more ancestral form of organization than convergent and divergent where we find a larger number of unique derived instances in the species distribution.
4 The 3-fold evolutionary dynamic
Microbes are distinguished by their enormous abundance and by the rapid rate at which they replicate. Both of these features make demands on the organization and regula-tion of the genome. Competiregula-tion in large popularegula-tion sizes typically selects for fast and efficient replication and this in turn requires that protein synthesis is rapid and low cost. One very general mechanism for propagating infor-mation at a high rate is data compression, a technique indispensable in computer technology, whereby
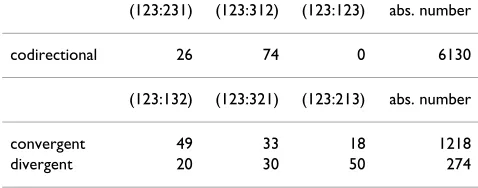
redun-Table 3: Percentage of occurrence of different phases of overlap in prokaryotes conditioned to the fact that the overlap is longer or equal to 5 nucleotides. Each line refers to a different type of overlap (codirectional, convergent, and divergent). The last column shows the total number of occurencies for each overlap type.
(123:231) (123:312) (123:123) abs. number
codirectional 26 74 0 6130
(123:132) (123:321) (123:213) abs. number
convergent 49 33 18 1218
divergent 20 30 50 274
Table 2: Percentage of occurrence of different phases of overlap in Prokaryotes. Each line refers to a different type of overlap (codirectional, convergent, and divergent). The last column shows the total number of occurences for each overlap type.
(123:231) (123:312) (123:123) abs. number
codirectional 64 36 0 12737
(123:132) (123:321) (123:213) abs. number
convergent 32 21 47 1890
dancies in a body of information are minimized and where common messages are given short description lengths [6]. In this study we have analysed an evolved form of data compression, namely, the properties of over-lapping genes in a large set of 58 fully sequenced prokary-otic genomes. Both prokaryotes and phage are known to exploit overlap extensively [11]. We have organized our research into three sets of evolutionary questions. First: how do overlaps come about and by what mutational process, and how do these mutations bias the conserved overlap lengths and phases that we observe in the data-base? Second: for highly conserved patterns of overlap shared by multiple lineages, how can we explain regular patterns in the data accruing through immediate benefits to an individual genome? Third: among those patterns of overlap that do not relate to immediate benefits (rates of replication or expression) but do have implications for population variability, is the data consistent with neutral-ity, redundancy or amplification?
4.1 Stochastic Origination
We corroborate earlier studies showing that the modal number of overlapping nucleotides is equal to 4 and that these 4 nucleotides frequently overlap initiation and ter-mination codons of contiguous genes, or the terter-mination codons of complementary overlaps. This suggests that neutral point mutation is an important mechanism for promoting overlapping genes. We directly test the stop codon mutation (SCM) mechanism by performing a detailed case study of Escherichia coli overlapping sequences.
The SCM mechanism promotes the formation of an over-lap through a single nucleotide mutation within a stop codon. Consider two consecutive, non-overlapping genes in the same or in complementary strands. The stop codon of one of the two genes mutates (or is deleted) and this leads to a read-through until a new stop codon is encoun-tered in the down-stream gene creating a sequence of overlap. Let us assume as a null hypothesis that the func-tion of the new gene is not altered by the elongafunc-tion of the first sequence. Can we estimate the expected length and phase properties of the overlap? The probability that the overlap length is longer than x codons, i.e. y = 3x nucle-otides, is equal to the probability that all x codons encountered in the read-through are different from a stop codon. We indicate with p the probability that a codon is different from a stop codon, and we conclude that p( over-lap length > 3x) = px i.e.
where yc { -3/ln(p). This argument illustrates that one
might expect from this simple model an exponential dis-tribution of overlap lengths. This is not observed in our data. In Figure 2 we illustrate the empirical overlap length distribution and the best fit of the distribution to an expo-nential function exp(-ax) with the same mean. The dis-crepancy between the two curves indicates that either the SCM is not the only mutational mechanism generating
p overlap length y py e e
y p
y yc
( > )= /3 = 3ln ≡ − /
(1)
Left figure shows the histogram of the number of occurrences of the three phases in the overlap of a given type as a function of the overlap length
Figure 8
The overlapping phase relations traced through the Prokaryotic phylogeny and color-coded in each of the 9 trees are as fol-lows: A: codirectional overlaps in phase (123:231), B: codirectional overlaps in phase (123:312), C: codirectional overlaps in phase (123:123), D: convergent overlaps in phase (123:213), E: convergent overlaps in phase (123:132), F: convergent overlaps in phase (123:321), G: divergent overlaps in phase (123:132), H: divergent overlaps in phase (123:213), I: divergent overlaps in phase (123:321)
Figure 9
sequences or that some additional selective processes have filtered the variation.
The SCM mechanism also makes predictions about the expected distribution of overlap phases generated by a stop mutation. As a result of the bias in the codon distri-bution of a species, it is more likely that the read-through process finds a new stop codon in some phases over oth-ers. Consider two codirectional genes in an E. coli genome and further suppose that the stop codon of an upstream gene mutates with the read-through continuing until a new stop codon is encountered in the downstream gene. In E. coli there are three stop codons, TAA, TAG and TGA. We indicate with P(XYZ) the empirical frequency of a codon XYZ. By assuming that consecutive codons behave independently, the probability of finding a stop codon in a given phase can be calculated. For example, the proba-bility of finding TGA in phase (123:312) is calculated via the sum:
The predicted probabilities are shown in Table 4.
Table 4 shows the frequencies of the observed phases of overlapping sequences for E. coli and the expected fre-quencies according to the SCM mechanisms. For codirec-tional overlapping genes we find that sequences longer than 5 bp in phase (123:231) comprise 32% and phase (123:312) 68%. The SCM mechanism predicts approxi-mately equal frequencies for the two phases (54% and 46%, respectively). This discrepancy suggests that the stop mutation mechanism cannot be the only mechanism pro-moting overlapping sequences in the same strand. In Fig-ure 8 we observe that short sequences on the same strand are more frequent in (123:312) phase, whereas long sequences are more frequent in (123:231) phase. Table 4 suggests that long sequences on the same strand are more likely to be generated by the SCM mechanism.
The origin of convergent sequences can be tested only with the SCM mechanism for which a simple statistical model can be derived. Table 4 shows a good agreement between the observed and the expected frequencies,
sug-gesting that SCM is the most common mechanism gener-ating this type of overlapping sequence. This result is in agreement with [33] where the convergent sequences of
Mycoplasma appear to be generated by a stop mutation mechanism.
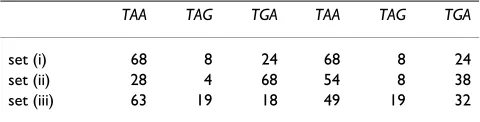
A related question is whether the usage of stop codons is the same for overlapping and non-overlapping genes. To this end we have divided the set of genes into three sub-sets: (i) Genes with a 3' end not involved inn the overlap (but where the 5' end can be overlapping). (ii) Genes with a 3' end involved in a codirectional overlap (where the gene is upstream of the overlap). (iii) Genes with a 3' end involved in a convergent overlap. We then counted the total number of the three different stop codons for the three subsets. The left part of Table 5 shows the fraction of genes in the three subsets for E. coli. It is evident that the usage is quite different in the different sets. Part of this dif-ference could be a direct result of short overlaps. For example in set (ii) (codirectional overlaps), TGA could favored through a matching of stop and start codon at the ATGA tetramer. Table 5 set (ii) has a percentage of TGA of 68% compared to the 24% for non overlapping genes. To take into account this bias we now only consider overlaps longer than 4 bp where a matching of start and stop codons is excluded. The right part of Table 5 shows the fre-quencies in this restricted set. The stop codon usage is now more similar for across the sets.
In order to determine the statistical significance of the observed differences in stop codon usage for each genome we perform F2 tests. Specifically we took take (i) as a
refer-ence and tested whether set (ii) and set (iii) have the same distribution of stop codon usage as set (i). We independ-ently analyze the set including all possible overlap lengths from the set of overlaps longer than 4 bp. From the 58 genomes we are able to perform the test on at most 52 because the remaining 6 bacteria use only 2 different stop codons. We adopt a 99% confidence for significance. When we consider the set of all possible overlap lengths we find that for 98% of the genomes (51/52) we are reject the hypothesis that set (ii) has an equal stop codon distri-bution as set (i) and for 48% (19/40) genomes we reject the hypothesis that set (iii) has an equal stop codon usage as set (i). For the set of overlaps longer than 4 bp we find
P XTG P AYZ
Y Z A C G T X A C G T
( ) ( ).
, , , ,
, , , ∈
∈
∑
∑
(2)Table 4: Percentage of occurrence of different phases of overlap in E. coli. The table includes the percentage of observed overlap longer than 4 bp in different orientations and phases and compares these empirical values with the percentages expected by the stop codon mutation hypothesis (SCM).
codirectional convergent
(123:231) (123:312) (123:123) (123:132) (123:321) (123:213)
observed 32 68 0 46 32 22
that for 65% (34/52) of the genomes we reject the hypoth-esis that set (ii) has an equal stop codon distribution to set (i) and for 35% (13/37) genomes we reject the hypothesis that set (iii) has an equal stop codon usage to set (i).
In conclusion, when taking into account genome individ-uality and possible biases introduced by a coupling between start and stop (or two stop) codons, we find that stop codon usage is different for overlapping and non overlapping genes. This effect is stronger for codirectional than for convergent genes. This difference could provide some useful insights into the the origin of overlapping genes.
4.2 Immediate Benefits
While stochastic processes involving mutation and frame-shifts can explain some of the variation in the data, they are not able to explain certain widespread, conserved fea-tures. We observe that short overlapping genes frequently arise on the same strand, presumably to encourage trans-lational coupling among coregulated genes in an operon. We also find long overlaps in complementary strands, which would serve to reduce the number of nucleotides required to encode two or more proteins.
In prokaryotes genomes, around 30% of all genes are involved in some degree of overlap, reaching an extreme value of 56% in the species Aquifex aeolicus and
Thermo-toga maritima. The mean length of the overlapping
sequences is 26 base pairs, whereas the modal value is 4 base pairs. These 4 base pairs can occur as overlaps on a single strand in which case the termination and initiation codons overlap, or in complementary strands in which case complementary termination codons overlap. We find that a greater proportion of overlaps are in a single strand. These observations argue in favor of overlap promoting regulatory compression within co-regulated gene com-plexes of a strand, in particular within operons. This is the position advocated in recent research [10] emphasizing the high frequency of 4 nucleotide overlaps. Regulatory compression is achieved by having the overlapping sequence play a dual termination and initiation role, and eliminates the time delay associated with the initiation phase of protein synthesis by promoting translational coupling [34,20]. Futhermore, the importance of
regula-tion in overlap is suggested by the observaregula-tion that the least frequent of the overlapping configurations is diver-gent, in which the 5' upstream portion of each gene is overlaping and the 3' downstream portion non-overlap-ping. This configuration potentially places both the Shine-Delgarno motif and the initiation codon in the overlap-ping portion of the sequence. Since both of these require specific motifs, they constrain the evolution of their com-plementary genes in the overlap. In the non-overlapping paired gene control, convergent and divergent are indis-tinguishable. Thus regulatory elements constrain the pref-ered overlapping configurations. An additional observation is that convergent and divergent overlaps are both more frequent in the Archaea than in the Bacteria, whereas in the non-overlapping controls these domains (or superkingdoms) are indistinguishable. Recent results suggest an additional form of regulation, whereby over-lapping genes in complementary strands are capable of reciprocal regulation through formation of complemen-tary anti-sense transcripts in prokaryotes [5] and also somewhat surprisingly in eukaryotes [7] and vertebrates [21].
While these data corroborate an important function and constraint on overlap derived from regulatory considera-tions, we also find evidence for replicative compression. Long overlapping sequences occur frequently (the mean overlap length is significantly larger than the mode), and very often appear on complementary strands which are independently regulated. The importance of replicatory compression is further supported by the fact that the shorter genomes also have a higher proportion of overlap-ping genes and a reduced fraction of non coding DNA. Shorter genomes also possess a greater proportion of over-lapping genes of shorter length than their non-overlap-ping orthologues (Figure 4). The tendency of organelle and microbial genomes to eliminate all extraneous nucle-otide material has been termed genomic reduction, and is well documented in mitochondria and virus genomes where pressures on replication rates are at a premium [35]. A similar tendency has been recently reported for a free-living prokaryote [36]. These results together with our findings are suggestive of a role for overlap promoting genomic reduction.
4.3 Variational Benefits
Overlapping genes also vary in their preferred phases; when the overlapping genes are independently translated, mutations of large effect are encouraged. Contrariwise, longer overlapping sequences tend to favor phases where redundancy is maximized.
To address the questions of the variational properties of overlapping sequences, we need to examine the phase of overlapping genes. As a result of the triplet assignment
Table 5: Percentage of stop codons in the three subsets for E. coli. For the definition of subsets, see the text. The left half refers to all possible overlap lengths, whereas the the right part of the table only includes overlaps longer than 4 bp.
TAA TAG TGA TAA TAG TGA
rules of the canonical genetic code, genes can overlap in 6 different phases. In genes that are encoded in a single strand, these can be written as (123:123), (123:312) and (123:231) [9]. These describe the virtual base pairings in the context of the overlapping codons. In the first phase, the bases are perfectly aligned, and this phase is almost never observed. In the second phase, the most significant base (MSB) of the upstream gene (base 2) pairs with the intermediate significant base (ISB) of the downstream gene (base 1), while the least significant base (LSB = base 3), pairs with the MSB. We use MSB, ISB and LSB to describe the relative degeneracy of codon positions. Notice that mutations to the genes are going to be asym-metrical with respect to strand, with synonymous muta-tions to the LSB of the upstream gene causing a change at the MSB of the downstream one, whereas mutations to the LSB of the downstream gene alter the ISB of the upstream. In the third phase, the situation is again asym-metrical, but in this case the properties of the upstream gene are those of the downstream and vice versa.
We find that for codirectional overlaps, (123:312) is the most common at shorter overlaps, whereas (123:231) becomes more frequent at the longest overlaps. Can we understand this in terms of mutational susceptibility? For the sake of argument and without loss of generality, we make the following assumptions. The probability per nucleotide per generation of mutation is P. The probabil-ity that the mutation is non-synonymous at the MSB is equal to 1. The probability of non-synonymous mutation at the ISB is equal to H, where 0 <H< 1, And the probability at the LSB is equal to 0. Let us further assume that the effects of mutations on phenotypes are multiplicative, such that the phenotype of a genome with i mutations is given by (1 - p)i, where p is the average phenotypic effect
of an amino acid substitution. This provides us with a metric with which we can compare phenotypes to the wildtype which assumes a phenotypic value of 1. If we assume a single point mutation to a sequence, then the average phenotype of a genome with an overlapping pro-portion of nucleotides Uin phase (123:312), can be calcu-lated as follows. Mutations at the first nucleotide position of an overlapping triplet lead to substitution probabilities in the two genes, Hand 0, at the second position 1 and H, and the third position 0 and 1. The expected phenotype of a sequence with a single mutation falling in the overlap-ping sequence with a per genome per generation proba-bility UP, is then equal to:
F+1 = [(1 - p)H+ (1 - H) + (H(1 - p)2 + (1 - H)(1 - p)) + (1
-p)] (3)
A similar value can be calculated for (123:231):
F+2 = [(H(1 - p)2 + (1 - H)(1 - p)) + (1 - p) + (1 - p)H+ (1 -
H)] (4)
Where F+i indexes a positive translational offset i in the same strand. These are identical and hence on the basis of the changing phenotypes induced by mutations to over-lapping sequences, there is no reason to expect any differ-ence in the frequencies of these two phases.
What then is the cause of the observed difference in phase frequency? We discussed in Section VI a possible explana-tion in terms of mutaexplana-tional mechanisms producing over-lapping sequences. We also find that for those overlaps longer than 150 bp, the frequencies of the codirectional phases invert. We have yet to understand this trend (see also Section VI).
In the convergent and divergent configurations two regimes are observed. For overlaps shorter than ~50 bp the most common phase is the (123:132) (see Fig. 8). For longer overlaps, the phase (123:213) becomes increas-ingly more common (together with (123:321)).
We can write down the expected phenotype functions for each of the three phases negatively offset in the comple-mentary strand:F-2, F-1, F-0, corresponding to the phases (123:132), (123:213), (123:321):
F-2 = [(1 - H)2 + 2(1 - H)H(1 - p) + H2(1 - p)2 + 2(1 - p)]
(5)
F-1 = [(1 - H)(1 - p) + H(1 - p)2] (6)
F-0 = [2(H(1 - p) + (1 - H)) + (1 - p)2] (7)
After some algebra we find that,
F-1 dF-2 dF-0 (8)
This states that the phenotypic effect associated with phase (123:213) is the least robust. This is expected because this phase couples the MSB of one gene with the ISB of the other. Thus two out of three three times a tion is non synonymous in at least one gene and the muta-tion is non synonymous in both genes with probability 2H/3. This result helps us to understand why phase (123:213) is the least frequently observed (Table 3). The frequencies of the other two phases are in contrast with what expected from Eq. 8. In fact Eq. 8 suggests that phase
1 3
1 3
1 3
2 3
(123:321) (corresponding to F-0) should be more fre-quent than phase (123:132) (corresponding to F-2) whereas Table 3 shows that the the reverse is observed in real genomes.
5 Conclusion
The analysis of overlapping sequences indicates that more than one mechanism is likely to be responsible for the ori-gin and maintenance of these genomic traits. Not only do overlapping genes preserve features relating to their muta-tional origin, but secondary features relating to ongoing selection pressures. When two genes are on the same strand a mutation in the stop codon seems to be largely responsible for long overlaps. When two genes are in dif-ferent strands the stop codon mechanism helps in explaining the abundance of different phases but we require additional selective hypotheses to explain phase variation. Our essential conclusions can be stated as fol-lows:
1. When correcting for codon bias, both short overlaps – modal length 4 – and single strand usage can partly be accounted for in terms of the stochastic process of muta-tions to stop and start codons. This suggests a role for neu-tral processes in promoting gene overlap.
2. The preponderance of short overlaps in operons sug-gests an important role for translational coupling promot-ing overlapppromot-ing sequences for efficient gene regulation. This is evidence for selection promoting regulatory com-pression through overlap.
3. Selection for genome minimization can be gleaned from shorter genomes containing a larger frequency of overlapping genes whose average length is less than that of their non-overlapping orthologues. This is evidence for selection promoting replicative compression through overlap.
4. The most common overlap phases promote redundant base pairings that can not be explained in terms of neutral mutations in the presence of codon bias. This suggests a role for selective contraints on coding sequences, promot-ing greater mutational robustness.
5. The persistence of many non-redundant phases in long sequences suggests some selection pressures for amplify-ing the effects of point mutations in these genes. This could reflect either selection for highly efficient purging of deleterious mutations or a mechanism for promoting high diversity under variable conditions.
6. Overlap length is a strong predictor of some overlap phases but this variation can not be explained in terms of
the redundancy properties of each phase – both long and short phases can have the same error-buffering properties.
7. Long overlaps are a feature of many prokaryotic species and manifest a tendency towards a reduction in abun-dance over the course of evolution. This suggests the hypothesis that overlapping genes were a more common feature of ancestral prokaryotes.
8. There is considerable clade variation in phase prefer-ence, but very few species ever make use of the more muta-tionally deleterious phases.
9. Co-directional overlapping genes appear to be an ancestral genome trait whereas convergent and divergent configurations appear to be more derived.
These data collectively illustrate how much information can be compressed into a genome by exploiting the codon-based triplet code, and how variation in comsion phases exists in relation to different selection pres-sures and modes of gene origination. Overlap is just one of several mechanisms organisms employ to create one to many maps from transcription to translation overcoming the collinearity constraint (1-gene 1-protein). Some alter-natives are RNA editing [37] and post translational procesing. An additional source of multiple-coding, at least for recognition sites, derives from pressures reducing mutation load at high recombination rates [38]. In all cases, the combinatoric flexibility afforded by the tran-scription and translational mechanisms allow for adap-tive information to be added to that provided by the underlying linear sequence. The linear sequence is revealed to be an expedient structure for storage purposes rather than a true measure of the total information con-tent of the genome.
Reviewers' comments
Reviewer's report 1
Eugene Koonin, National Center for Biotechnology Informa-tion NaInforma-tional Library of Medicine NaInforma-tional Institutes of Health.
diminish their theoretical interest. Even if the sequences of overlap are rather short, they do carry two messages in the same string of nucleotides, and an extensive analysis of such sequences on genome scale has the potential to reveal aspects of selection and neutrality that escape our attention in the study of "normal" genes.
The paper of Lillo and Krakauer is, to my knowledge, the most comprehensive and nuanced analysis of this kind to date, and beyond any doubt, will be a useful addition to the literature. Of course, I do have a variety of comments that might be of some use for revision or could just help the interested reader to become better oriented in this rather complex tangle of problems.
2. First a couple of very general issues. The work would greatly benefit from a more extensive and more explicit analysis of the evolutionary conservation of overlapping regions (ORs). This would make a lot of sense both meth-odologically, by increasing the reliability of the results, and substantively. Indeed, it is interesting to see how the evolutionary conservation varies among different orienta-tions and phases of ORs, are there some ORs that are con-served in a broad range of prokaryotes, and more questions like that.
More or less along similar lines, it would make sense to present more information on possible lineage-specific trends in ORs. Is there some interesting biology here or are the characteristics of ORs just a function of genome size and gene density? If it is the latter, it is worth illustrating and stating explicitly. All the more so if it is the former.
As we show in this paper, using some careful controls, long over-laps are in fact far more common than is thought. While short overlaps can be reasonably easily explained in terms of an ongo-ing legacy of neutral mutations, modest genome minimization and regulatory compression, long overlaps make a strong case for replicative compression. As is shown in figure 2, the length distribution function indicates clearly how the longest overlap lengths exceed the expectations of the an exponential distribu-tion with the same mean.
With regard to lineage-specific trends, we include an explicit phylogenetic component by tracing several features of overlap-ping genes through a consensus prokaryotic phylogeny making use of squared change parsimony. This allows us to track vary-ing degrees of conservation, and to identify lineages in which changes to the genes have been more recent or derived. We also consider a more restricted dataset including only overlaps formed by pairs of genes that are conserved in at least two spe-cies and in this way seek to minimize curatorial artifacts.
3. In the Background section, the authors discuss the mutational origins of overlaps and the interplay of neutral
or adaptive processes in their evolution. However, I think it is rather important to explain right away the range of the phenomenon and to make distinction between viral over-lapping genes where many occasions of actual "genes within genes" and prokaryotic overlaps that are (predom-inantly) very short.
We elected to not treat cases of embedded overlapping genes in this study. This is because we sought those cases where controls based on non-overlapping orthologues could be used in the anal-ysis. Embedded genes are a fascinating topic as they often make additional demands on the post-transcriptional machinery, and as stated, are used extensively in viruses.
4. Variational benefits...this is an old, somewhat tired issue on the reality of "evolution of evolvability", evolu-tion having no foresight etc etc. The authors present this as a fully legitimate, regular evolutionary force. Perhaps, some extra caution and more discussion are due.
We have pointed out that variation in phase can not be explained exclusively in terms of either regulatory or immediate benefits. There is an ongoing effect of mutational origin on the statistics of phase usage, but this is also unable to explain a sig-nificant portion of the variation. What does seem more likely is that phases that are preferred have mutational properties that are either conservative – more redundant, or are amplifying – increase the amino acid replacement probability. Both of these strategies are consistent with robustness arguments, in which genomes are either buffered from genetic variation or more effi-ciently purged in a clonal quasispecies. It is also possible of course that increased variation can come under positive selec-tion, in which case this would constitute an evolveability hypothesis. With the current evidence we are unable to discrim-inate between the previous possibilities and we do not use the term evolveable although the hypothesis remains very much in play. We think that evolveability could be particularly interest-ing in microbes where population sizes are typically large and where indirect selective effects are thus able to exert a signifi-cant influence on adaptation. The existence of the mutator gen-otypes provide compelling evidence for this possibility.
genomes, the total length of the overlaps is much less. I understand it is no easy question but could there be any way to assess the selective advantages conferred by this amount of compression against the obvious disadvan-tages of overlaps (assuming they are not subject to other types of selection)? Also, if compression is so important, why no genes within genes? We know from viruses that this is not impossible.
This is now dealt with fairly explicitly in the text and the con-clusions. The question of the magnitude of replicative benefit, ideally measured in terms of replication rates in culture, is dif-ficult to quantify using only published sequence data. Having said this, it is instructive to note that around 3% of all genes are involved in overlap with a mean overlap length of 26 base pairs. In some species this percentage can be over 50%. The sum of all overlapping regions is on average 0.2% of the total genome length.
6. The rather notorious issue of long overlaps. It is possi-ble that I am overly cautious but I am worried over the right tail of the distribution in Fig. 1b. Clearly, there are only a few points in this area, and even a small number of artifacts would sway the curve away from the exponent. At least, I think this issue should be given more attention.
In the revised version we give more attention to this issue by considering a set of highly conserved ORs. See point 4 above and the new panel in Fig. 2.
7. The explanation of the striking under-representation of divergent overlaps given on p. 11 (and in ref. [25]) is, probably, correct. The point, I believe is that the constel-lation of regulatory elements that are required for the ini-tiation of both transcription and translation is much more demanding than that required for termination. Hence the strong purifying selection against divergent but not so much against convergent overlaps. By the way, an interest-ing thinterest-ing to check: are convergent overlaps in prokaryotes seen primarily in genes with rho-dependent or rho-inde-pendent termination? Sequence requirements for the two are very different.
We discuss this interesting problem in relation to the rho-inde-pendent terminators and convergent overlaps in E. coli. As the text indicates at least for E. coli there remains a relatively large number of sequence-dependent termination motifs even in over-lapping sequences.
8. In the discussion of phase frequencies – relating to the issue of long overlaps once again. I am very worried about the "crossing" at length 75. How many points there, after all?
In the revised version we make this number clear and include the sentence 'There are more than 300 codirectional ORs longer than 75 bp'
9. In the conclusions it would be desirable to indicate that, alas, there is no good way to distinguish between the adaptationist and neutral explanations or any combina-tion thereof. Under these circumstances, is it not prudent to take the neutral explanation as the null hypothesis?
As the paper shows there seems to be evidence for all three kinds of evolutionary explanation. While we agree that neutral hypotheses constitute an appropriate null model, we do find many patterns at odds with neutrality, from the most modest 4-base pair overlaps in operons, through to variation in phase preference in long overlapping sequences. We have tried to make these distinctions as clear as possible.
Reviewer's report 2
Martijn A. Huynen, Ph.D. Center for Molecular and Biomo-lecular Informatics Nijmegen Centre for MoBiomo-lecular Life Sci-ences Radboud University Nijmegen Medical Centre
1. taxonomy: The position of the hyperthermophilic bac-teria is, in my opinion, not resolved. Gene content (Dutilh, JME 2004) and indel analyses (Gupta) put Aquifex with the Proteobacteria, or at least at their root. Proteobacteria, and Thermotoga with the Firmicutes. That position of Aquifex would fit "better" their high level of overlapping genes which they share with the Proteobacte-ria. In line with this, I would be careful with the remark about the primitiveness of the overlapping organization, as you are, as far as I understand also referring to your results on the Archaea (not Archaeota) here. And there is no reason to assume that they are primitive.
We have endeavored to be cautious in the interpretation of the phylogenetically reconstructed patterns, largely because the sta-tus of the phylogeny remains somewhat ambiguous. Our tree is simply an 'all the evidence' super-tree which at the very least tells us that overlapping genes have been around as long as some of the most ancestral clades in the prokaryotic group.
2. with respect to Figure 8: please give a histogram, not a "longer than" plot. The former would give us a better impression of the strength of the signal and the amount of data supporting it.
We have added a panel to figure 8containing the histogram of the number of occurrences.