http://www.sciencepublishinggroup.com/j/ogce doi: 10.11648/j.ogce.20190703.11
ISSN: 2376-7669 (Print); ISSN: 2376-7677(Online)
A Study of Flow Regimes in the Upper Part of a Compact
Gas-liquid Separator
Sunday Kanshio
Department of Petroleum and Gas Engineering, Baze University, Abuja, Nigeria
Email address:
To cite this article:
Sunday Kanshio. A Study of Flow Regimes in the Upper Part of a Compact Gas-liquid Separator. International Journal of Oil, Gas and Coal Engineering. Vol. 7, No. 3, 2019, pp. 73-81. doi: 10.11648/j.ogce.20190703.11
Received: July 3, 2019; Accepted: July 22, 2019; Published: August 6, 2019
Abstract:
In the offshore oil and gas environment, there is usually the challenge with regards to available space offshore platforms for equipment installation; hence, compact separators are more attractive due to their small footprint. Also, in subsea oil and gas production, compact separators are attractive because of their light weight and ease of installation. A good understanding of the flow regimes in the upper part of the separator is essential for a robust design and operation. The performance of gas-liquid compact separator in terms of liquid carryover (LCO) and pressure drop depends on the type of flow regime in the upper part of the separator. However, there is a lack of experimental data on flow regimes in the upper part gas-liquid cyclone separators. In this research, data on flow regimes in the upper part of a 1.5-inch horizontal-inlet gas-gas-liquid cylindrical cyclone separator was acquired using electrical resistance Tomography (ERT), wire mesh sensor (WMS), pressure transducer and visual observation. Based on flow imagining, observations and statistical analysis, the flow regimes were classified as swirling-annular, light-mist, heavy-mist and churn flow. A flow regime map for the separator was proposed based on a modified liquid and gas-Froude number. The work would be a useful guide to process engineers during the preliminary design and sizing of separators with similar geometry configuration.Keywords:
Compact Separator, Flow Regime, Sub-sea Production, Offshore Platforms, Flow Regime Maps1. Introduction
In the petroleum industry, a separator is used in the oil field and process plant to separate a multiphase mixture into oil, gas and water. Traditionally, the petroleum industry relies on gravity-based separators for phase separation. Gravity-based separators are considered mature technology [1]. However, gravity-based separators are usually bulky, heavy and require more plot space. Where space and weight are a constraint, a compact and efficient phase separation technologies is more attractive. Cyclonic separators are light-weight and have a small footprint, making them attractive to applications such as subsea separation, un-manned platform, flare gas scrubber, portable-well-testing skid, multiphase measurement and debottlenecking of gravity separators [2, 3]. In subsea development, project economics is the critical driver for application of cyclonic separators [4]. Considering that the performance of the separator is sensitivity to inlet flow rates and inlet multiphase flow phenomena, its application is not as versatile as gravity-based separators.
Liquid carryover (LCO) and gas carry under (GCU) are the two complex hydrodynamics phenomena in the gas-liquid cyclonic separator. Liquid carryover (LCO) in the separator is a physical phenomenon that defines the separation efficiency and the operational limits of the separator. LCO occurs when the gas stream transports drops of liquid out of the gas outlet of the separator.
and annular-mist as the primary flow regimes that exist in the upper part of the GLCC separator [6, 7]. They reported that liquid carryover (LCO) in GLCC was observed during churn and annular-mist flow regimes. The churn flow regime was observed at relatively high liquid flow rates and low gas flow rate while the annular mist was observed at low liquid flow rates and relatively high gas flow rates. Zhou in a PhD thesis submitted to Cranfield University, UK, reported three flow regimes in the upper part of a GLCC separator as swirl flow, agitated flow and gas blow-by [8]. Hreiz et al., categorised flow regimes in the upper part of the GLCC into the churn and parietal (annular and ribbon) flow [9]. All the mentioned literature identified these flow regimes based on visual observation. None of those mentioned above work acquired data on the liquid-holdup in the separated for any of identified flow regimes.
The objective of the present work is to study the flow regimes in the upper part of the separator by using Electrical Resistance Tomography (ERT), Wire Mesh Sensor (WMS), pressure transducer and visual observation. The present work reported a new data-set on flow regimes in GLCC and proposed a flow regime map for the separator based on a modified Froude number. This work would be useful for both the design and operation of GLCC separator since separator operating parameters such as pressure drop, and liquid carryover depend on the flow regime in the separator.
The gas-liquid cyclone separator investigated in this study is named gas-liquid pipe cyclonic (GLPC) separator. The GLPC separator is similar to the gas-liquid cylindrical cyclone (GLCC) except that it uses a horizontal-tangential-inlet. The separator operates based on centrifugal force created due to the tangential entry of the multiphase flow into the separator. The centrifugal force causes upward and downward swirling of liquid film on the separator wall with the gas in the middle of the separator. The existence of swirling liquid film in the upper part of the separator presents a particular case of an upward vertical two-phase flow.
Depending on the inlet flow rate of the fluids, different flow regimes could exist in the upper part of the separator. The flow regimes could either enhanced phase separation or impaired phase separation. A good understanding of these flow regimes is essential for robust design and operation of the gas-liquid cyclonic separator has several applications in the petroleum industry.
2. Experiment Program
2.1. Test Facility
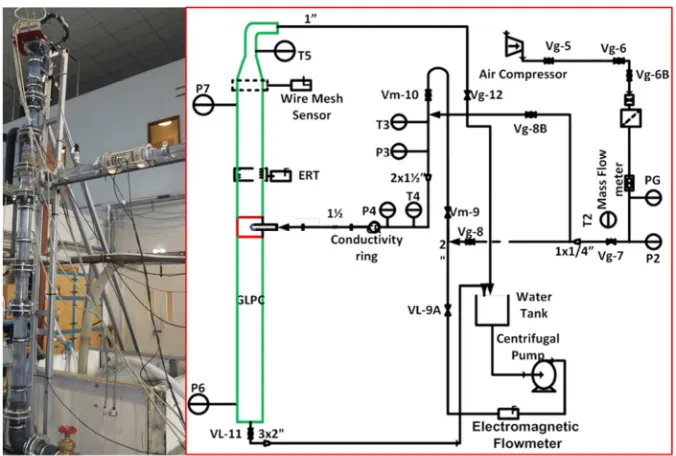
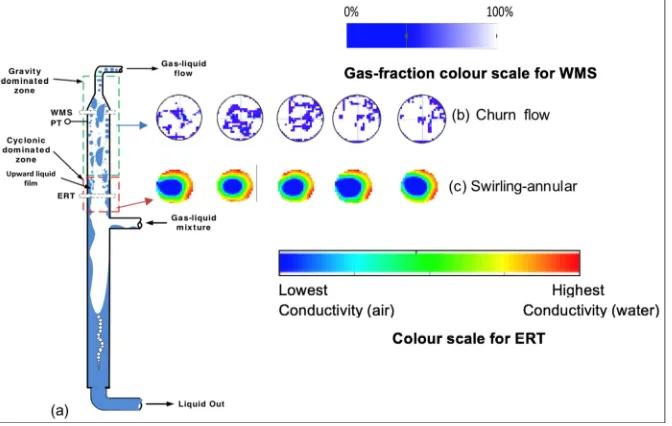
The gas-liquid pipe cyclone (GLPC) separator test facility was fabricated and installed in the Process Systems Engineering Laboratory at Cranfield University, UK. As shown in Figure 1, the test facility consists of the fluids supply and metering section, the GLPC separator, and fluids return section. Air and water were used as test fluids and referred to in this work as gas and liquid, respectively. The gas was metered using Endress+Hauser thermal mass flow meter (Proline t-mass 65). The liquid was supplied to the flow loop by Certikin Aquaspeed self-priming pump, which has a maximum duty of 4.0 l/s at 3.0 barg. It was metered using ABB electromagnetic flow meter. The liquid is a closed loop system as the liquid that entered the test section returns to the tank from where it is delivered into the test section again.
The test section consists mainly of a horizontal inlet GLPC separator where gas-liquid separation takes place. The liquid is a closed loop system as it is returned to the test facility. The separator is 76.1 mm in diameter, the total height of 2.9 m (height of 1.3 m and 1.6 m above and below the separator inlet respectively) and the separator inlet diameter is 38.1 mm. A gate valve was installed on the gas and liquid outlet for manual control of separator pressure and liquid level, respectively.
2.2. Instrumentation and Data Acquisition
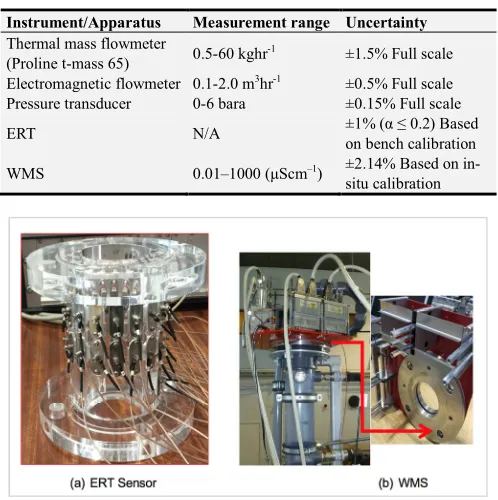
The instruments used for this research include a pressure transducer, temperature probe, electrical resistance tomography (ERT) and wire mesh sensor (WMS). The ERT and WMS were used for online flow imaging, offline image reconstruction and measurement of cross-sectional liquid-holdup in the separator. The ERT, pressure transducer and WMS were installed above the separator inlet at 250 mm, 1000 mm and 1200 mm respectively. The instruments measurement uncertainty is presented in Table 1.
Table 1. Summary of instruments and measurements uncertainties.
Instrument/Apparatus Measurement range Uncertainty Thermal mass flowmeter
(Proline t-mass 65) 0.5-60 kghr
-1 ±1.5% Full scale
Electromagnetic flowmeter 0.1-2.0 m3hr-1 ±0.5% Full scale
Pressure transducer 0-6 bara ±0.15% Full scale
ERT N/A ±1% (α ≤ 0.2) Based
on bench calibration
WMS 0.01–1000 (µScm–1) ±2.14% Based on
in-situ calibration
Figure 2. Photo of ERT sensor and WMS.
The ERT (Figure 2a) is a non-intrusive measurement technique by which information about the electrical properties of fluids in a process volume is inferred from the periphery electrodes measurement. The ERT used in this study consist of a dual-plane sensor each having 16 stainless steel electrodes mounted on the periphery of the GLPC separator. A data acquisition system (DAS) developed by ITS Plc was used to acquire data from the sensor. The data acquisition and transfer speed of the system was approximately 1000 frames per second. The sensitive coefficient back projection algorithm was used for image reconstruction.
The WMS (see Figure 2b) is an intrusive flow imaging device with high spatial and temporal resolution. The system is developed by Helmholtz-Zentrum Dresden-Rossendorf (HZDR) of Germany. The measurement principle is based on the relative permittivity of the process fluids. It consists of two planes of wire electrodes stretched across the pipe cross-section. One plane is the receiver, and the other is the transmitter. Each plane has 24 wires of 0.12 mm diameter running parallel to each other but perpendicular to the wires
of the other plane forming grids of wire electrode with equal spacing. Raw data were acquired for 120 seconds at a sampling frequency of 1000 Hz and after that processed into liquid-holdup using the wire mesh framework. The wall pressure fluctuation in the separator was measured using a fast response pressure transducer. The pressure transducer used has a rangeability of 0-6 barg. The pressure transducer was used to confirm the WMS measurements.
2.3. Experimental Procedure
Single phase liquid flow was first injected into the separator to establish a stable upward swirling liquid film. The liquid flow rate was adjusted using 2-inch gate valve until the predetermined flow rate was achieved and kept stable. The liquid and gas discharge outlet gate valve were respectively held fully opened during the experiment. The separator liquid level was kept constant at 0.7 m below the inlet. Similar to the liquid flow, the gate valve on the gas line was used in adjusting the gas flow rate into the separator. The gas was introduced, and the flow condition in the separator was allowed to stabilise before the data acquisition using ERT, WMS and Labview were carried out. The liquid and gas flow rate, pressure and temperature were recorded using Labview software. The gas flow rate was increased till the gas delivery capacity was exhausted or until churn flow (or liquid carryover) was observed in the upper part of the separator. A higher liquid flow rate was then introduced into the separator, and the same procedure as explained above followed.
3. Results and Discussions
3.1. Flow Regime Identification and Classification
3.1.1. Swirling-annular Flow
The swirling-annular flow is characterised by a well-defined gas core and a steady swirling liquid film on the inner wall of the separator. The swirling-annular flow occupies the cyclonic zone of the separator. The swirling-annular flow regimes exist in the separator at all inlet conditions. At low gas and liquid flow rates, only the swirling-annular flow exist in the separator in which case; a perfect gas-liquid separation is achieved. At higher gas-liquid inlet flow rate, the swirling-annular flow coexists with other flow regimes. At an inlet superficial liquid velocity (USL) of
0.37 m/s, swirling-annular flow existed for a maximum inlet superficial gas velocity (USG) of 13.3 m/s. At higher inlet
liquid flow rate (USL=2.52 m/s), the swirling-annular flow
was only possible at a low gas flow rate (USG=2.44 m/s).
Increasing the inlet liquid flow rate increases film thickness
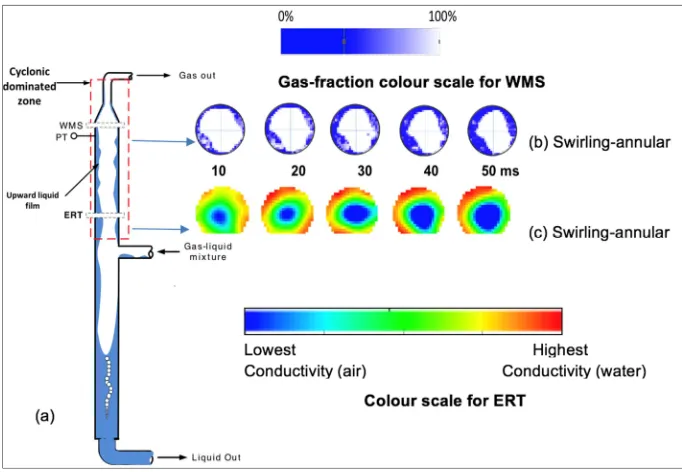
in the cyclonic zone, thereby reducing the cross-sectional area for gas flow. The increasing gas flow above this threshold initiates film instability and droplets atomization from the wall of the separator. The swirling-annular flow was identified by visual observations and confirmed by online imaging of the flow behaviour using ERT. The gas-core can be seen from the conductivity tomogram obtained from ERT system, as shown in Figure 3b. The blue colour represents the cross-sectional area occupied by the low conductivity fluid (air), and the red represents high conductivity fluid (water). It was observed during the experiment that, as long as the swirling-annular flow did not transit into either heavy-mist or churn flow near the gas outlet as illustrated in Figure 6 and Figure 7 a perfect separation of gas from the liquid was achieved.
Figure 3. Swirling-annular flow only (a) schematic representation (b) images from ERT time-series image for USL= 2.52 m/s; USG=2.44 m/s. A sampling time
interval of 10 ms.
An extreme case of swirling-annular flow also exists whereby a fast-moving thin liquid film swirls all the way to the gas outlet of the separator. A stable gas-core was observed as the upward swirling film goes all the way to the roof of the separator and sometimes resulting in liquid carryover. Images from both ERT and WMS, as shown in Figure 4b and c, depicts this phenomenon. This case of swirling-annular flow regime was observed when the inlet flow regime was slug flow. The behaviour of the flow regime is similar to what Hreiz et al., called parietal/ribbon flow [9]. The inlet superficial gas and liquid velocity for this condition was 6.81 m/s and 2.51 m/s respectively. The reason for this behaviour is attributed to high nozzle exit velocity resulting from the high velocity of the slug body. This high nozzle exit velocity generates high centrifugal force and hence swirl intensity. The high swirl intensity of the gas results in high interfacial shear stress that is probably responsible for the upward swirling liquid film reaching the gas outlet.
3.1.2. Light-mist Flow
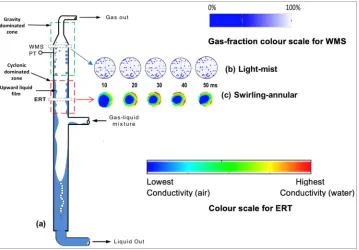
Increasing the liquid and gas flow rates above a certain threshold, tiny liquid drops are initiated from the swirling annular flow regime due to the shear effect of gas velocity.
For example, by increasing superficial gas velocity from 2.44 m/s to 5.69 m/s at a constant superficial liquid velocity of 2.52 m/s, tiny liquid drops were observed travelling toward the gas outlet. While the swirling annular flow still prevails in the cyclonic zone, light-mist emerged in the gravity zone. The light-mist flow regime is characterised by liquid droplets ejection from the swirling liquid film of the cyclonic zone. The injection of drops from the swirling annular flow to light-mist flow regime could be attributed to the onset of droplets formation due to the stripping and shearing of the wavy liquid film by high rising gas. The stripped liquid film eventually enters the gas stream due to the influence of the drag force of the rising gas. As schematically shown in Figure 5, swirling annular flow exists in the cyclonic zone while the light-mist flow prevailed in the gravity zone depending on the inlet flow rates. Complete separation of gas and liquid is achieved under the light-mist flow. The swirling annular flow is shown by the tomograms from ERT in Figure 5c, and the light-mist flow regime is depicted by images obtained from WMS measurement (see Figure 5b). The uniform distribution of the blue dots is an indication that the WMS got wetted due to the presence of dispersed drops.
Figure 5. Swirling-annular and light-mist flow regime (a) schematic representation (b) ERT time-series images (c) time series of 2D WMS image for inlet USL= 2.52 m/s, USG=5.69 m/s. A sampling time interval of 10 ms.
3.1.3. Heavy-mist Flow Regime
Large liquid droplets characterized the heavy-mist flow. Just like the light-mist flow, heavy-mist coexisted with the swirling annular flow, as shown in Figure 6. At constant liquid flow, increasing the flow of gas beyond the threshold of the light-mist flow resulted in more liquid film stripping and consequently more droplets in the middle of the separator. The presence of more droplets in the middle of the separator increases the coalescing of the small droplets to
is clear that there are larger blue dots in Figure 6b compare to those of light-mist flow regime shown in Figure 5b.
Figure 6. Swirling-annular and heavy-mist flow regime (a) schematic representation (b) ERT time-series images (c) time series of 2D WMS image for inlet USL= 2.52 m/s,; USG=6.72 m/s. A sampling time interval of 10 ms.
3.1.4. Churn Flow Regime
The flow regime was generally chaotic as falling liquid film, upward swirling film, rising liquid droplets and falling chunks all take place simultaneously. Under the same inlet condition, swirling annular flow existed in the cyclonic zone (see Figure 7c) while churn flow in the gravity zone (see Figure 7b). Churn flow regime was observed at a much-elevated inlet gas flow rate for a constant liquid flow rate. For example, increasing the separator inlet superficial gas velocity from 6.72 m/s to 7.52 m/s caused more film stripping in the cyclonic zone that resulted in chunks of liquid being lifted to the gas outlet. Under churn flow, the flow in the upper part of the separator is pretty much like
normal churn flow in vertical two-phase flow. The tomogram from ERT (see Figure 7c), as well as visual observation, indicates the presence of very thick film in the cyclonic zone during churn flow. This thick film is a direct consequence of the gas and liquid superficial velocity exceeding the operating envelope of the separator. It was observed that the churn flow regime initiates closer to the separator inlet compared to light-mist and heavy-mist flow because film-stripping starts much earlier due to the existence of a thicker liquid film that tends to reduce the area for gas flow. Separator performance under churn flow is poor as only partial separation of gas from the liquid was achieved.
Figure 7. Swirling-annular and churn low regime (a) schematic representation (b) ERT time series images (c) time series of 2D WMS image for inlet USL=
3.2. Statistical Analysis of the Flow Regimes
Statistical analysis of liquid-holdup and pressure fluctuations is a well-established method for identification of flow regime in process equipment such as fluidized bed [10, 11]. Variation of process parameters such as pressure and liquid-holdup with respect to time can provide useful insight into the flow regime in the upper part of GLPC separator. In this work, wall pressure fluctuation was obtained using a pressure transducer installed near the gas outlet but below the position of WMS. The liquid-holdup was obtained using ERT and WMS. The WMS and the pressure transducer gave information about the flow regimes in the gravity-dominated zone of the separator while the ERT provided information about the flow regime in the cyclonic zone of the separator. The sampling frequency for the ERT was 1000 fps; that of
pressure transducer was 100 Hz, and WMS was 1000 Hz. The sampling period for the pressure transducer and WMS was 120 seconds respectively, and that of ERT was 3 seconds. In order to identify the flow regime more objectively, the amplitude of the liquid-holdup and pressure signal is expressed in terms of standard deviation ( ) as:
= ∑ − ̅ (1)
where
̅
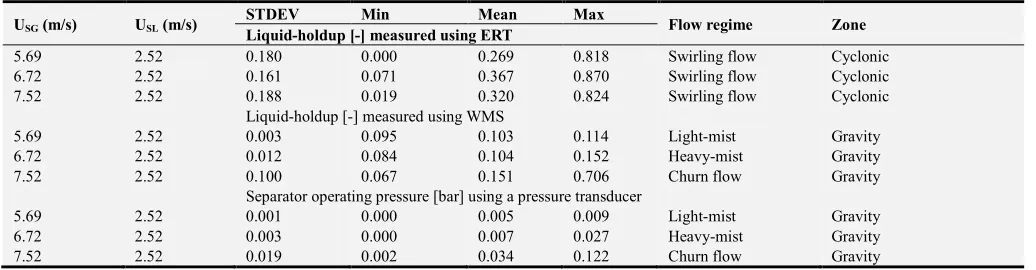
is the time-mean value of the liquid-holdup and pressure signals x over the sampling period, respectively. is the total number of sampling points for liquid-holdup and pressure signals. The standard deviation, mean, minimum and maximum values of the holdup and pressure values for each of the flow regime are presented in Table 2.Table 2. Basic statistical analysis of the flow regimes using liquid-holdup and pressure values.
USG (m/s) USL (m/s)
STDEV Min Mean Max
Flow regime Zone
Liquid-holdup [-] measured using ERT
5.69 2.52 0.180 0.000 0.269 0.818 Swirling flow Cyclonic
6.72 2.52 0.161 0.071 0.367 0.870 Swirling flow Cyclonic
7.52 2.52 0.188 0.019 0.320 0.824 Swirling flow Cyclonic
Liquid-holdup [-] measured using WMS
5.69 2.52 0.003 0.095 0.103 0.114 Light-mist Gravity
6.72 2.52 0.012 0.084 0.104 0.152 Heavy-mist Gravity
7.52 2.52 0.100 0.067 0.151 0.706 Churn flow Gravity
Separator operating pressure [bar] using a pressure transducer
5.69 2.52 0.001 0.000 0.005 0.009 Light-mist Gravity
6.72 2.52 0.003 0.000 0.007 0.027 Heavy-mist Gravity
7.52 2.52 0.019 0.002 0.034 0.122 Churn flow Gravity
Swirling annular flow: The standard deviation and other statistical parameters of the time-varying liquid-holdup are presented for the three test points. From the data, it can be seen that there is no appreciable difference in the respective standard deviation of the liquid-holdup. The maximum holdup for all the points is also within a close range. This means that the flow regime does not change in this location of the separator irrespective of changes in the separator inlet flow rates.
Light-mist flow: When only gas exits the gas outlet of the separator due to complete separation, the magnitude of turbulent fluctuation in the upper part of the separator near the gas outlets is expected to be lower compared to when the gas is carrying liquid droplets. The standard deviation for the flow regime was obtained from the pressure signals and liquid-holdup. The standard deviation of the pressure signals and liquid-holdup is 0.001 bar and 0.003, respectively. The standard deviation is low because there are no liquid drops in the flowing gas to cause significant signal or holdup fluctuation.
Heavy-mist flow: The standard deviation of the pressure signal and liquid-holdup is 0.003 bar and 0.012, respectively. As the flow rate of gas increased from 5.69 to 6.72 m/s, the standard deviation also increased. The increase in standard deviation is as a result of an increase in turbulence fluctuations in this location of the separator due to the presence of dispersed liquid droplets in the gas stream.
Churn flow: The standard deviation of the pressure signal
and the liquid-holdup is 0.019 bar and 0.100, respectively. As expected, the standard deviation is far higher compared to light-mist and heavy-mist flow. The standard deviation is high because of the chaotic nature of the churn flow regime.
3.3. Flow Regime Map
In this section, a flow regime map is proposed using modified gas and liquid Froude number as an input parameter. Froude number, which is the ratio of flow inertia to the external force field, is a critical dimensionless parameter for flow regime identification and for separator performance analysis. Froude number and volumetric ratio were recognised by Spedding and Nguyen as the most satisfactory parameter for constructing a flow regime map for a vertical upward gas-liquid two-phase flow [12]. Van’t Westende used Froude number to define flow regime transition criteria for annular/churn transition [13]. Rosa et al., suggested that for good phase separation, the Froude number should stay between 1 and 10 [14]. Similarly, Kolle et al., reported that phase separation in their cyclonic separator was initiated when the Froude number was approximately 1.4 [15]. The use of Froude number could also be a useful means of comparing different separator performance. The magnitude of gas and liquid Froude number at the entrance of the separator could determine the occurrence of a given flow regime. The flow regime map
proposed in this study is presented in terms of modified Froude number derived below.
For gas and liquid to separate in GLPC, the centrifugal force acting on the multiphase mixture should be greater than gravity force as shown in Equation 2. When that happened, a perfect separation is achieved whereby the liquid forms a stable annular film and swirls against the separator wall while the gas remained in the middle as it rises to the top. The modified Froude number considers the separator inlet cross-sectional area and separator inside diameter.
! " # > 1 (2)
Substituting for Fc and Fg gives Equation 3
&= '()*
+
, =
")*
-./ 0123 (3)
The right hand of Equation 3 takes the form of Froude number. The tangential velocity 45 is expressed in Equation 4 in terms of inlet liquid and gas velocity, 46 inlet inclination angle, 7, inlet pipe cross-sectional area, 86and inlet nozzle cross-sectional area, 869:.
45=;><==?@><=ABC7 (4)
Substituting Equation 4 into 3 gives the modified Froude number is as in Equation 5.
DE =FG<=H<=H=?@I9JKL *
-./M0123 (5)
For the horizontal inlet GLPC separator, 7 = 0-, hence,
OBC7 = 1
Equation 5 considers all the critical geometric parameters, namely: nozzle diameter, inlet diameter, inlet angle of inclination and separator diameter. Equation 5 was used for calculating both liquid and gas Froude number. The mentioned geometric parameters all affect the flow regimes in the separator.
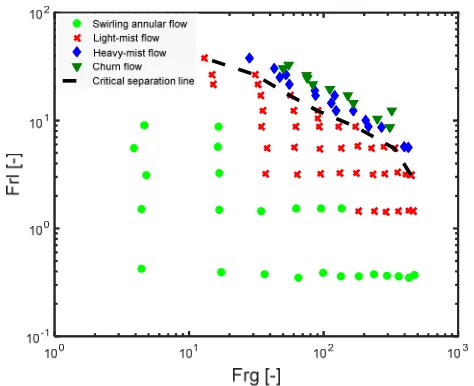
Figure 8. Flow regime map for the upper part of the 3-inch horizontal inlet GLPC separator for air-water flow.
Figure 8 is the proposed flow regime map of the observed flow regimes. It is plotted using the liquid and gas Froude number calculated by applying Equation 5. From the map, it could be deduced that heavy-mist flow regime is a transition between the light-mist and churn flow regime. In order to investigate the applicability of the proposed flow regime map, a line was drawn between the points bordering the light-mist and the heavy-mist flow regime and named as critical separation curve. This critical separation line is the same as the liquid carryover operating envelope of the separator. The critical separation curve was drawn manually and hence could be regarded as a qualitative line rather than a quantitative line. We hope to develop a model that could predict the critical line in our future work. From the present data, the Froude number below the curve corresponds to complete phase separation while those above it corresponds to partial phase separation.
3.4. GLPC Separator Flow Regimes – implication for Separator Design
In this section, the implication of flow regime on the design and operation of the GLPC separator is presented. The transition from swirling annular flow regime to light-mist, heavy-mist and churn flow has an implication on the design and operation of pipe cyclonic separator. A proper design of the separator must consider the likely flow regimes that might exist in the upper part of the separator. The understanding of flow regime in the separator is critical in sizing second stage separation devices such as gas polisher or in-situ separation enhancement device such as annular liquid film removal. The in-situ separation enhancement device such as annular liquid film removal was investigated previously by Molina et al., [16]. Moreover, the understanding of the likely flow regimes in the separator could guide the designer in making the right engineering judgements on the type of inlet geometry to select. The separator should be designed to operate only in the swirling-annular and light-mist flow regimes to avoid liquid carryover. Heavy-mist and churn flow must be avoided by increasing the separator diameter, reducing the inlet nozzle diameter or using annular film removal. If the expected velocities of gas and liquid into the separator are high, multistage separation should be used, or a gas polisher should be used. During the preliminary design of a cyclonic gas-liquid separator, a flow regime map such as the one presented in this work could be consulted to predict the likely flow regime that could exist in the upper part of the separator.
4. Conclusions
the only flow regime in the cyclonic zone occurred for all inlet flow rates due to the centrifugal force created as the fluids enter tangentially into the separator. In the gravity zone, light-mist, heavy-mist and churn flow regime was observed. A flow regime map was developed based on a modified Froude number for gas and liquid. It is suggested that this flow regime map could be used as a simple guide in comparing compact separators of similar configuration. The flow regime that gives better separation was the swirling annular and light-mist flow. A critical separation line was used in delineating between complete phase separation and partial phase separation based on the present data.
Nomenclature
8 Inlet pipe cross-sectional area [m2]
8 P Inlet nozzle cross-sectional area [m2]
QJRS Separator inside diameter [m]
DT Centrifugal force [N]
DM Force if gravity [m/s2]
DUM Froude number for gas flow [-]
DUV Froude number for liquid flow [-]
45 tangential velocity [m/s]
W Mass [kg]
Total number of sampling points for liquid-holdup -
E Separator radius [m] Separator operating pressure [bar] USL Inlet superficial liquid velocity [m/s]
USG Inlet superficial gas velocity [m/s]
̅ is the time-mean value of the liquid-holdup [-] Ѳ GLCC Inlet section Inclination Angle from the Horizontal [degrees]
σ
Standard deviationLiquid-holdup [-]
Abbreviations
ERT Electrical resistance tomography DAS Data acquisition system
GLCC Gas-liquid cylindrical cyclone GLPC Gas-liquid pipe cyclone
HZDR Helmholtz-Zentrum Dresden-Rossendorf ID Inside diameter
LCO Liquid carryover PIPE-SEP Pipe-separator WMS Wire mesh sensor
References
[1] D. M. Lavenson, A. V. Kelkar, A. B. Daniel, S. A. Mohammad, G. Kouba, and C. P. Aichele, “Gas evolution rates – A critical uncertainty in challenged gas-liquid separations,” J. Pet. Sci. Eng., vol. 147, pp. 816–828, Nov. 2016.
[2] O. Kristiansen, Ø. Sørensen, and O. R. Nilssen, “CompactSepTM - Compact Subsea Gas-Liquid Separator for High-Pressure,” 2016.
[3] G. Kouba Edward, O. Shoham, and S. Shirazi, “Design and Performance of Gas Liquid Cylindrical cyclone Sparators,” in BHR Group 7th Internation Conference on Multiphase Flow, 1995, pp. 307–327.
[4] A. Hannisdal, R. Westra, M. R. Akdim, A. Bymaster, E. Grave, and D. T. Teng, “Compact Separation Technologies and Their Applicability for Subsea Field Development in Deep Water,” Offshore Technology Conference. Houston, Texas, USA, 2012.
[5] W. A. Chirinos, L. E. Gomez, S. Wang, R. S. Mohan, O. Shoham, and G. E. Kouba, “Liquid Carry-Over in Gas/Liquid Cylindrical Cyclone Compact Separators,” SPE J., vol. 5, no. 3, pp. 259–267, Jan. 2000.
[6] S. S. Kolla, R. S. Mohan, O. Shoham, S. Wang, and L. Gomez, “Experimental Analysis of Liquid Carry-over in Gas-Liquid Cylindrical Cyclone Separators,” IJST, vol. 1, no. 2, pp. 1–14, 2008.
[7] S. S. Kolla, “Liquid carry-over in Gas-Liquid Cylindrical Cyclone (GLCC©) compact separators for three-phase flow,” The University of Tulsa, 2007.
[8] Y. Zhou, “Experimental and Simulation Studies on Performance of a Compact Gas/Liquid Separation System,” Cranfield University, 2013.
[9] R. Hreiz, R. Lainé, J. Wu, C. Lemaitre, C. Gentric, and D. Fünfschilling, “On the effect of the nozzle design on the performances of gas–liquid cylindrical cyclone separators,” Int. J. Multiph. Flow, vol. 58, pp. 15–26, Jan. 2014.
[10] D. Bai, E. Shibuya, N. Nakagawa, and K. Kato, “Characterization of gas fluidization regimes using pressure fluctuations,” Powder Technol., vol. 87, no. 2, pp. 105–111, May 1996.
[11] F. Johnsson, R. . Zijerveld, J. . Schouten, C. . van den Bleek, and B. Leckner, “Characterization of fluidization regimes by time-series analysis of pressure fluctuations,” Int. J. Multiph. Flow, vol. 26, no. 4, pp. 663–715, Apr. 2000.
[12] P. L. Spedding and V. T. Nguyen, “Regime maps for air water two phase flow,” Chem. Eng. Sci., vol. 35, no. 4, pp. 779–793, 1980.
[13] J. M. C. Van’t Westende, Droplets in annular-dispersed gas-liquid pipe-flows. TU Delft, Delft University of Technology, 2008.
[14] E. S. Rosa, F. A. França, and G. S. Ribeiro, “The cyclone gas– liquid separator: operation and mechanistic modeling,” J. Pet. Sci. Eng., vol. 32, no. 2, pp. 87–101, 2001.
[15] J. J. Kolle, K. Theimer, T. Theimer, R. Cox, and S. R. Scherschel, “Coiled Tubing Jet Drilling With a Downhole Pressure Intensifier,” in SPE/ICoTA Coiled Tubing and Well Intervention Conference and Exhibition, 2008.