information
Article
A Specification-Based IDS for Detecting Attacks on
RPL-Based Network Topology
Anhtuan Le1, Jonathan Loo2,*, Kok Keong Chai1and Mahdi Aiash2
1 School of Electroic Engineering and Computer Science, Queen Mary University of London,
London E1 4NS, UK; [email protected] (A.L.); [email protected] (K.K.C.)
2 School of Science and Technology, Middlesex University, London NW4 4BT, UK; [email protected]
* Correspondence: [email protected]; Tel.: +44-20-8411-6517
Academic Editor: Willy Susilo
Received: 1 March 2016; Accepted: 5 May 2016; Published: 12 May 2016
Abstract:Routing Protocol for Low power and Lossy network (RPL) topology attacks can downgrade the network performance significantly by disrupting the optimal protocol structure. To detect such threats, we propose a RPL-specification, obtained by a semi-auto profiling technique that constructs a high-level abstract of operations through network simulation traces, to use as reference for verifying the node behaviors. This specification, including all the legitimate protocol states and transitions with corresponding statistics, will be implemented as a set of rules in the intrusion detection agents, in the form of the cluster heads propagated to monitor the whole network. In order to save resources, we set the cluster members to report related information about itself and other neighbors to the cluster head instead of making the head overhearing all the communication. As a result, information about a cluster member will be reported by different neighbors, which allow the cluster head to do cross-check. We propose to record the sequence in RPL Information Object (DIO) and Information Solicitation (DIS) messages to eliminate the synchronized issue created by the delay in transmitting the report, in which the cluster head only does cross-check on information that come from sources with the same sequence. Simulation results show that the proposed Intrusion Detection System (IDS) has a high accuracy rate in detecting RPL topology attacks, while only creating insignificant overhead (about 6.3%) that enable its scalability in large-scale network.
Keywords:6LoWPAN; RPL; internal threats; topology attacks; specification-based; IDS
1. Introduction
Routing Protocol for Low power and Lossy network (RPL) is a protocol developed specifically for the 6LoWPAN network, in order to bring the concept of Internet of Things (IoT) to the real life. RPL has many advantages such as the energy efficiency, optimal routing and minimal overhead, which makes it outperform other previous routing protocol [1]. As a result, the protocol is also proposed to apply in a lot of other situations such as Smart Grid and so on. For the overall operation of the protocol as well as the basic concepts of routing messages like DIO, DIS, and the trickle algorithm, readers can refer to [1–8] for more detail.
Internal threats on RPL-based network is a challenge due to the weak physical protections of the nodes, no centralized administration, low capability node that make strong cryptography not applicable, and lack of node co-operation. Internal threats can be categorized into two types: the performance attacks and the topology attacks [2]. The performance attacks focus on manipulating the network performance directly, for instance, making an adverse source dropping all the packets (black hole attack), dropping some of the packets (selective forwarding attack), or adding delay to the forwarding. On the other hand, topology attacks involve node operation to disrupt the optimal network topology, for example, creating loops, attracting traffic, or generating heavy overhead. Internal
attackers often combine these two types of attacks to boost the effect of their attacks, for example, using topology attack to gain the traffic towards a malicious source and then manipulating those traffic through this source’s performance.
The main focus of this paper is the topology attack. Several RPL topology attacks such as Sinkhole, Rank, Local Repair, Neighbor, and DIS attacks have been reported to have significant bad impact on network performance [3,5,8]. Cryptographic solutions cannot prevent the internal threats once the attackers tamper the nodes and obtain the secure keys [2]. Moreover, some security modes of RPL are considered impractical without the use of public key cryptography, which is believed to be too expensive in common [9]. Tsaoet al. [9] also provided several countermeasures for a number of RPL attacks, however, such countermeasures mostly change the operations to overcome the attack impacts rather than specifying and eliminating the malicious sources, which can create long term issues for the network performance. Therefore, it is necessary to have an Intrusion Detection System (IDS) to monitor and detect the compromised nodes.
In RPL-based network, the two most applicable IDS approaches for detecting the internal threats are the anomaly-based and specification-based. Anomaly-based IDS identifies a node as intrusion when this node has too much deviation in behaviors compare to the normal baselines. The most important aspect for the accurateness of an anomaly-based IDS is to define the normal or legitimate behaviors and the threshold for the deviations, in which any node acts more than this threshold will be identified as the malicious. Anomaly-based IDS is used widely in securing routing protocols in wireless sensor and wireless ad hoc network from the internal threats. However, the work follows this approach in securing RPL is only in the initial step. Razaet al.[6] proposed SVELTE, the first anomaly-based IDS for securing the RPL protocol with two phases, including collecting and analyzing the IDS data. In the collecting phase, the Destination Oriented Directed Acyclic Graph (DODAG) root (also the monitoring node of all nodes in the network) will request its network members to send information about itself and its neighbors. The information that each member has to send includes the RPL Instance ID, the DODAG ID, the DODAG Version Number, all neighbors and their corresponding ranks, the parent ID, the node’s rank and a timestamp. Once the information received, the monitoring node moves to the analyzing phase by using such data to form a network map, evaluate the rank consistency and check the legitimacy of the rank rules between any parent-child pair. This anomaly-based IDS also focuses on monitoring the deviation between normal and anomaly nodes behaviors. However, in case of topology attacks, malicious nodes perform similarly to normal nodes in terms of sending and receiving messages, hence, the difference in whether a node following the protocol rules cannot be effectively detected by the anomaly-based IDS.
Information2016,7, 25 3 of 19
a node needs to follow the rank rule in any case, or a node needs to not generate redundant control messages.
Profiling technique also needs to be considered. Previous works mainly employed manually profiling techniques, which are based on the expert understanding of the protocol. This method is, however, lack of fast and accurate profile generations for a particular protocol, as well as difficult to verify. To overcome this problem, the authors in [12] propose a technique that based on Inductive Logic Programming (ILP) method to induce a hypothesis from individual observations and background knowledge. The authors collect examples of the protocol executions through extensive simulation traces and derive an abstract model of protocol behavior out of that. This solution has the advantage of fast profiling generation with the ability of validating the correctness of such specification.
This paper is the continuation of our on-going research on IDS for detecting the internal threats in IP-connected wireless sensor network [2–5], where we identified and evaluated prominent internal threats and proposed a general IDS framework to detect them. This work is the next concrete step to develop, implement, and verify a specification-based IDS to detect the topology attacks in RPL-based network. In detail, we first summarized the prominent topology attacks known to RPL from previous research [2,3,5,6,8]. We then profile the RPL operation based on a semi-auto specifying technique, which is inspired from [12] and involves the use of simulation trace files to generate an Extended Finite State Machines (EFSM—a Finite State Machine with statistic information about transitions and states) for RPL. Such profile will be transformed as a set of rules applied for checking monitoring data from the network nodes regarding relevant properties. We employ the cluster monitoring architecture, in which the network will be divided into multiple smaller clusters, the IDS agent will stay as the head in the center of each cluster to monitor the cluster members according to the set of rules implemented. This architecture can decrease the storage and computation work load for the IDS agents, while keeping a low rate of overhead. The simulation results show that our IDS can effectively detect most of the topology attacks with small amount of overhead.
The rest of this paper is organized as follows: Section2gives a short summary of prominent known RPL topology attacks. Section3describes two phases of building our specification-based IDS, including profiling the RPL protocol and implementing it into the network. Section4evaluates the proposed solution and Section5discusses further consideration of expanding the IDS to deal with more kind of internal threats. Finally, Section6concludes the paper.
2. Topology Attacks on RPL
Our works [2–5] have discussed some of the particular topology attacks on RPL including the Rank, the Local repair, the Neighbor, and the DIS attack. Attacks with the same nature in wireless sensor or ad hoc network can also apply for RPL, as discussed in [2,6]. We will summarize some of the prominent attacks from those that work as the targets for our IDS to detect as follow.
‚ The Rank attack:after the attack is triggered, the malicious node changes the way it processes the DIO messages from other neighbors so that it will get the node with the worst rank as the preferred parent. This kind of attack will create un-optimized route for all the packets that go through the malicious nodes, and it also creates more traffic to the victim.
‚ The Sinkhole attack:the malicious node will propagate its rank with a good value, normally the same rank of the sink. As a result, its neighbors will select it as their preferred parent and send traffic to that node. The Sinkhole attack is often combined with the Selective Forwarding attack (a performance attack which is out of scope of this paper) to drop all the traffic attracted.
‚ The Neighbor attack: after the attack is triggered, the malicious node will replicate any DIO messages that it receives and broadcast them again. The victims who receive this type of messages may think that it has a new neighbor, which is not in range. Moreover, if the new neighbor advertises a good rank then the victims may request it as the preferred parent and change the route to the out range neighbors.
‚ The DIS attack:after the attack is triggered, the malicious nodes will send the DIS messages periodically to its neighbors. The DIS messages can be sent two ways, which will lead to a different response from the receivers. The first way is to broadcast DIS, the receivers upon receive will have to reset the DIO timer as they realize that there is something with the topology around. The second way is to unicast this DIS message to all nodes in the neighbor list, the receivers upon receive will unicast DIO message to the sender. Both of these ways add more control overhead on the network.
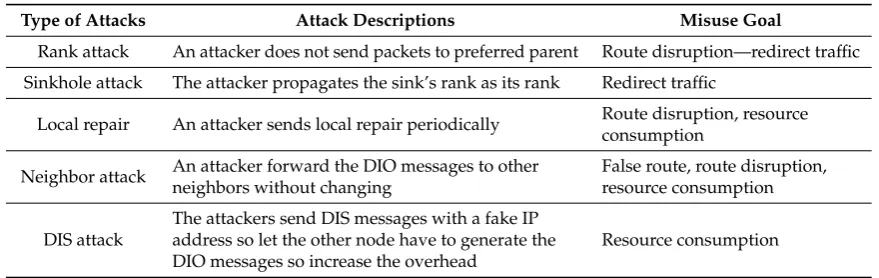
All of these presented attacks are practically shown to affect significantly RPL performance [2,3,5]. The attacks can be summarized in Table1below.
Table 1.Summary of potential internal threats towards RPL topology performance.
Type of Attacks Attack Descriptions Misuse Goal
Rank attack An attacker does not send packets to preferred parent Route disruption—redirect traffic
Sinkhole attack The attacker propagates the sink’s rank as its rank Redirect traffic
Local repair An attacker sends local repair periodically Route disruption, resource consumption
Neighbor attack An attacker forward the DIO messages to other neighbors without changing
False route, route disruption, resource consumption
DIS attack
The attackers send DIS messages with a fake IP address so let the other node have to generate the DIO messages so increase the overhead
Resource consumption
3. A specification-Based IDS for RPL to Detect the Topology Attacks
In this section, we introduce our specification-based IDS for RPL to detect the topology attacks as presented in the previous section. Our solution consists of two phases. In the first phase, we specify the RPL in the EFSM form using the ILP technique. In detail, we simulate the RPL network operation in the normal condition extensively to get the trace files. We then define all the states that relate to the network topology stability and analyze the transitions between those states based on similar algorithms presented in [12]. As discussed in Section1, the approach of using the trace file to generate the operation rules has multiple advantages to compare with the manual approach of profiling a protocol from its documents. The generated module cannot only be improved by expert knowledge added from understanding the protocol, but also be used as a verification module for the detection. We also record the statistic of the states and their transitions as we know that the more transitions between the states, the more instable the network is. In the second phase, we translate the knowledge of the RPL profile of the detection algorithms that are implemented in the IDS agents. We discuss the process from IDS placement, how the monitoring data are collected, and how the IDS agents obtain the detections.
3.1. Profiling RPL
To profile the RPL protocol, we used the traces of legitimate protocol behaviors generated from the Contiki-Cooja simulation platform [13]. We only consider behaviors that related to the optimal and stable topology, in particular the route establishment and the route maintenance processes.
Information2016,7, 25 5 of 19
is to merge all the different operations found in each node, which are generated from Algorithm 1, to form an abstract of RPL node operations.
Algorithm 1.Extracting states and transitions
Require:Trace file from simulation with marking relevant states 1:fork=1tondo
2: fori=1toNk´1do
3: PState=StateExtract(Ni) // Get previous state from Ni 4: CState=StateExtract(Ni+1) // Get current state from Ni+1 5: CTran=NewTran(PState, CState) // Get current transition
6: ifCTranRAllTrans[k]do
7: AllTrans[k]=Add(AllTrans[k],CTran) // Add transition to list
8: AllTransStatistic[k]=AddStatistic(AllTrans[k],CTran) // Add statistic
9: else
10: AllTransStatistic[k]=AddStatistic(AllTrans[k],CTran) // Add statistic
11: end if
12: end for
13:end for
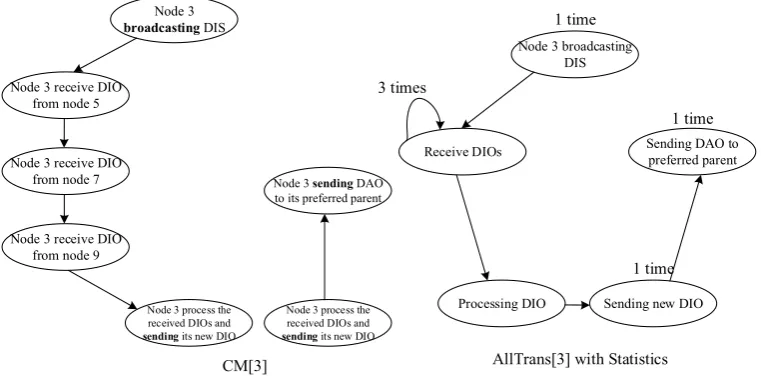
At the end of Algorithm 1, we generate a set of concrete states, transitions, and corresponding statistic data for each node. For example, we extract the relevant trace to node 3 and observe the following messages: [Node 3 broadcasts DIS—Node 3 receives DIO from node 5—Node 3 receives DIO from node 7—Node 3 receives DIO from node 9—Node 3 calculates the preferred parent and send a new DIO]. This trace then will be recorded as [Node 3 broadcast DIS—Node 3 receives DIOs (3 times)—Node 3 process received DIO—Node 3 send a new DIO]. Figure1illustrates an example of the results recorded from Algorithm 1 for node 3. As can be seen from the figure, the flow of the in and out control messages to node 3 is represented in CM [3] on the left, while the transition merge and relevant statistics are represented in AllTrans [3] on the right.
Information 2016, 7, 25
DIO from node 7—Node 3 receives DIO from node 9—Node 3 calculates the preferred parent and send a new DIO]. This trace then will be recorded as [Node 3 broadcast DIS—Node 3 receives DIOs (3 times)—Node 3 process received DIO—Node 3 send a new DIO]. Figure 1 illustrates an example of the results recorded from Algorithm 1 for node 3. As can be seen from the figure, the flow of the in and out control messages to node 3 is represented in CM [3] on the left, while the transition merge and relevant statistics are represented in AllTrans [3] on the right.
Figure 1. Example of the results of Algorithm 1.
The results of the Algorithm 1 are sets of states, transitions and corresponding statistic for each node. Algorithm 2 will merge those sets one by one to form an abstract of RPL operation. The results of the Algorithm 1 are sets of states, transitions and corresponding statistic for each node. Algorithm 2 will merge those sets one by one to form an abstract of RPL operation.
Algorithm 2. Form the specification-based IDS for RPL
Require:AllTrans[k], AllTransStatistic[k], k = 1,..., n
1: FinalSpe = AllTrans[1]
2: FinalSpeStatistic = AllTransStatistic[1]
3: fork = 1tondo
4: FinalSpe = Merge(FinalSpe, AllTrans[k])
5: FinalSpeStatistic = Merge(FinalSpeStatistic, AllTransStatistic[k]
6:end for
The Merge function first compares the states that two Transitions have. It only adds to the FinalSpe the states and transitions that it does not have yet. It also compares the statistic pattern and only record the pattern with significant different trend.
At the end of Algorithm 2, we obtain a Specification-based module as shown in Figure 2 below. Node 3 receive DIO
from node 5
Node 3
broadcasting DIS
Node 3 receive DIO from node 7
Node 3 receive DIO from node 9
Node 3 process the received DIOs and
sending its new DIO
Node 3 sending DAO to its preferred parent
Node 3 broadcasting DIS
Receive DIOs
Processing DIO
Sending DAO to preferred parent
Sending new DIO 3 times
1 time
1 time 1 time
CM[3] AllTrans[3] with Statistics
Node 3 process the received DIOs and
sending its new DIO
Figure 1.Example of the results of Algorithm 1.
Algorithm 2.Form the specification-based IDS for RPL
Require:AllTrans[k],AllTransStatistic[k],k = 1,..., n
1:FinalSpe=AllTrans[1]
2:FinalSpeStatistic=AllTransStatistic[1]
3:fork = 1tondo
4: FinalSpe=Merge(FinalSpe,AllTrans[k])
5: FinalSpeStatistic=Merge(FinalSpeStatistic,AllTransStatistic[k]
6:end for
The Merge function first compares the states that two Transitions have. It only adds to the FinalSpe the states and transitions that it does not have yet. It also compares the statistic pattern and only record the pattern with significant different trend.
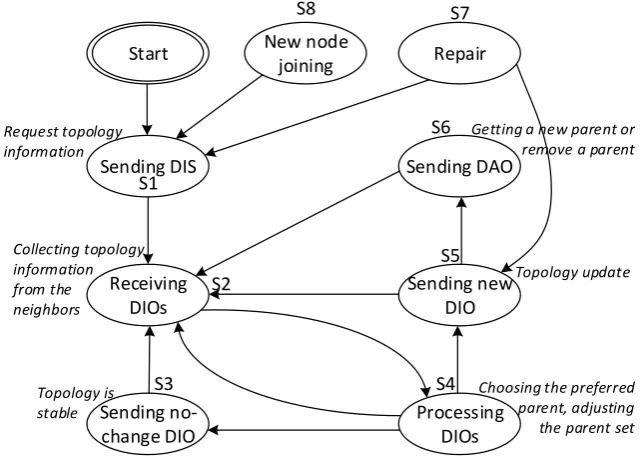
At the end of Algorithm 2, we obtain a Specification-based module as shown in Figure2below. Information 2016, 7, 25
Figure 2. Specification-based IDS for RPL through trace file analysis.
The generated RPL specification module consists of 8 states: The sending DIS, sending DIO, receiving DIO (DIOr), sending no-change DIO, processing DIOs, sending new (changed) DIO, Sending DAO, repair, and new node joining. From the statistical data recorded, we obtain the following observations:
(i) Nodes only move to the Sending DIS state when it first starts, joins, or involves in a link repair procedure. As a result, nodes only visit the Sending DIS state few times during the network performance.
(ii) Nodes in the center tend to have more transitions to nodes in the border. The reasons are that center nodes have more neighbors than border nodes, while their neighbors are also more likely to update the routing information than the border nodes’ neighbors.
(iii) In the processing DIOs state, nodes have to strictly follow the rank rule.
(iv) After a long enough time of running, when the network topology becomes stable, the node will visit mostly the Sending no-change DIO state. However, such visit is not too often, because the DIO trickle time is always extended in a stable network.
(v) The five states sending DIS, sending new DIO, sending DAO, repair, and new node joining indicate the instability of the network topology. When the node is in one of these states, the transitions are expected to happen more often, because the DIO trickle time is set to minimum.
In the next section, we will use the knowledge obtained from this section to design and implement a Specification-based IDS in the RPL network.
3.2. Design and Implementation of the Specification-Based IDS for RPL-Based Network
3.2.1. Placement of IDS Agents
IDS agents are placed into the network through the three common methods, the host-based, network-based or the hybrid. The host-based IDS implements the detection module in every node of the network. Each node will act as a monitoring node to monitor the operation of all of its
Start
Sending DIS
Receiving DIOs
Processing DIOs Sending
no-change DIO
Sending new DIO Sending DAO New node
joining Repair
Getting a new parent or remove a parent
Topology update
Choosing the preferred parent, adjusting the parent set Request topology
information
Collecting topology information from the neighbors
Topology is stable
S1
S2
S3 S4
S5 S6
S7 S8
Figure 2.Specification-based IDS for RPL through trace file analysis.
The generated RPL specification module consists of 8 states: The sending DIS, sending DIO, receiving DIO (DIOr), sending no-change DIO, processing DIOs, sending new (changed) DIO, Sending DAO, repair, andnew node joining. From the statistical data recorded, we obtain the following observations:
(i) Nodes only move to the Sending DIS state when it first starts, joins, or involves in a link repair procedure. As a result, nodes only visit the Sending DIS state few times during the network performance.
(ii) Nodes in the center tend to have more transitions to nodes in the border. The reasons are that center nodes have more neighbors than border nodes, while their neighbors are also more likely to update the routing information than the border nodes’ neighbors.
(iii) In theprocessing DIOsstate, nodes have to strictly follow the rank rule.
(iv) After a long enough time of running, when the network topology becomes stable, the node will visit mostly theSending no-change DIOstate. However, such visit is not too often, because the DIO trickle time is always extended in a stable network.
Information2016,7, 25 7 of 19
In the next section, we will use the knowledge obtained from this section to design and implement a Specification-based IDS in the RPL network.
3.2. Design and Implementation of the Specification-Based IDS for RPL-Based Network
3.2.1. Placement of IDS Agents
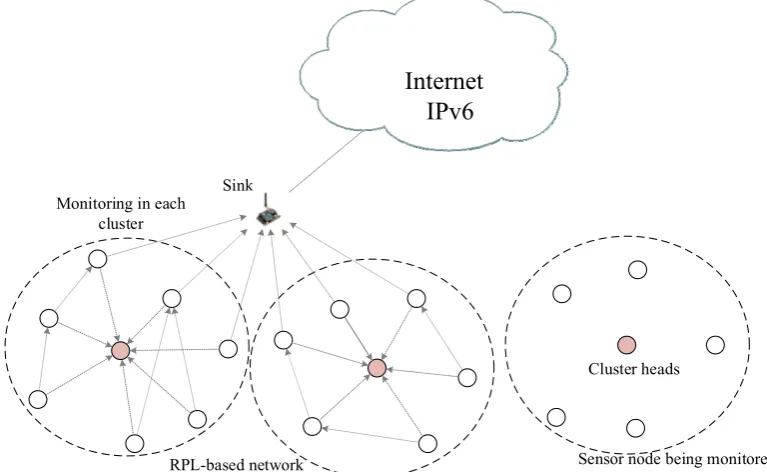
IDS agents are placed into the network through the three common methods, the host-based, network-based or the hybrid. The host-based IDS implements the detection module in every node of the network. Each node will act as a monitoring node to monitor the operation of all of its neighbors. This method creates heavy overhead and requires a lot of memory and calculation resources from the node. On the other hand, the network-based IDS implement the detection module at the sink. The necessary information for detection decision will be asked, collected from all the nodes in the network to send to the sink. This method also creates extra communication overhead, and does not guarantee that the sink will have all the information it needs, for instance, in the case when partial of the network is compromised, information from such part will not be able for the sink anymore.Information 2016, 7, 25
Figure 3. The cluster head IDS architecture.
3.2.2. IDS Data Collection
Similar to [6], we do not make the cluster head to change to promiscuous mode to eavesdrop all the radio communication around because it will drain its battery out quickly, while the obtained information in this case also has only limited use. Instead, we make the cluster head to request its members to report its topology information periodically. The period is set up depends on the particular scenario. Once the members receive such request, they need to send their neighbor lists with corresponding ranks, the preferred parent, and its own rank. Such information are already stored in the routing table of each node for the purpose of selecting its preferred parent, therefore, there will be no additional cost on storing and computation. By doing so, we save the resource for the cluster head while expanding the view to even nodes which are outside the cluster.
As nodes report information of its neighbors, a cross-check of the collected data is required. However, the cross-check process suffers from the synchronization issue when the IDS agent cannot check whether the data from the neighbor is collected later or sooner than data from the node itself. This issue was first pointed out by Matsunaga et al. [15], through the example illustrated in Figure 4 as follows. Let A is a normal node in the network and N is its neighbor. At time t1 when A broadcasting its DIO, its rank is 3 and N record rank of A as 3 in its memory. At time t2, A updates its rank to 4 but because it is not the time to send the new DIO yet, so A does not send any new DIO, and N still store the rank of A as 3. Soon after t2, at t3, the root requests nodes to send IDS information. In this case, node A will send its rank as 4 (its current rank) while node N informs the root that the actual rank of A is 3. The rank information of node A that it and node N reported is not the same because the recording time was not synchronized. This synchronization issue makes the root consider that the rank of A is not consistent, hence detect A as malicious node, which create a false detection.
Internet
Sink
RPL-based network
IPv6
Sensor node being monitored Cluster heads
Monitoring data communication RPL data communication
Monitoring in each cluster
Figure 3.The cluster head IDS architecture.
behaviors. There is always a trade-off on choosing which algorithms to apply, for example, strong algorithms may detect the threats better, however, they will consume more resource and require more data storage, which shorten the lifetime of the cluster head. In this paper, the built-in IDS algorithms (the details are in Section3.2.3) are obtained from the RPL profile in Section3.1, which only require simple threshold-comparison on collected data, so they are light-weight and will not affect significantly the operation of the cluster heads. Moreover, as being assigned the data collection and decision making roles, cluster head can be usually provided more resource like battery power and memory to deal with such additional IDS work. This architecture can reduce the communication overhead significantly to compare with the host-based method, while providing more robust decision than the network-based method due to full and quick access to the detection information it needs.
3.2.2. IDS Data Collection
Similar to [6], we do not make the cluster head to change to promiscuous mode to eavesdrop all the radio communication around because it will drain its battery out quickly, while the obtained information in this case also has only limited use. Instead, we make the cluster head to request its members to report its topology information periodically. The period is set up depends on the particular scenario. Once the members receive such request, they need to send their neighbor lists with corresponding ranks, the preferred parent, and its own rank. Such information are already stored in the routing table of each node for the purpose of selecting its preferred parent, therefore, there will be no additional cost on storing and computation. By doing so, we save the resource for the cluster head while expanding the view to even nodes which are outside the cluster.
As nodes report information of its neighbors, a cross-check of the collected data is required. However, the cross-check process suffers from the synchronization issue when the IDS agent cannot check whether the data from the neighbor is collected later or sooner than data from the node itself. This issue was first pointed out by Matsunagaet al.[15], through the example illustrated in Figure4as follows. Let A is a normal node in the network and N is its neighbor. At timet1when A broadcasting its DIO, its rank is 3 and N record rank of A as 3 in its memory. At timet2, A updates its rank to 4 but because it is not the time to send the new DIO yet, so A does not send any new DIO, and N still store the rank of A as 3. Soon aftert2, att3, the root requests nodes to send IDS information. In this case, node A will send its rank as 4 (its current rank) while node N informs the root that the actual rank of A is 3. The rank information of node A that it and node N reported is not the same because the recording time was not synchronized. This synchronization issue makes the root consider that the rank of A is not consistent, hence detect A as malicious node, which create a false detection.
Information2016,7, 25 9 of 19 Information 2016, 7, 25
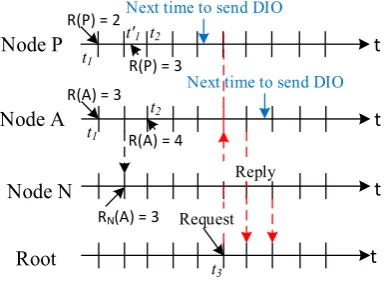
Matsunaga et al. [15] proposes an improvement by letting the nodes send only the rank information in its latest broadcast DIO, rather than the latest rank it has. Moreover, they separate the rank inconsistent threshold when detecting the consistency, in which if there is time difference when receiving the report rank (information from the node itself) and the monitor rank (information from the node’s neighbors), the threshold will be higher than it in the case there is no time difference. However, this solution still cannot overcome the synchronization issue in some of the cases. For instance, based on Figure 4, in Figure 5, we added node P as node A’s parent and N is the neighbor of both A and P. At time t1, P has rank 2, A has rank 3. In time t’1, P update its rank to 3, hence it broadcasts this new information to the neighbors. At time t2, node A receives this information and increase its new rank to 4 without updating its rank for the neighbor yet. At time t3, the root request every node to send IDS information. According to Matsunaga, P will report its rank as 3 because it already sends the new DIO before the root request. On the other hand, node A will also report its rank as 3 because its next DIO is scheduled after the root asking for report. Both of these reports are considered consistent under the view of node N. Now, A and P has the same rank as 3, both are considered consistent, but according to the rank rule, P is the parent of A so it should have a lower rank than A. As a result, both A and P may be considered as malicious source.
Figure 4. Synchronization issue in Raza’s solution.
Figure 5. Synchronization issue in Matsunaga’s solution.
Node A
Node N
Root R(A) = 3
RN(A) = 3 Request
Node N reports Node A rank = 3 while Node A reports its rank = 4 t1
t2
R(A) = 4
t
t
t
t3
Next time to send DIO
Reply
Node A
Node N
Root R(A) = 3
RN(A) = 3 Request
Node A reports its rank as 3, Node N reports A has rank 3 Node P reports its rank as 3, Node N reports P has rank 3 P is the parent of A and has the same rank with A Both A, P may be detected as malicious
t1
t2
R(A) = 4
t
t
t
t3
Next time to send DIO Node P
R(P) = 2
t1
t2
R(P) = 3
t
Next time to send DIO
t'1
Reply
Figure 4.Synchronization issue in Raza’s solution. Information 2016, 7, 25
Matsunaga et al. [15] proposes an improvement by letting the nodes send only the rank information in its latest broadcast DIO, rather than the latest rank it has. Moreover, they separate the rank inconsistent threshold when detecting the consistency, in which if there is time difference when receiving the report rank (information from the node itself) and the monitor rank (information from the node’s neighbors), the threshold will be higher than it in the case there is no time difference. However, this solution still cannot overcome the synchronization issue in some of the cases. For instance, based on Figure 4, in Figure 5, we added node P as node A’s parent and N is the neighbor of both A and P. At time t1, P has rank 2, A has rank 3. In time t’1,P update its rank to 3, hence it broadcasts this new information to the neighbors. At time t2, node A receives this information and increase its new rank to 4 without updating its rank for the neighbor yet. At time t3, the root request every node to send IDS information. According to Matsunaga, P will report its rank as 3 because it already sends the new DIO before the root request. On the other hand, node A will also report its rank as 3 because its next DIO is scheduled after the root asking for report. Both of these reports are considered consistent under the view of node N. Now, A and P has the same rank as 3, both are considered consistent, but according to the rank rule, P is the parent of A so it should have a lower rank than A. As a result, both A and P may be considered as malicious source.
Figure 4. Synchronization issue in Raza’s solution.
Figure 5. Synchronization issue in Matsunaga’s solution.
Node A
Node N
Root R(A) = 3
RN(A) = 3 Request
Node N reports Node A rank = 3 while Node A reports its rank = 4 t1
t2
R(A) = 4
t
t
t
t3
Next time to send DIO
Reply
Node A
Node N
Root R(A) = 3
RN(A) = 3 Request
Node A reports its rank as 3, Node N reports A has rank 3 Node P reports its rank as 3, Node N reports P has rank 3 P is the parent of A and has the same rank with A Both A, P may be detected as malicious
t1
t2
R(A) = 4
t
t
t
t3
Next time to send DIO Node P
R(P) = 2
t1
t2
R(P) = 3
t
Next time to send DIO
t'1
Reply
Figure 5.Synchronization issue in Matsunaga’s solution.
In order to solve the synchronization issue as raised above, we propose to add the sequence number information in the DIO and DIS messages in order to make the cross-check more reliable. We will use the reserved bytes in the DIO and DIS message format (readers can refer to [1] for the format of DIO and DIS message) for this purpose, so the actual size of such messages will remain the same. The synchronization issue is solved because the sequence number indicates specifically which packets the information belongs to; hence the agent can cross-check only the sources that have the same sequence to eliminate any mistake caused from the unsynchronized communication.
Finally, the IDS agent will record the following information for each of its members:
‚ DIS sequence, number of DIS received
‚ DIO sequence, number of DIO received
‚ List of neighbors, each neighbor has
# Node ID
# Rank
# The sequence of the DIO that provides this info
# DIS sequence, number of DIS received
# DAO sequence, number of DAO received, and a parent bit (if there is no DAO message sent, or if there is a DAO message require to remove the parent relationship, then the parent bit is 0, otherwise it will be set to 1)
Such information will be collected and sent periodically to the IDS agents. Upon receiving the IDS data, the IDS agents will apply relevant algorithms to detect any malicious behaviors of the cluster members.
3.2.3. Detection at the IDS Agent
Algorithm 3 shown a detection algorithm that we developed based on the RPL profile discussed in Section3.1and the collected data given in Section3.2.2. The detection algorithm would be executed as an IDS agent at Cluster head. The algorithm consists of 5 modules:
‚ Module 1: Checking the DIS message, alarm if the received DIS is fake or sending too much.
‚ Module 2: Checking the sequence of DIO message, alarm if the received DIO is fake
‚ Module 3: Checking the rank consistency, alarm if the rank of the member is different to the rank reported by its neighbors or the cluster head, given the same DIO sequence. Penalize the neighbors if they do not have the latest DIO message. Alarm if there is any DIO message reported by the neighbors or cluster head that has newer DIO sequence than the member itself
‚ Module 4: Check the rank rule between every pair of parent and child
‚ Module 5: Check the instability of the network area around a member through the relevant states and observations in Section3.1. Penalize if there is any instability.
The detail algorithm is as below.
Algorithm 3.Detecting topology attacks from cluster head view
Module 1:Check whether DIS message is illegitimate
1:On receivingDIS{
2: recordSourceID,DIS_seq_new; 3: DIS_count[SourceID]++;
4: ifDIS_seq_newďDIS_seq_currentthen
5: alarmfake DIS;
6: elseDIS_seq_current=DIS_seq_new
7: end if
8: ifDIS_count[SourceID]> thresholdDIS_countthen 9: alarmDIS attack;
10: end if}
Module 2:Check whether there is any fake DIO
1:On receivingDIO{
2: recordSourceID, DIO_seq_new,rank; 3: DIO_count[SourceID]++;
4: ifDIO_seq_newďDIO_seq_currentthen
5: alarmfake DIO;
6: elseDIO_seq_current=DIO_seq_new
7: end if}
Module 3:Check the rank inconsistency
1: After receiving reports from all of the members { 2: for eachMemberinClusterdo{
3: ifMember.DIO_seq<CH.Member.DIO_seqthen
Information2016,7, 25 11 of 19
Algorithm 3.Detecting topology attacks from cluster head view
Module 3:Check the rank inconsistency
6: for eachNeighbourinMember.Neighbourdo
7: ifMember.DIO_seq < Neighbour.Member.DIO_seqthen
8: alarmfake DIO;
9: else ifMember.DIO_seq < Neighbour.Member.DIO_seqthen
10: Neighbour.fault = Neighbour.fault + 0.5 //penalised
11: else ifMember.DIO_seq=Neighbour.Member.DIO_seqthen
12: ifMember.rank != Neighbour.Member.Rankthen
13: alarmfake DIO;
14: end if
15: end if
16: end for
17: end for} }
Module 4:Check the rank rule
1: for eachMemberinClusterdo
2: ifMember.rank + MinHopRankIncrease < Member.parent.rankthen
3: alarmrank attack; 4: end if
5: for eachNeighbourinMember.Neighbourdo{ 6: ifMember.DAO.parent == 1then
7: ifMember.rank – MinHopRankIncrease > Member.child.rankthen
8: alarmrank attack;
9: end if
10: end if
11: end for
12:end for}
Module 5:Check the stability of the network part which relate to a cluster member
//Setting the initial stability evaluation for each member in cluster 1:for eachMemberinClusterdo
2: Member.stability=thresholdstability 3:end for
//Penalise if stability condition is observed to be not satisfied 4:for eachMemberinCluster{
5: ifIsRepairAfterPeriodthen
6: Member.stability -= 2//penalised–2 on stability
7: end if
8: ifIsChangeAfterPeriod(Member.DIO)||IsChangeAfterPeriod(Member.DAO)||
IsNewNodeJoiningAfterPeriodthen
9: Member.stability -= 0.5//penalised 0.5 on stability
10: end if}
//Checking every period of time 11:ifIsCheckingPeriodthen
12: for eachMemberinClusterdo
13: ifMember.stability<0then
14: alarmMember instability;
Algorithm 3.Detecting topology attacks from cluster head view
Module 5:Check the stability of the network part which relate to a cluster member
16: ifMember.fault>thresholdfaultthen
17: alarmMember fault; // member fault is recorded in module 3
18: end if
19: end for
20:end if
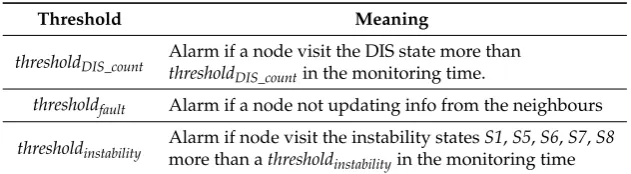
The thresholds used in the algorithm are summarized in Table2below.
Table 2.The thresholds used in the algorithm.
Threshold Meaning
thresholdDIS_count Alarm if a node visit the DIS state more thanthreshold DIS_countin the monitoring time.
thresholdfault Alarm if a node not updating info from the neighbours
thresholdinstability Alarm if node visit the instability statesmore than athreshold S1,S5,S6,S7,S8 instabilityin the monitoring time
4. Evaluation Results and Discussion
To investigate further the effectiveness of the IDS, we implement the five types of attacks as discussed in Section3in Contiki-Cooja [13] and see how the IDS module can detect them. This session first presents the simulation setup, evaluation metrics, and then discuss about the results achieved.
4.1. Simulation Set up
Our simulation scenario consists of a total of 100 nodes placed randomly in a 600ˆ600 m area, each node has a transmission range of 50 m. The topology setup is shown in Figure6below. There is one sink placed in the center (node ID: 1 with dot pattern in Figure6) and 11 IDS cluster heads (the grey nodes) to cover the operation of the remaining 88 nodes in the network (the white nodes). Every node sends packet to the sink at the rate of 1 packet every 60 s. Data specified in Section3.2.2is collected and sent to the cluster heads every 2 min. We implement the specification-based module from Section3in the IDS cluster heads to analyze the collected trace data. The thresholds are set up based on analyzing the statistical data in the trace files with the following values:thresholdDIS_count= 3, thresholdfault= 2, andthresholdinstability= 10.
We implemented each of the five types of attacks as discussed in Section2in random positions of 88 normal senders. For each of the attack scenario, there will be one random node in the 88 normal nodes to be injected the relevant attack code. The attacks are initiated after 3 min when the topology establishment phase is done. The summary of the simulation parameters is shown in Table3below.
Table 3.The simulation parameters.
Parameters Value
Simulation platform Cooja Contiki 2.6 Number of nodes 99 senders, 1 sink Number of cluster head 11
Number of attackers 1 Traffic model Constant bit rate Sending rate 1 packet every 60 s IDS require info every 2 min
Information2016,7, 25 13 of 19 Information 2016, 7, 25
Figure 6. Topology set up.
4.2. Evaluation Metrics
Evaluation metrics include metric to evaluate the accuracy of the IDS and the level of overhead to compare with the network operating without IDS. Metrics to evaluate the accuracy of an IDS is mainly the True Positive Rate and the False Positive Rate. The True Positive rate can also be called the Detection Rate as it shows how good the IDS is at detecting the malicious behaviors. On the other hand, the False Positive rate represents the falsification of the IDS as it shows how bad the IDS can be at falsifying to detect a legitimate behaviors. The formula to calculate these two metrics are:
True Positive Rate (TPR):TP =
False Positive Rate (FPR):FN =
where
• True Positive (TP): is the total correctly detected malicious behaviours. This happens when the IDS correctly raise alert on a malicious event.
• False Positive (FP): happens when the IDS erroneously raises a false alarm over a legitimate behaviour in the network.
• True Negative (TN): happens when the IDS correctly judging a legitimate behaviour as normal. 1 2 3 4 5 6 7 8 9 10 11 12 13 14 15 16 17 18 19 20 21 22 23 24 25 26 27 28 29 30 31 32 33 34 35 36 37 38 39 40 41 42 43 44 45 46 47 48 49 50 51 52 53 54 55 56 57 58 59 60 61 62 63 64 65 66 67 68 69 70 71 72 73 74 75 76 77 78 79 80 81 82 83 84 85 86 87 88 89 90 91 92 93 94 95 96 97 98 99 10 0
Figure 6.Topology set up.
4.2. Evaluation Metrics
Evaluation metrics include metric to evaluate the accuracy of the IDS and the level of overhead to compare with the network operating without IDS. Metrics to evaluate the accuracy of an IDS is mainly the True Positive Rate and the False Positive Rate. The True Positive rate can also be called the Detection Rate as it shows how good the IDS is at detecting the malicious behaviors. On the other hand, the False Positive rate represents the falsification of the IDS as it shows how bad the IDS can be at falsifying to detect a legitimate behaviors. The formula to calculate these two metrics are:
True Positive RatepTPRq: TPrate“ TP TP`FN
False Positive RatepFPRq: FNrate “ FP FP`TN where
‚ True Positive (TP): is the total correctly detected malicious behaviours. This happens when the IDS correctly raise alert on a malicious event.
‚ False Positive (FP): happens when the IDS erroneously raises a false alarm over a legitimate behaviour in the network.
‚ True Negative (TN): happens when the IDS correctly judging a legitimate behaviour as normal.
The impacts to the resource consumption are evaluated utilizing the network energy usage and node power consumption as presented in [6]. The formula to calculate these metrics are as follow:
Energy usagepmJq
“ p19.5mAˆtransmit`21.8mAˆlisten`1.8mAˆCPU
`0.0545ˆLPMq ˆ3 V{4096ˆ8
(1)
Power Consumption pmWq “ EnergyusagepmJq
Timepsq (2)
The more energy and power the network uses, the shorter its lifetime is.
4.3. Simulation Results and Discussion
4.3.1. Detection Efficency
We divided the attacks into two groups which have similar results when detected by our IDS. The first group contains the Rank attack, Sinkhole attack, and Neighbor attack—the threats which are detected only by the specified states. The second group includes the local repair and the DIS attacks, which involved both the specification states and statistic collection to reveal.
Table4below shows the TPR and FPR of the Rank attack, Sinkhole attack and the Neighbor attack after 4 min, when the Rank attack already initiated (at the third minute) and the IDS has just collected the first two IDS data packets from its neighbor. As can be seen from the table, we obtained ideal IDS results, where the TPR is 100% and the FPR is 0%. These results can be explained as follows.
The DIO sequence checking in Modules 2 and 3 ensure that there is no inconsistency in DIO and Rank information between the IDS data reported by the neighbours. As a result, the cluster head will know most of the parent—child relationships and their accurate corresponding ranks.
Regarding the Rank attack, given its nature which is choosing the worst parent as the preferred parent and changing it frequently, the cluster head will detect the behaviour of breaking the rank rule and raise alarm about the child node for choosing inappropriate parent. Therefore, the Rank attack is detected quickly with high accuracy.
Regarding the Sinkhole attack, our implementation lets the attacker keeps informing that it has the rank of the Sink to attract its neighbours. As the attacker is not the actual Sink, before initiating the attacks, it would have a preferred parent. Moreover, this parent-child relationship would be recorded by one of the cluster heads. When the attacker manipulates its new rank to the Sink’s rank, such relationship will become illegal, because the child now has a better rank than the parent. This illegal relation will be detected by Module 4 of our IDS.
Regarding the neighbor attack, the neighbor attack involves some DIO replications, which will be detected by Modules 2 and 3 through the DIO duplication of the sequence number received. This detection is straightforward, fast and accurate because it does not need to collect much IDS information to decide.
Table 4.TPR and FPR of Rank attack, sinkhole attack and Neighbor attack after 4 min.
FP TP FN TN TPR (%) FPR (%)
RA 0 88 0 7656 100 0
SA 0 88 0 7656 100 0
NA 0 88 0 7656 100 0
Information2016,7, 25 15 of 19
NA scenarios are shown in Table5below. The figure shows that the FPR increase to about 2%–5%. The reason is that the initiated attacks in the tampered nodes have affected its neighbors around, make those nodes work the same way as the attackers, and therefore become difficult to separate.
Table 5.TPR and FPR of Rank attack, sinkhole attack and Neighbor attack after 10 min.
FP TP FN TN TPR (%) FPR (%)
RA 402 88 0 7254 100 5.25
SA 251 88 0 7405 100 3.28
NA 202 88 0 7454 100 2.64
In order to minimize the FPR, the nodes which are detected as the malicious source should be removed from the network, for example, by adding to a blacklist and asking all other relevant nodes to skip nodes in that list. After removing the nodes, the IDS will stop judging for a certain time to help to stabilize the network before restarting in a new detection cycle.
The second group of attacks includes the Local repair and the DIS attack. The difference to compare with the first group is that in this group, observing that a node visit a state is not enough to conclude this node to be malicious. This observation is only considered as part of the statistic evidences. Only when a node visits a state more than a threshold of times during a period, the IDS has the right to raise alarm about the threat.
The mechanisms to detect attacks in the second group are as follows. In local repair attack, after initiating the local repair mechanism, the node sends the poison messages to the neighborhood in which its rank is reset to be infinite and it needs to resend the DIS to obtain the routing information around. The local repair will be reported after several times initiated according to Module 1. On the other hand, the local repair also invokes the high instability value in Module 5, so it will also be reported by this module.
In the DIS attack, the attacker needs to send DIS messages to force the neighbor to change the DIO trickle time, or to send the unicast DIO back. In any case, it will increase the DIS statistic in Module 1 and will be reported by the DIS.
Tables6and7below present the TPR and FPR detection of this group after 8 and 12 min. As can be seen from the figures, after 8 min, the IDS may not collect enough information in any of the cases so it cannot detect the Local repair attack and DIS attack, which results in a high FN and low TPR. On the other hand, after 12 min, the IDS collect all the needed information, so the FN and TPR are ideal. However, the Local repair and DIS attack is given long time enough to manipulate the neighbors around the malicious node to create the instability in the topology. Such instability is presented through the high rate of FP and FPR which make the IDS become less accurate because of detecting normal nodes as attackers. Therefore, there is a tradeoff between the TPR and FPR in detecting threats in this group.
Table 6.TPR and FPR of Rank attack, sinkhole attack and Neighbor attack after 8 min.
FP TP FN TN TPR (%) FPR (%)
LA 51 76 12 7605 86.36 0.67
DIS 232 83 5 7424 94.32 3.03
Table 7.TPR and FPR of Rank attack, sinkhole attack and Neighbor attack after 12 min.
FP TP FN TN TPR (%) FPR (%)
LA 519 88 0 7137 100 6.78
Unlike the first group of attacks, where the attackers are always detected first before any FP happens, in the second group, a benign node can be detected as malicious before the attackers are revealed. Therefore, using a blacklist or other mechanism to eliminate the detected nodes in this case may not be appropriate. An alternative solution is to adjust the frequency threshold to adapt to the frequency of the corresponding Local repair/DIS attack in specific scenario through learning from simulation. A good chosen threshold will optimize the detection rate and accurateness of the IDS.
It is worth to mention that in general, the specification-based IDS has the ability to detect the new attacks because it focuses on checking the legitimacy of the protocol operation rather than on any specific attack behaviors. Similarly, our proposed IDS aims at monitoring the optimal network topology and its stability as a whole, which is broader than just verifying illegitimate behaviors created by some specific internal attacks. Hence, it will also have the ability to detect other topology attacks which are not mentioned in this paper, if those attacks breaking the optimal topology or create network instability.
4.3.2. Energy Efficiency
We run the simulation in RPL-collect network (the sink collect environment data from every other nodes) with and without our IDS integration and obtain the energy and power consumption as calculated in Formulas (1) and (2) in Section4.2. In normal RPL network, the energy is around 190J, while in the RPL with IDS integration, the average energy consumption is about 202J, which represents an increase of 6.3%. This is a lot more saving to compare with the IDS in [6], where the overhead is 30% for a setup of 64 nodes (the overhead would be larger if they setup for the same 100 nodes like our setup). The reason for this saving is that we only limit the IDS work locally, where monitoring nodes only need to deal with 8–12 nodes in average, instead of sending all the IDS data to one IDS center. In this paper, we implement between 8 and 12 nodes in each cluster for the experiment set-up. In other scenarios with denser network, the number of nodes in each cluster can be higher, which leads to slightly more energy consumption. Besides, the average power consumption in each node increases slightly 6.3% with 1.2 mW in IDS integration scenario to compare with 1.05 mW in normal scenario. This indicates that the network lifetime will not be affected much once implementing the IDS.
5. Further Considerations on Expanding the IDS Capability to Detect More Internal Threats
Information2016,7, 25 17 of 19
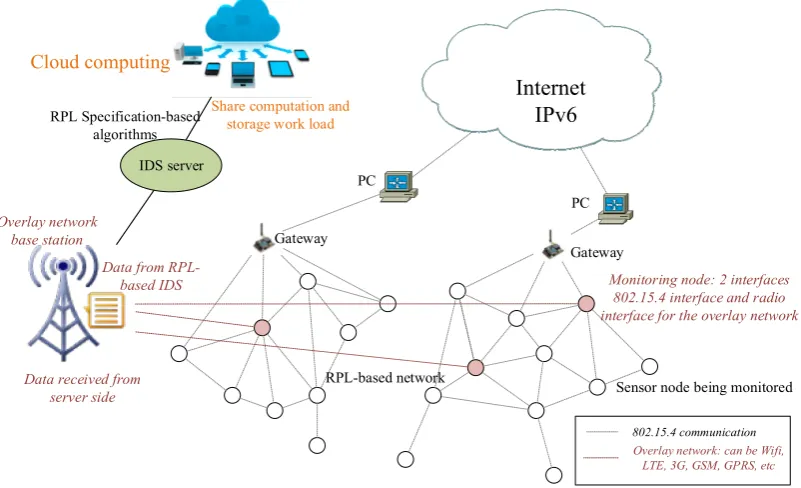
To enable the use of a more robust anomaly-based IDS working on a larger amount of monitoring data, we envisage an architecture that can extend the computation and storage capability of the IDS massively, yet still keep the network overhead low and acceptable for operating. In detail, we extend the cluster monitoring architecture by first making benefit from the multiple-interface design that allows the sensor devices to communicate in different channels. One real life example is the Libelium Waspmote devices that allow many wireless communication standards such as Wifi, 3G, GSM, GPRS, LoRa, and so on apart from sensor data transmission [16]. We can use the multi-interface sensor devices as the cluster heads to communicate both in RPL-based network and another overlay network, which supports high speed, long distance, and low power consumption transmission. There are many options for such overlay network, for example, the IEEE 802.11, LTE, 3G,etc. By doing so, we aim at transferring the IDS monitoring data directly to an IDS server through the overlay network by the extra interface. To compare with the network-based architecture, sending IDS data to the server through the overlay channel will eliminate many communicational issues such as overhead, delay, packet loss,etc. Moreover, we propose to implement the Cloud Computing [17] application at the IDS server. The IDS work deal by the server only before now can be delegated to many other computers in the Cloud, which helps to enable the IDS computation and storage capability massively. The additional cost for implementing this architecture is only a little, given the reasonable price of multi-interface cluster heads, IDS data collection, and Cloud Computing service. The benefit of this architecture will be the allowance to use many robust IDS algorithms on large amounts of IDS data, so as to have higher accuracy in dealing with many other internal threats effectively, while can be scalable well in large-scale network. An illustration of this vision can be seen in FigureInformation 2016, 7, 25 7below.
Figure 7. Extensive capability IDS architecture designed for enabling other robust detecting techniques.
6. Conclusions
This paper aimed at detecting the attacks on the RPL based network topology that jeopardizing the network operational optimality and stability. The considered attacks include the Rank, the Sinkhole, the Local Repair, the Neighbor, and DIS attack. These threats can affect different aspects of network performance, from directly such as increase the end to end delay or create more packet loss, to indirectly like exhausting the resources of the nodes by communicational and computational overhead. Our detection solution involves semi-auto building a specification-based IDS model for protecting RPL-based network topology. The main idea is to learn the states, transitions, and relevant statistic based on the analyzing the trace file. The generated model will be integrated in the IDS server, which connects to the network through many cluster interfaces. The simulation results show that our IDS is energy efficiency and applicable for the large-scale networks, while providing high detection rates and accurateness in revealing most of the topology attacks. In the future, with the envisaged IDS architecture in Section 5, we would like to develop a more robust anomaly-based IDS for detecting performance-attacks type of the internal threats, for example, the black hole, selective forwarding or wormhole attack. We believe the extension of IDS capability in storage and computation will allow detection of internal threats more accurately and efficiently.
Acknowledgments: We thank our colleagues from Middlesex University and Queen Mary University of London who provided insight and expertise that greatly assisted the research on its early design. We are also grateful to the two anonymous reviewers for their valuable suggestions.
Author Contributions: Jonathan Loo jointly conceived the study with Anhtuan Le designed the attack experiment, IDS architecture, profiling model, and prepared the manuscript; Anhtuan Le implemented the model and experiments, created the analytic model with contributions from Kok Keong Chai and Mahdi Aiash; Kok Keong Chai supervised the analysis on RPL profile and IDS detection, and edited the manuscript; Mahdi Aiash edited the manuscript. All authors have read and approved the final manuscript.
Internet
PC
PC
Gateway
Gateway IDS server
Cloud computing
RPL-based network
IPv6
Data received from server side
Share computation and storage work load
Monitoring node: 2 interfaces 802.15.4 interface and radio interface for the overlay network
Sensor node being monitored
Overlay network base station
Data from RPL-based IDS
RPL Specification-based algorithms
802.15.4 communication Overlay network: can be Wifi,
LTE, 3G, GSM, GPRS, etc
Figure 7.Extensive capability IDS architecture designed for enabling other robust detecting techniques.
6. Conclusions
protecting RPL-based network topology. The main idea is to learn the states, transitions, and relevant statistic based on the analyzing the trace file. The generated model will be integrated in the IDS server, which connects to the network through many cluster interfaces. The simulation results show that our IDS is energy efficiency and applicable for the large-scale networks, while providing high detection rates and accurateness in revealing most of the topology attacks. In the future, with the envisaged IDS architecture in Section5, we would like to develop a more robust anomaly-based IDS for detecting performance-attacks type of the internal threats, for example, the black hole, selective forwarding or wormhole attack. We believe the extension of IDS capability in storage and computation will allow detection of internal threats more accurately and efficiently.
Acknowledgments:We thank our colleagues from Middlesex University and Queen Mary University of London who provided insight and expertise that greatly assisted the research on its early design. We are also grateful to the two anonymous reviewers for their valuable suggestions.
Author Contributions:Jonathan Loo jointly conceived the study with Anhtuan Le designed the attack experiment, IDS architecture, profiling model, and prepared the manuscript; Anhtuan Le implemented the model and experiments, created the analytic model with contributions from Kok Keong Chai and Mahdi Aiash; Kok Keong Chai supervised the analysis on RPL profile and IDS detection, and edited the manuscript; Mahdi Aiash edited the manuscript. All authors have read and approved the final manuscript.
Conflicts of Interest:The authors declare no conflict of interest.
Abbreviations
The following abbreviations are used in this manuscript:
6LoWPAN IPv6 over Low-power Wireless Personal Area Network DAO Destination Advertisement Object
DIO Destination Oriented DAG Information Objective DIS DODAG Information Solicitation
FN False Negative
FP False Positive FPR False Positive Rate LA Local Repair Attack LTE Long-Term Evolution
NA Neighbor Attack
IDS Intrusion Detection System IoT Internet of Things
RA Rank attack
RPL Routing Protocol for Low Power and lossy network
SA Sinkhole Attack
TN True Negative
TP True Positive
TPR True Positive Rate
References
1. Winter, T.; Thubert, P.; Brandt, A.; Hui, J.; Kelsey, R.; Levis, P.; Pister, K.; Struik, R.; Vasseur, J.P.; Alexander, R. RPL: IPv6 Routing Protocol for Low-Power and Lossy Network; Internet Engineering Task Force (IETF): Fremont, CA, USA, 2012.
2. Le, A.; Loo, J.; Lasebae, A.; Aiash, M.; Luo, Y. 6LoWPAN: A study on QoS security threats and countermeasures using intrusion detection system approach. Int. J. Commun. Syst. 2012,25, 1189–1212.
[CrossRef]
3. Le, A.; Loo, J.; Lasebae, A.; Vinel, A.; Chen, Y.; Chai, M. The impact of rank attack on network topology of routing protocol for low-power and lossy networks.IEEE Sens. J.2013,13, 3685–3692. [CrossRef]
4. Le, A.; Loo, J.; Luo, Y.; Lasebae, A. Specification-based IDS for securing RPL from topology attacks. In Proceedings of the 2011 IFIP Wireless Days (WD), Niagara Falls, ON, Canada, 10–12 October 2011; pp. 1–3.
Information2016,7, 25 19 of 19
6. Raza, S.; Wallgren, L.; Voigt, T. SVELTE: Real-time intrusion detection in the Internet of Things.Ad Hoc Netw.
2013,11, 2661–2674. [CrossRef]
7. Tang, J.; Huang, X.; Qian, J.; Viho, C. A FSM-based test sequence generation method for RPL conformance testing. In Proceedings of the Green Computing and Communications (GreenCom), 2013 IEEE and Internet of Things (iThings/CPSCom), IEEE International Conference on and IEEE Cyber, Physical and Social Computing, Beijing, China, 20–23 August 2013; pp. 591–597.
8. Wallgren, L.; Raza, S.; Voigt, T. Routing attacks and countermeasures in the RPL-based Internet of Things. Int. J. Distrib. Sens. Netw.2013,2013, 794326. [CrossRef]
9. Tsao, T.; Alexander, R.; Dohler, M.; Daza, V.; Lozano, A.; Richardson, M. A Security Threat Analysis for Routing Protocol for Low-Power and Lossy Networks (RPL). Available online: https://tools.ietf.org/html/ draft-ietf-roll-security-threats-06 (accessed on 6 May 2016).
10. Panos, C.; Xenakis, C.; Stavrakakis, I. A novel intrusion detection system for MANETs. In Proceedings of the 2010 International Conference on Security and Cryptography (SECRYPT), Athens, Greece, 26–28 July 2010; pp. 1–10.
11. Tseng, C.-Y.; Balasubramanyam, P.; Ko, C.; Limprasittiporn, R.; Rowe, J.; Levitt, K. A specification-based intrusion detection system for AODV. In Proceedings of the 1st ACM Workshop on Security of Ad Hoc and Sensor Networks, Washington, DC, USA, 27–30 October 2003.
12. Stakhanova, N.; Basu, S.; Wensheng, Z.; Wang, X.; Wong, J.S. Specification synthesis for monitoring and analysis of MANET protocols. In Proceedings of the 21st International Conference on Advanced Information Networking and Applications Workshops, AINAW107, Niagara Falls, ON, Canada, 21–23 May 2007;
pp. 183–187.
13. Contiki. Available online: http://www.contiki-os.org/ (accessed on 6 May 2016).
14. Mitrokotsa, A.; Karygiannis, A. Intrusion detection techniques in sensor networks. InWireless Sensor Network Security; Lopez, J., Zhou, J., Eds.; IOS press: Amsterdam, The Netherlands, 2008; pp. 251–272.
15. Matsunaga, T.; Toyoda, K.; Sasase, I. Low false alarm rate RPL network monitoring system by considering timing inconstancy between the rank measurements. In Proceedings of the 2014 11th International Symposium on Wireless Communications Systems (ISWCS), Barcelona, Spain, 26–29 August 2014; pp. 427–431.
16. Libelium. Wireless Interfaces Supported in Waspmote. Available online: http://www.libelium.com/ products/waspmote/interfaces/ (accessed on 6 May 2016).
17. Armbrust, M.; Fox, A.; Griffith, R.; Joseph, A.D.; Katz, R.; Konwinski, A.; Lee, G.; Patterson, D.; Rabkin, A.; Stoica, I.;et al.A view of cloud computing.Commun. ACM2010,53, 50–58. [CrossRef]