Analysis of the Position Estimation Error of a Local
Positioning System utilizing Mobile Anchors
Sang C. Lee1,∗, Syamsul Rizal1, and HeungJu Ahn2
1 Convergence Research Center for Future Automotive Tech., DGIST, Daegu, 42988, Rep. of Korea. 2 College of Transdisciplinary Studies, DGIST, Daegu, 42988, Rep. of KOREA
* Correspondence: [email protected]; Tel.: +82-10-4506-4556
Abstract: This paper proposes a real-time local positioning system (RT-LPs) utilizing a mobile platform equipped with three anchor nodes placed in a right-angle triangle formation for a real-time locating system (RTLS). After deriving an analytic formula to calculate the target position utilizing the measured distances among anchor nodes and the target node, we find that four parameters have an effect on the position error of the target node. The spacing between anchors is a design parameter that must be large enough to the reduce position error. However, the distance from the anchor node to the target node is an operation parameter that must be small enough to reduce the position error. Additionally, the measured ranges among the anchors and the target node have probabilistic distributions with a mean and variance, which are dominant parameters that have effects on the position error. A comparison study was conducted to determine the effects of the parameters of the target position in both a simulation and an experiment, showing rates of approximately 4% 10%. These findings indicate that our simulation can work properly with the proposed method after assuming that the distance error is a Gaussian model.
Keywords: Real-Time Local Positioning System (RTLS); Mobile Anchor; Trilateration; Global Positioning System (GPS); Local Positioning System (LPS)
1. Introduction
A global positioning system is a global navigation satellite system (GNSS) which provides geolocation and time information to receivers anywhere on Earth. This system uses a satellite in orbit above the earth to locate objects globally in real time where there is no obstacle or line of sight (LOS) to four or more GPS satellites [1–3]. When an object is hidden by buildings or any obstacle which can distort the satellite signal, GPS cannot locate it precisely. To overcome this limitation, a real-time locating system has been developed (henceforth RTLS).
RTLS is a system which can locate an object position in a local area (indoors and outdoors) [4–6]. The word local is used because the system only covers a limited area depending on the application. Anchor nodes are used in RTLS to locate target positions. Anchor nodes are radio-frequency (RF) devices which are placed in many areas and which function to measure distances to a target node. Certain methods such as the time of arrival (TOA) [7], the time difference of arrival (TDOA) [8], the received signal strength indicator (RSSI) [9,10], and the angle of arrival (AOA) [11] have been proposed in many studies to measure distances. When using the TOA method, the distance is measured by calculating the time of a signal which travels from the anchor to the target node. In the TOA method, the distance is measured by calculating the time of a signal which travels from the anchor to the target node. This method can work if the anchor and target nodes have synchronized times; otherwise, the TDOA method can be used. The TDOA method is more complex than TOA, as it calculates the time difference of each receive signal to measure the distance between two nodes. The symmetrical double-sided two-way ranging (SDS TWR) algorithm has been found to be capable of solving the synchronization problem [12]. The RSSI method can estimate the distance between two nodes by
measuring the received signal strength. In contrast, the AOA method can measure the distance using trigonometry considering an angle relative to two nodes.
Figure 1.Conventional RTLS based on a trilateration method with fixed anchors
The target position can be calculated using a trilateration technique based on the distance measurement. Trilateration is a technology that locates object positions by calculating at least of three distances from the anchor nodes [13–15], as shown in Figure1. Nodes A, B, and C are the anchor nodes, and they are equipped with GPS devices such that the anchor node positions are well known. Three circles are formed based on the distance between the anchor and the target node and meet at a single intersection, which can be denoted as the target position. Every problem in a positioning system comes from distance error measurements. This error always occurs in the actual application and has an effect on the accuracy and precision of the position. Accuracy refers to the capacity of a measurement to give results close to the true value of the measured quantity, while precision refers to the capability of measuring to give the same reading when repetitively measuring the same quantity under the same conditions. These two factors are parameters which determine whether the system is reliable. In RTLS, accuracy is related to the mean (µ), while precision is related to the variance (σ2) [16].
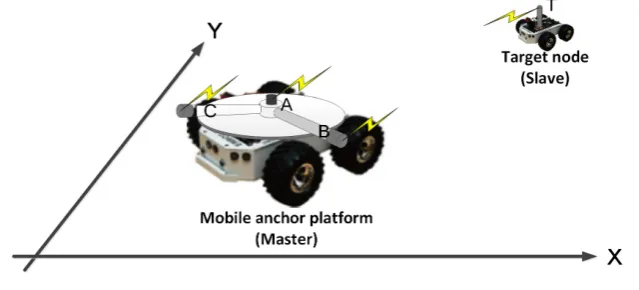
Figure 2.Mobile anchor nodes on the robot platform for master-slave robots following application
position and analyzed the effect of the mean and variance on the positioning accuracy. Generally, in RTLS many anchor nodes are needed to cover an area, but using many such nodes will incur high costs and increase the energy consumption. To reduce the number of anchor nodes, the optimal position of the anchor nodes has been proposed. The system is designed so that it can be placed on a mobile robot platform, as indicated in Figure2. By placing three anchor nodes on one robot platform, the anchor can move and locate the target position anywhere without a boundary of the coverage area. Example applications for this mobile anchor system include an automatic golf trolley and an automatic cart in a market.
2. Global Positioning System (GPS) vs. Local Positioning System (LPS)
In this section, the difference between absolute and relative positioning is described. Absolute positioning finds a position known in a global area utilizing GPS in the normal manner. We need satellites to calculate the absolute position in this case. GPS can locate an object around the earth with the longitude and latitude position, but it cannot locate objects hidden under other objects, such as in a building or in a forest, for instance. To address these indoor problems, RTLS is required to locate the object locally. The relative position is defined with reference to another position (anchor node). The anchor node can become the reference node and measure the distance to the target node to obtain the relative distance. Subsequently, the relative position can be calculated based on the relative distances.
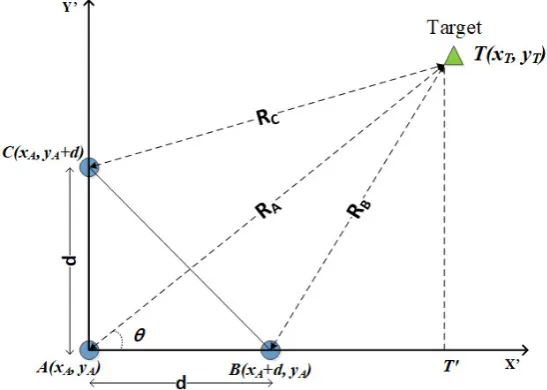
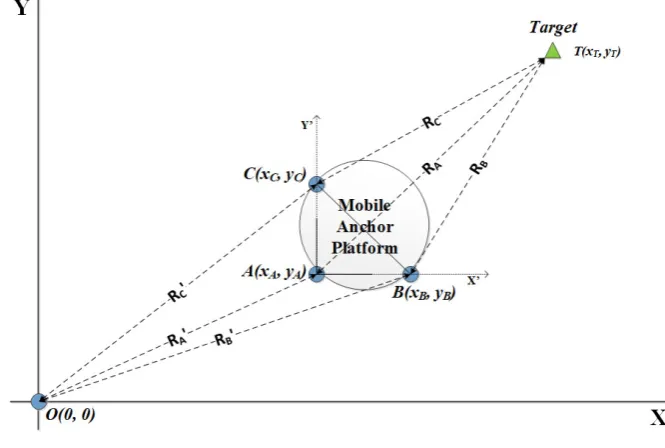
This paper proposes a mobile anchor node which measures the relative target position. The proposed system can also calculate the absolute position by placing one fixed node as the reference node, with this node in a well-known position. The mobile anchor can locate the reference node position and use that value to calculate the mobile anchor position. Because we designed the three-anchor-node position in a right-angle triangle, nodes B and C can be directed to the east and north directions and aligned with the x-axis and y-axis, respectively, as shown in Figure3, and the mobile anchor position can be measured.
Figure 3.Proposed local positioning systems (LPS) based on a mobile anchor platform
3. System Configuration
energy to another. This material can be changed depending on the application, and such changes will affect the output of the sensor. The proposed positioning sensor systems block diagram is presented in Figure4. The hardware block measures the traveling time of an RF signal from a transmitter to a receiver while the software block converts the time into target positionT(x,y). The software block has two equations, the distance and position equations, which will be explained in the next section.
Figure 4.Positioning Sensor System Configuration with Two Stages : Distance and Position Blocks
3.1. Distance measuring part
The main function of a distance hardware block is to measure the time for an RF signal to reach a distance unit using a symmetrical double-sided two-way ranging (SDS TWR) algorithm. The process of the SDS TWR can be seen in Figure5[12].
Figure 5.Symmetrical double-sided two-way ranging algorithm [12]
The transmitter sends test packets to the receiver and waits for a reply packet. The receiver will send an ACK (acknowledge) packet to the transmitter along with a header (delay time). These values can be used by an algorithm to calculate the distance between these two nodes. The equation used to calculate the distance is given below.
distance(R) = c
4×(troundTx+troundRx−treplyTx−treplyRx) =
c×ToF
with c is speed of light (3x10⁸m/s). Here, c is the speed of light (3x10⁸m/s) and RTT is the round-trip time (troundTxandtroundRx) required by a packet to travel from the transmitter to the receiver and back to the transmitter again. To confirm whether the distance calculation is accurate, the same procedure is repeated by the receiver (now as the transmitter), sending a test packet to the transmitter (now as the receiver). At the end of this procedure, two distance values are determined and an average of the two values can be used to achieve a fairly accurate distance measurement between these two nodes.
3.2. Position calculation part
The software block is the main part in this sensor positioning system, and it calculates the distance and position. Essentially, a trilateration method is used to calculate the position.
(xT−xA)2+ (yT−yA)2 = R2A (2)
(xT−xB)2+ (yT−yB)2 = R2B (3)
(xT−xC)2+ (yT−yC)2 = R2C (4)
Based on these three circle equations, the position can be calculated by finding the intersection from these three circles. However, distance measurement errors arise and the system cannot find the intersection from these three circles. This is known as intersection ambiguity. The position equations can convert one-dimensional (1D) information into a two-dimensional (2D) quantity (i.e., from the distance to the position), unlike other sensor elements which can only convert one energy form to another energy form. In the sensor element, when we change or modify the material of the element, it will give a different output. Analogically, we redesign the anchor placement and derive the conventional equation of trilateration to obtain simpler equations for calculating the position of the target node. Anchor node placement is designed as a right-angle triangle formation, as shown in Figure6.
Figure 6.Anchors placement with a right-angle triangle formation on the mobile platform
target node, respectively. The equations below are the proposed real-time local positioning system (RT-LPS) equations. From two triangles4TAT0and4TBT0,x
Tcan be calclulated as following
R2A−x2T = R2B−(xT−d)2 (5)
=>xT =
R2A−R2B+d2
2d . (6)
It can be applied to calculateyTposition,
R2A−y2T = RC2 −(yT−d)2 (7)
=>yT =
R2A−R2C+d2
2d . (8)
We decouplexTandyTto be calculated separately without concern over the intersection ambiguity issue. Because anchor nodes are moving (on a mobile platform) to create an angle between the anchors and the target nodeθ = 45◦, the distance between anchor nodesB andCto the target node will
be identical (RB=RC). Target positionsxTandyTwill be equal to ensure that the following single equation reduces the computation time,
xT=yT=
R2L−R2S+d2
2d , (9)
withRL=RA(one long distance) andRS=RB=RC(two short distances).
4. Performance Analysis
The performance of the proposed position sensor system (i.e., the accuracy) will be analyzed by assessing the measured distance error and calculated position error.
4.1. Distance Error Analysis
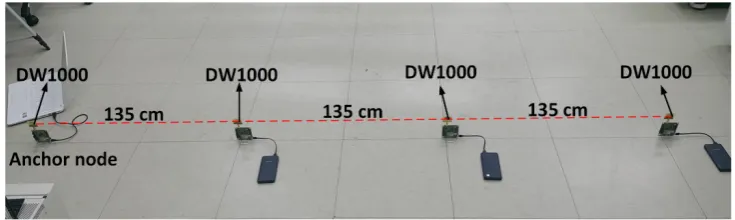
All position accuracy problems start with a distance measurement error. To analyze the distance measurement error, an experiment was conducted. A Decawave DW1000 device is used to measure the distance between the anchor and the target node in this case. This is an RF device which provides real-time localization for indoor positioning systems [20]. Two nodes are placed at various distances, as shown in the Figure7. These range from 135cmto 810cmin steps of 135cm.
Figure 7.Experimental setup to measure distance with Decawave 1000 modules
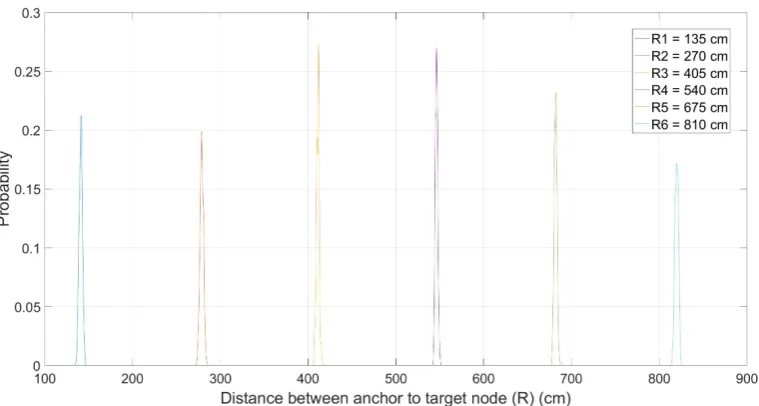
For each distance, 1000 samples were collected and the mean and variance were calculated. Figure 8shows a probability distribution function (PDF) graph of each distance. We can observe the shape of the PDF of each distance, with a high and low peak. In addition, it is difficult to see these clearly. Hence, we create two categories; Figures9aand9cshow the PDF and CDF of the∆Rwithµ∆R<7cm, while Figures9band9ddo so withµ∆R ≥ 7cm. Based on these graphs, we can conclude that the
are measured to find the mean and standard deviation, as shown in table1. The table shows that differences in the distance have no effects on the mean or variance value.
Table 1.Means and standard deviations of errors for the measured distances
Distance (cm) µ∆R(cm) σ∆R(cm)
R1 135 6.035 1.83
R2 270 8.909 1.97
R3 405 6.166 1.61
R4 540 6.364 1.40
R5 675 7.042 1.64
R6 810 9.973 1.98
Figure 8.Probability of measured distances between anchor and target node (R)
4.2. Position Error Analysis
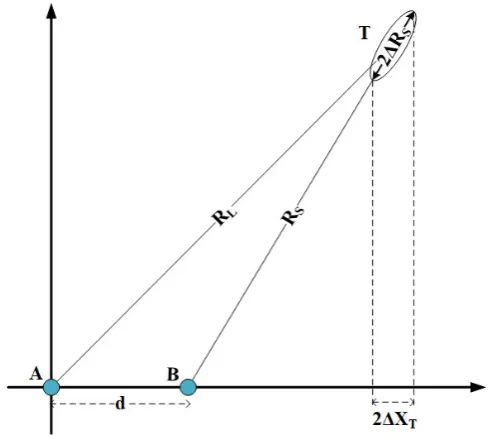
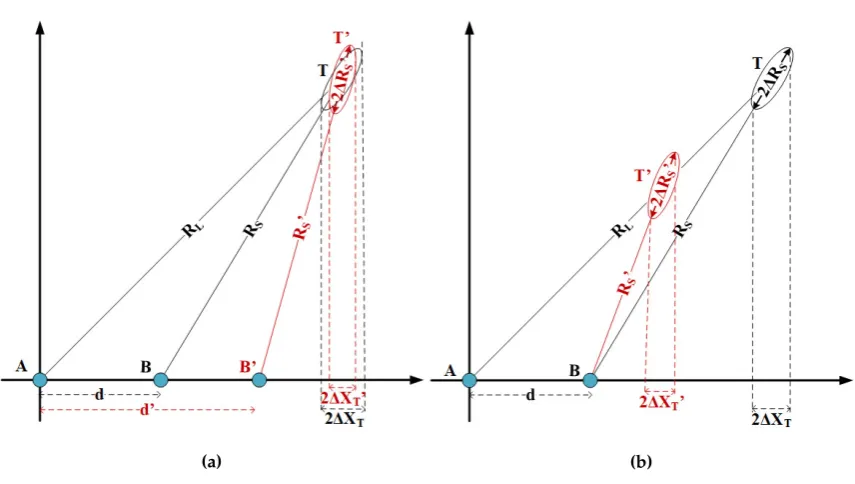
Figure10shows the mechanism used to describe the position error (∆XT) from the distance error
(∆RS). Anchor nodesAandBare at spacing (d) with distancesRA andRBto the target node (T),
respectively. The measured distances contain errors related to the statistics of the mean (µ) and variance
(σ2), which can be depicted by an ellipse, as shown in Figure10. The position error can be calculated
using the projection of the ellipse to thex-axis, which is smaller than the distance error normally There are two possibilities with regard to changing the configuration, as shown in Figure11. The distance (R) between the anchor and the target and the spacing (d) between the anchors. The spacing (d) and distance (R) effects can be observed in Figures11aand11b, respectively. In Figure11a, the spacing (d) effect can be observed by increasing the distance between nodesAandB. As indicated, the red ellipse is slightly tilted and causes the position error to become smaller. Opposite to the spacing (d) effect, the distance (R) effect is shown in Figure11b. This figure shows that the position error decreases after the target position moves closer to the anchor node. The target position accuracy can be understood graphically.
At this stage, we derive analytically the function from the distance error to the position error. The equation below is used to calculate the position from measured distances with errors.
ˆ
xT= ˆ
R2
L−Rˆ2S+d2
(a) (b)
(c) (d)
Figure 9.Probability density functions of distance errors (∆R) between anchor and target node a) small mean (µ∆R <7 cm) and b) large mean (µ∆R ≥7 cm), cumulative density function of distance error (∆R) between anchor and target node c) small mean (µ∆R<7 cm) and d) large mean (µ∆R≥7 cm)
(a) (b)
Figure 11.Graphical description of projecting distance error (∆RS) into position error (∆XT) by changing (a) anchor spacing (d) and (b) target distance (R)
ˆ
RLand ˆRSare the distances between the anchor nodes to the target node with distance errors ˆRL =
RL+∆RL and ˆRS=RS+∆RS, respectively. The actual position can be calculated as follows:
ˆ
xT =
(RL+∆RL)2−(RS+∆RS)2+d2
2d (11)
= xT+RL∆RL
−RS∆RS
d +
∆R2L−∆R2S
2d . (12)
We know R2L−R2S+d2
2d isxT from Equation (9). By calculating the difference between the calculated position ( ˆxT= ˆyT) and the exact position (xT=yT), we obtain the position error (∆xT =∆yT),
∆xT =xˆT−xT. (13)
By eliminating the second-order terms, we acquire an approximation equation of the position error,
∆xT =
RL∆RL−RS∆RS
d . (14)
With the equation above, we can calculate the position error of target node easily. To analyze the parameter effects on the position accuracy, the following equation can be derived from Equation (14),
∆xT =
R
L
RS ∆RL
∆RS
−1
R
S
d ∆RS= (αβ−1)γ∆RS =k∆RS, (15)
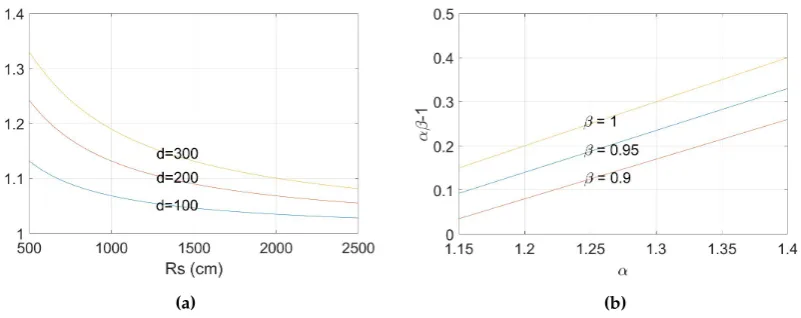
with the three dimensionless numbers ofα= RRL
S,β=
∆RL
∆RS andγ= RdS. Here,kis a constant depending
on the design, operation and environmental conditions.
Additionally,αis a geometrical parameter given by the triangleTAB, whereRSis smaller always thanRL, which is larger than 1. Moreover,αcan be computed from the ratio of the long distance (RL) and short distance (RS). The environmental conditions have an influence onβbecause the distance
(a) (b)
Figure 12. Calculated value of (a) possibleαwith differentdandRSand (b) constantαβ−1 with possibleβ
after measuring high-number samples, the mean will be similar to makeβapproximately equal to
1. Theγvalue can be referred to as a design and operation parameter. The anchor spacing (d) can
be determined depending on certain specifications required by a specific application. Moreover, the mobile anchor platform can be operated to approach the target node to obtain the appropriate target distance (R) from the anchor to the target node. The position error is proportional to the target distance but inversely proportional to the anchor spacing.
5. Results
5.1. Simulation studies
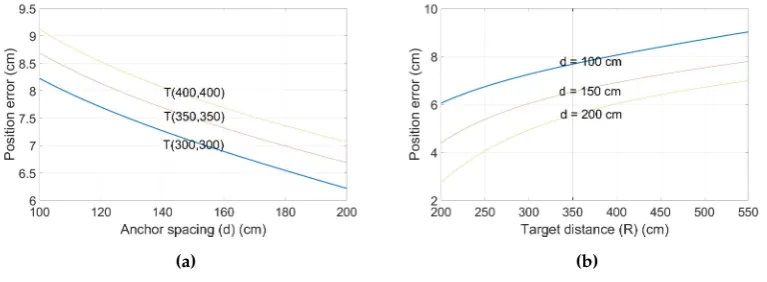
Figure13shows the anchor spacing (d) and distance (R) effects with mean of the distance error (µR=10cm). In Figure13a, the position error decreases with an increase in the spacing (d) from 100cm to 200cm. When the target position changes fromT(300cm, 300cm)toT(400cm, 400cm), the position error increases because the distance between the anchor and target nodes becomes longer. Figure13b shows the effect of the distance (R) on the position error. The distance (R) increases from 200cmto 550cmwhen the target position isT(300cm, 300cm). By increasing the distance (R), the position error increases as well to change the anchor spacing (d) from 100cmto 200cm. The longer the spacing (d), the smaller the position error.
Figure14shows the simulation results of the anchor spacing (d) and the target distance (R) effects with different means of the distance error (µ∆R). The values ofµ∆Rchanges from 8cmto 10cm. Here,
we can observe the mean effect on the position error. The larger the mean of the distance error, the larger the position error. The mean of the distance error is an error that cannot be handled here, as it always occurs in actual applications. If we want to reduce the position error, the anchor spacing (d) should be increased or the target distance (R) should be reduced.
Figure15shows the effects ofRanddwith every possible value from 150cmto 350cmfor the anchor spacing (d) and from 200cmto 500cmfor the distance between the anchor and the target node (R). This graph is a summarization from the previously mentioned simulation. We can check the worst case in this system, i.e., whendis less than 150cmandRexceeds 450cm.
5.2. Experimental case studies
(a) (b)
Figure 13.(a) Anchor spacing (d) effect and (b) distance (R) effects for position error (µ∆R= 10cm)
(a) (b)
Figure 14.(a) Anchor spacing (d) and (b) distance (R) effects for position error with different means
calculation, we assume that distance error is generated from a Gaussian random variable such that the distance between the anchor and the target node can be calculated by adding the real distance (R) to the distance error (∆R).
Table 2.Three experimental cases with differenceRandd
Scenario Anchor Spacing (d) (cm) Target Position (cm) µ∆T(cm) Exp Sim
1 90 T(360,360) 10.71 9.67
2 90 T(270,270) 5.38 5.13
3 135 T(270,270) 2.93 3.17
Figure 16.Experimental setup of three anchors and one target node in a right-angle triangle formation
Figure17shows PDF and CDF graphs of scenario 1. This result becomes the default scenario and can therefore be compared with the other scenarios. The means of the distance error forRLand
RSfrom the measured data are approximately 8cmand 6.92cm, respectively, while the means of the distance error for RL and RS from the simulation data are close to 8cmand 6.95cm, as given in Figures 17aand17b. With regard to the position error, Figures17cand17dshow that the position errors for the experimental and simulated data are 10.71cmand 10.98cm, respectively. Scenario 2 shows anR
effect when changing the target position fromT(360cm, 360cm)toT(270cm, 270cm)with the samed
value from the previous scenario (d=90cm). Figure18is the result for scenario 2. We can find that the performance of this scenario is better than that of the previous scenario. The position errors from the experimental and simulation data are 5.38cmand 6.04cm, correspondingly. Figure19is the result from scenario 3. In this scenario, the anchor spacing (d) changes from 90cmto 135cmwith the target position
T(270cm, 270cm). This shows that the improvement increases from scenarios 1 and 2. The position errors for this scenario are 2.93cmand 3.05cmfor the experimental and simulated data, respectively.
The position error results were affected by the difference between the mean of the distance error (µ∆RL -µ∆RS). The smaller the value of (µ∆RL -µ∆RS), the smaller the position error of the system.
assuming that the error is Gaussian, our simulation is in good agreement with the experiment and can serve to analyze the system before we implement it.
(a) (b)
(c) (d)
Figure 17.PDF and CDF of distance and position error with spacing (d=90 cm) and target position T(360,360) a) PDF of distance error, b) CDF of distance error, c) PDF of position error, and d) CDF of position error
6. Conclusions and Future Works
This paper proposed a positioning sensor system for calculating object positions. After placing anchor nodes in a right-angle triangle formation, the parameter effects for the position accuracy were analyzed. With this design, we can put the anchor nodes on a robot platform such that the anchor nodes can move to the optimal performance. Based on experimental data from distance measurements, we calculated the position and analyzed the parameters which affected the position accuracy. We generated the distance error by assuming that the error is a Gaussian model. The result shows that the simulation here led to outcomes similar to those from the experiment with an error ratio in the approximate range of 4%−10%. We conclude that our simulation works properly with the proposed method. For future works, a solution to determine the anchor position should be considered. When using one reference node with a well-known position, the mobile anchor can calculate its own position. Another case which can be considered is a method to be used when an anchor node cannot reach the reference node or the target node. Creating a mobile anchor network is a possible means of solving such a problem. Mobile anchor nodes can be scattered over a large area, and they can share information about their positions such that the coverage area can be increased.
(a) (b)
(c) (d)
(a) (b)
(c) (d)
References
1. Kaiser, S.A.; Christianson, A.J.; Narayanan, R.M. Global positioning system processing methods for GPS passive coherent location.IET Radar, Sonar Navigation2017,11, 1406–1416. doi:10.1049/iet-rsn.2017.0010. 2. Khalajmehrabadi, A.; Gatsis, N.; Akopian, D. Evaluation of the detection and mitigation of time synchronization attacks on the global positioning system. 2018 IEEE/ION Position, Location and Navigation Symposium (PLANS). IEEE, 2018. doi:10.1109/plans.2018.8373528.
3. Lim, B.; Kim, J. Efficient Database Reduction Method of Building Recognition using Global Positioning System On Mobile Device. 2009 4th International Symposium on Wireless Pervasive Computing. IEEE, 2009. doi:10.1109/iswpc.2009.4800582.
4. Alrajeh, N.A.; Bashir, M.; Shams, B. Localization Techniques in Wireless Sensor Networks.International Journal of Distributed Sensor Networks2013,9, 1–9.
5. Fresno, J.; Robles, G.; Martínez-Tarifa, J.; Stewart, B. Survey on the Performance of Source Localization Algorithms.Sensors2017,17, 2666. doi:10.3390/s17112666.
6. Romaniuk, S.; Ambroziak, L.; Gosiewski, Z.; Isto, P. Real time localization system with Extended Kalman Filter for indoor applications. 2016 21st Int. Conf. on Methods and Models in Automation and Robotics (MMAR), 2016, pp. 42–47.
7. Wu, H.; Chai, S.; Cui, L. Non-line-of-sight mitigation in TOA-based RTLS using partially linear model. 2013 15th IEEE International Conference on Communication Technology, 2013, pp. 418–423. doi:10.1109/ICCT.2013.6820412.
8. Hach, R.; Rommel, A. Wireless synchronization in time difference of arrival based real time locating systems. 2012 9th Workshop on Positioning, Navigation and Communication, 2012, pp. 193–195. doi:10.1109/WPNC.2012.6268763.
9. Chen, W.C.; Kao, K.F.; Chang, Y.T.; Chang, C.H. An RSSI-based distributed real-time indoor positioning framework. 2018 IEEE International Conference on Applied System Invention (ICASI), 2018, pp. 1288–1291. doi:10.1109/ICASI.2018.8394528.
10. Sadowski, S.; Spachos, P. RSSI-Based Indoor Localization With the Internet of Things.IEEE Access2018, 6, 30149–30161. doi:10.1109/ACCESS.2018.2843325.
11. Jachimczyk, B.; Dziak, D.; Kulesza, W. Customization of UWB 3D-RTLS Based on the New Uncertainty Model of the AoA Ranging Technique. Sensors2017,17, 227.
12. Baba, A.I.; Atia, M.M. Burst mode symmetric double sided two way ranging. 2011 IFIP Wireless Days (WD), 2011, pp. 1–3. doi:10.1109/WD.2011.6098183.
13. Mounir, T.A.; Mohamed, P.S.; Cherif, B.; Amar, B. Positioning system for emergency situation based on RSSI measurements for WSN. 2017 International Conference on Performance Evaluation and Modeling in Wired and Wireless Networks (PEMWN), 2017, pp. 1–6. doi:10.23919/PEMWN.2017.8308026.
14. Nguyen, T.S.; Huynh, T.H. Experimental study of trilateration algorithms for ultrasound-based positioning system on QNX RTOS. 2016 IEEE International Conference on Real-time Computing and Robotics (RCAR), 2016, pp. 210–215.
15. Cotera, P.; Velazquez, M.; Cruz, D.; Medina, L.; Bandala, M. Indoor Robot Positioning Using an Enhanced Trilateration Algorithm. International Journal of Advanced Robotic Systems2016,13, 110.
16. Blanco, L.; Serra, J.; Nájar, M. Minimum variance time of arrival estimation for positioning. Signal Processing2010,90, 2611–2620. doi:10.1016/j.sigpro.2010.02.018.
17. Graunke, T.; Schmitt, K.; Raible, S.; Wöllenstein, J. Towards Enhanced Gas Sensor Performance with Fluoropolymer Membranes. Sensors2016,16, 1605. doi:10.3390/s16101605.
18. Ida, N.Sensors, Actuators, and their Interfaces: A Multidisciplinary Introduction; Institution of Engineering and Technology, 2013. doi:10.1049/sbcs502e.
![Figure 5. Symmetrical double-sided two-way ranging algorithm [12]](https://thumb-us.123doks.com/thumbv2/123dok_us/1000684.1599877/4.595.129.465.167.293/figure-symmetrical-double-sided-two-way-ranging-algorithm.webp)