Article
A Detection algorithm based on Convolutional
Neural Network
Fei Rong1,*, Li Shasha1,Xu Qingzheng2 and Liu Kun3
1 School of Computer Science and Engineering, Xi’an University of Technology; [email protected]
2 College of Information and Communication, National University of Defense
Technology,[email protected]
3 Xi'an Nova Electronics Technology Co., Ltd.; [email protected]
* Correspondence: [email protected]; Tel.: +86-135-728-72821
Abstract: The Station logo is a way for a TV station to claim copyright, which can realize the analysis and understanding of the video by the identification of the station logo, so as to ensure that the broadcasted TV signal will not be illegally interfered. In this paper, we design a station logo detection method based on Convolutional Neural Network by the characteristics of the station, such as small scale-to-height ratio change and relatively fixed position. Firstly, in order to realize the preprocessing and feature extraction of the station data, the video samples are collected, filtered, framed, labeled and processed. Then, the training sample data and the test sample data are divided proportionally to train the station detection model. Finally, the sample is tested to evaluate the effect of the training model in practice. The simulation experiments prove its validity.
Keywords: Station logo; Convolutional Neural Network; Detection
1. Introduction
The TV station logo is used to determine the name of the TV station,which contains important information about the program's meaning and distinguishes the unique logo of different TV stations. In order to claim the ownership of the video, the station caption will be added to the video.
Compared with the manual identification methods of the TV station logo, the method of intelligently identifying the logo using a computer can not only save time, but also reduce the error and improve the accuracy. Therefore, the station logo detection as an auxiliary means of public opinion supervision has a strong engineering significance and social value for conducting in-depth research.
In recent years, It was a hot issue that the identification of TV stations logo in many universities and research institutions at home and abroad, which mainly focusing on how to describe the identification of TV stations and how to identify the identity of TV stations.
In the description of the TV station logo, the station logo description, extraction, analysis, and comparison will determine the effect of the station logo recognition. Therefore, the description of the station logo is the first and most critical step in the station logo detection. At present, the existing domestic standard feature analysis algorithms are: based on color histogram [1], ordinary Hu invariant moment [2], weighted Hu invariant moment [3], spatial distribution histogram [4] and so on. The TV station logo detection based on color histogram uses different color tones between different types of station labels to complete the station caption detection. According to the result of matching the station logo that has been described and the pre-processed histogram in the reference library of the TV station caption template, the station caption with the smallest distance is determined as the caption of the identification test. However, it was obvious to the disadvantages of the algorithm that the detection performance of the similar color TV station logo and the transparent TV station logo is sensitive and difficult to achieve. The TV station logo detection algorithm of the ordinary Hu invariant moment mainly identifies and matches the TV station logo by using the shape characteristics of the station caption. Due to the background and noise of the station logo, the average
accuracy of this station logo detection method is about 56%. The weighted Hu invariant moment increases the detection accuracy to 76.7%, but the effect is still not satisfactory. The station logo detection algorithm combining Spatial Distribution Histogram with Color Histogram of HSV Space increases the number of station caption in the knowledge base by using traversal recognition, which reduces the calculation efficiency and the detection effect of translucent station caption.
In the research of identification of the station logo, the theory mainly focuses on the following aspects: Firstly, the station logo detection based on the database template knowledge base and the statistical probability maximum criterion[5]. The knowledge base uses offline storage to store information such as logo feature vectors and channel names. The statistical probability maximization criterion uses the traversal recognition algorithm to compare the key frames read each time with the knowledge base template, but the computational efficiency of this method decreases as the number of station marks in the knowledge base increases. Secondly, the extracted station logo feature data is compared with the data in the template database, and the calculated difference is compared with the threshold. Since such recognition algorithms are usually compared with the color or spatial features of the logo, the principle is relatively simple and the amount of calculation is relatively small. But it is susceptible to background and noise. Thirdly, the classification and recognition method based on Support Vector Machines(SVM)[6]. This method has obvious advantages and strong pertinence in solving small samples, high-dimensional pattern recognition and nonlinear problems so that it can be widely applied to other problems such as function fitting.
In the research of station logo detection, Wang Jian et al[7] proposed an image segmentation method ,which based on the geometric and positional features of the mark to determine the split identification area. In this method, the representative frame sequence is selected by a time domain sampling method, then the edge matching is performed by calculating the gradient of the representative frame sequence. Shi Yingchun et al.[8] used the combination of spatial distribution histogram and color histogram of HSV space to describe the characteristics of the logo, and used the knowledge base to assist the histogram statistics method to identify the logo. The algorithm adopts ergodic recognition, which leads to the gradual decrease of the computational efficiency as the number of station caption in the knowledge base increases, thus the recognition effect on semi-transparent logos is not ideal. Ozay et al.[9] proposed a station-based detection method based on the average time boundary, which performed well in extracting opaque and translucent logos, but lacked detailed description of the algorithm for obtaining individual logos. Jin Yang et al.[10] introduced a polar coordinate point pair matching method. Although the problem of semi-transparent station marking detection is better solved and the accuracy rate is greatly improved, the real-time performance of the algorithm is poor.
In this paper we proposes novel algorithm to detect station logo, which is based on deep learning convolutional neural network and target detection tool SSD. Firstly, construct an experimental environment of deep learning by optimizing the algorithm parameters. Secondly, the algorithm is modeled by collecting diversified station caption data. Finally, the model is applied to the real application environment after reaching the predetermined detection accuracy.
2. The detection algorithm based on convolutional neural network
The core of proposed algorithm is to predict the object and grade the category classification, so it is the fastest detection algorithm. Moreover, the algorithm uses a small convolution kernel on the feature map to predict the box offsets of a series of bounding boxes, so that the detection success rate is the highest and the robustness is the strongest.
2.1 Network structure of algorithm
the final test results are obtained by using non-maximal values after the feature extraction of the pool layer of Pool 11 is completed.
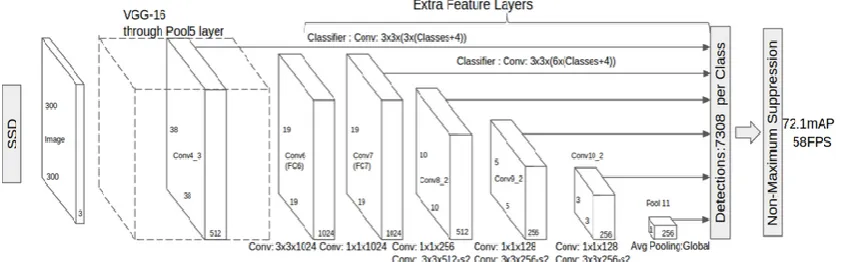
SSD is a pyramid detection network. Since the value of the convolutional layer is reduced layer by layer, different features of the image can be obtained after the input image goes through the network. For example, an image of 300*300 through the different convolutions layer of the network convolution into the images of different matrices such as 256*256, 128*128 *64 *64,32*32, and so on, which can maximize the extraction of key features.
Figure 1.SSD 300*300 network architecture 2.2 Algorithm principle
SSD training objective function is derived from the objective function of multiple testing box. xpij = 1 indicates that the box i matches the labeled object box j of the category p. Otherwise, xpij = 0 indicates that it does not match. According to the above matching strategy, there must be ∑i xpij ≥ 1, which means that there may be multiple default boxes matching the labeled object box j.
The total objective loss function is the weighted sum of location loss (loc) and confidence loss (conf).
L(x,c,l,g) = 1
N (Lconf(x,c)+αLloc(x,l,g)) (1)
➢ N is match the box labeled with object's default box number;
➢ Location Loss (loc) is Smooth L1 Loss in Fast R-CNN, used the prediction of the box (l) and the fact base box (g) parameters (namely the center coordinates, width, height) to return the center of the boundary box, as well as the width, height;
➢ Confidence Loss (conf) is Softmax Loss, which input are every kind of confidence level c;
➢ α is the weight term and set to 1; Confidence Loss (conf):
Lconf(x,c)= -
∑
Ni∈Posxij
log( ′ci ∗ p) − ∑
i∈Neglog( ′cj ∗ p)
∀,
′c
ip =exp (ci∗p)
∑ exp (ci∗p)p (2) Location Loss (loc):
Lloc(x,l,g) =
∑
Ni∈Pos1 ∗
∑
m∈{cx,cy,w,h}xij K ∗ smoothL1(li − ′gj)
(3)′
gj cx = (gj cx - dicx)/diw′
gj cy = (gj cy - dicy)/dih (4)′
gjw = log(gjw / diw)′
gjh = log(gjh / dih) (5)In which,(gcx, gcy, gw, gh)represents the fact library box,(dcx, dcy, dw, dh)indicates the default box, (lcx, lcy, lw, lh)indicates the offset of the predicted box relative to the default box.
Generally speaking, CNN's different layers have different receptive field. However, in SSD structure, the default box does not need to correspond to the receptive field of each layer, and the specific feature graph is responsible for processing the certain scale object in the image. On each
feature graph, the scale of the default box is calculated as follows:
sk=smin+(k−1) *(smax−smin)/(m-1), k∈[1,m] (6)
Sk’=
√(Sk ∗ Sk + 1)
(7) Each default box, width, height, and center point is calculated as follows:Wak = sk *
√1 ∗
ar (8)hak = sk /
√1 ∗
ar (9)( (i+0.5) |fk| ,
(j+0.5)
|fk| ) (10)
After matching, many of the default boxes are negative samples, which will result in positive samples and negative samples imbalance, so that the training will be difficult to converge. Therefore, in this paper, the negative samples are sorted by the confidence level, then the highest ones are selected and the ratio of negative samples and positive samples is 3:1.
3 Design of test method for station caption
3.1 Algorithm design idea
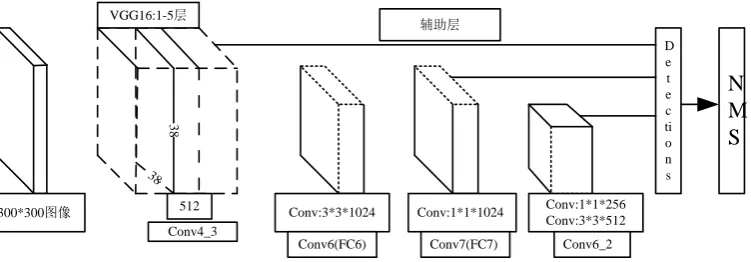
The change of station caption is relatively small and the position is fixed. Considering the speed and precision of the detection, the main network of VGG-NET is modified by adding three different convolution layers. And the pool layer is added to every convolution layer on the structure of all 1-5 layers of the original VGG-NET. After sorting the initial 10030 pictures and compressing it to the size of 300*300, it is found that the size of the station caption is basically between 45*28~60*35. So there is no need to carry out a lot of convolution layer for convolution operation. The modified network structure is shown in Figure 2 .
3
8
D e t e c ti o n s
N
M
S
38
辅助层
Conv:3*3*1024 Conv:1*1*1024 Conv:1*1*256 Conv:3*3*512
300*300图像 512
VGG16:1-5层
Conv4_3
Conv6(FC6) Conv7(FC7) Conv6_2
Figure 2. Network diagram of station caption detection algorithm
After a series of SSD pyramidal convolution extraction features, non-maximum suppression is applied to each feature graph .
3.2 Network level design
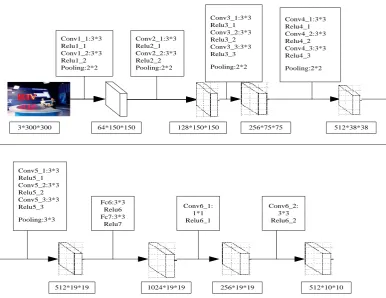
It has been proved that the more and deeper the network level, the better the performance in a certain range. In order to make the network thinner and deeper, the structure uses two 3*3
Conv1_1:3*3 Relu1_1 Conv1_2:3*3 Relu1_2 Pooling:2*2 Conv2_1:3*3 Relu2_1 Conv2_2:3*3 Relu2_2 Pooling:2*2 Conv3_1:3*3 Relu3_1 Conv3_2:3*3 Relu3_2 Conv3_3:3*3 Relu3_3 Pooling:2*2 Conv4_1:3*3 Relu4_1 Conv4_2:3*3 Relu4_2 Conv4_3:3*3 Relu4_3 Pooling:2*2 Conv5_1:3*3 Relu5_1 Conv5_2:3*3 Relu5_2 Conv5_3:3*3 Relu5_3 Pooling:3*3 Fc6:3*3 Relu6 Fc7:3*3 Relu7 Conv6_1: 1*1 Relu6_1 Conv6_2: 3*3 Relu6_2 512*10*10
3*300*300 64*150*150 128*150*150 256*75*75 512*38*38
512*19*19 1024*19*19 256*19*19
Figure 3. The main structure of station caption detection Network
Figure 3 shows that the 3 channel color map of 300*300 with input image "BTV". The parameters of each layer of the network are shown in the diagram.
The first level is the Conv1_1 layer, the convolution kernel is 3*3 matrix, the step size is 1, the output feature graph is 300*300, then follow the activation function Relu1_1.
The second layer is the Conv1_2 layer, the convolution core is 3*3 matrix, the step length is 1, the output characteristic is 300*300, then follow the activation function Relu1_2 and through the maximum pool layer of 2*2. Finally the feature graph becomes 150*150 and the convolution kernel is 64.
The third layer is Conv2_1 layer, the convolution core is 3*3 matrix, the step length is 1, the output feature is 150*150, then the Relu2_1 is followed.
The fourth layer is Conv2_2 layer, the convolution core is 3*3 matrix, the step length is 1, the output characteristic is 150*150.After through Relu2_2 and the maximum pool of 2*2 , which play the role of reducing dimension, the final feature graph becomes 75*75 and convolution kernel is 128.
The fifth level is the Conv3_1 layer. After a 3*3 convolution kernel, the step length is 1, followed by the activation function Relu3_1.
The sixth level is the Conv3_2 layer. After a 3*3 convolution kernel, the step length is 1, followed by the activation function Relu3_2.
The seventh level is the Conv3_3 layer. After a 3*3 convolution kernel, the step length is 1, followed by the activation function Relu3_3.
The eighth layer, ninth layer and tenth layer is the convolution layer of three 3*3, which followed a pool layer of 2*2 where the image continues to extract the feature in this layer. Finally, the
dimension is reduced by the pool, the step length is 1, the characteristic number is 512, and the feature graph becomes the matrix of 19*19.
After a combination of convolution and pooling, the feature graph becomes smaller and smaller, and the convolution kernel keeps increasing. Finally, the 512*10*10 image is output.
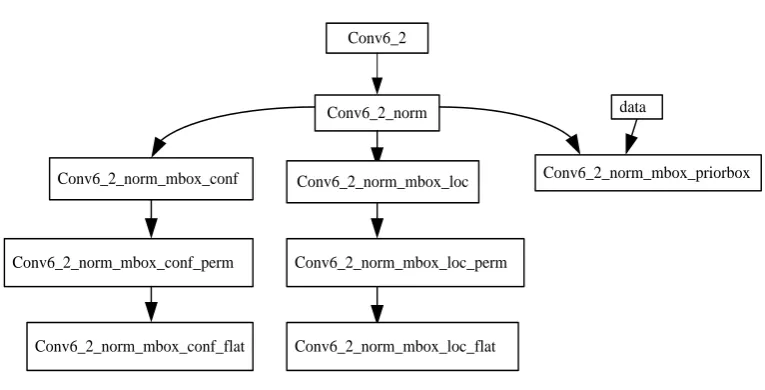
In the paper, the test network is selected as three layers, such as Conv4_3,FC7,Conv6_2 and so on, and combines with the existing basic network to detect the different scales of the same object respectively. In Conv6_2, as an example, the Conv6_2_norm layer normalizes the feature graph of the Conv6_2 layer in figure 4. At the time of across_spatical=false, the processed characteristic points are handled according to the following formula:
||x||2 = (∑𝐝𝐢=𝟏|𝐱𝐢| ∗ |𝐱𝐢|)0.5 (11)
‘X = 𝐱
||𝒙||𝟐 (12)
'X is a characteristic point after processing
Conv6_2
Conv6_2_norm
Conv6_2_norm_mbox_loc
Conv6_2_norm_mbox_loc_perm
Conv6_2_norm_mbox_loc_flat
Conv6_2_norm_mbox_priorbox data
Conv6_2_norm_mbox_conf
Conv6_2_norm_mbox_conf_perm
Conv6_2_norm_mbox_conf_flat
Figure 4.Target detection structure for Conv6_2 layer
In the above figure, conv6_2_norm_mbox_loc is used to predict the regression value, which is a coiling layer with 8, 8=2*4 output, where 2 represent two rectangle frames and 4 represent the location of the rectangle, which is a center point coordinate and a rectangular high and wide value. Because the height width ratio of the station caption scale is basically fixed 1:1 or 2:1, the ratio of height to width is not considered as 2:1. Finally, the predicted value will do Smooth L1 regression with the live box.
Conv6_2_norm_mbox_loc_perm is the Permute layer, which can change the arrangement of data storage. conv6_2_norm_mbox_loc_flat is the flat layer of the Flatten data.
conv6_2_norm_mbox_conf is also a convolution layer, which can predict the attributes of each point on the feature graph . If channel is 2=2*1, using a anchor which is a predefined rectangle to predict the background or the station caption of this feature.
There are no differences between the two layer of conv6_2_norm_mbox_perm and
storage. However, both conv6_2_norm_mbox_loc_flat and conv_6_2_norm_mbox_conf_flat are the flat layer.
conv6_2_norm_mbox_priorbox can product prior box. When the convolution layer extracts features each time, the SSD tool uses a sliding window strategy to slide on the feature graph to generate the prior box, while at the same time using a predefined rectangle of different sizes. Assuming that the conv6_2_norm size is 10*10, 3 predefined rectangular boxes are selected for each feature point, then there will be 10*10*3= 300 prior box on the whole picture. When the model is trained, 300 prior box will be calculated with the live box. When the overlap area of the two is lager than a set value, it is considered that the live box is detected by the current prior box, then the SSD tool will revise the position of prior box by the regression frame. In the test of the model, because we are ignorant of the particular case of the live box , using the regression frame to adjust the predicted prior box. Finally, the center position coordinates and the wide coordinates of the object to be detected are obtained.
3.3 Introduction of application process
According to the characteristics of the width to height ratio and the relatively fixed position of the station caption, this paper proposed a detected method based on SDD. In the application of the algorithm, we must have enough large annotated samples, which contains the image and the name and the location of the object being marked, and the images and annotations of the samples are one-to-one correspondence. Therefore, the tagged file must be treated as XML files, and all data must be arranged in ascending order. Then, according to the ratio of 3: 7, the sample are divided into the training set train and test set test files, and write the label file of each station caption.This algorithm runs on the CAFFE environment, so we need to install the algorithm running environment with deep learning CAFFE. Finally, we compile the program to train the network model, and select the best iterative model to test the new sample in the real environment. The following diagram is the general use process of this algorithm:
Figure 5Flow Chart for the TV Station Logo detection algorithm based CNN
4. Network model
4.1 Generate set of data
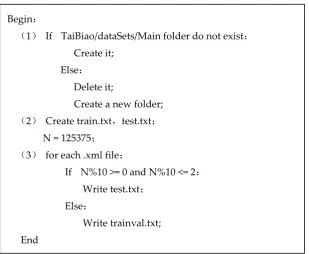
training set trainval.txt contains 87762 samples and the test set contains 37612 samples. Running creat_datasets.py can generate trainval.txt and test.txt files. The process of creat_datasets.py program is described in pseudo code:
Figure6pseudo code
When the network model is trained, the trainval.txt files will be taken into the deep neural network for training. So we need to write a file record the relationship between the name and the network. In other words, writing the corresponding labelmap files after generated the trainval.txt and test.txt files.
Labelmap file attributes and parts list are as follows: Table 1. The part labelmap file
item name label Display name
Backgroud none_of_the_above 0 background
CCTV-News cctvxw 1 cntvxw
Zhongguola nTV
zgltv 2 zgltv
Anhui satellite TV
ahws 3 ahws
Netease Cloud Music
wyyyy 4 wyyyy
Jiangsu
satellite TV
jsws 5 jsws
Liaoning satellite TV
lnws 6 lnws
Chongqing satellite TV
cqws 7 cqws
Begin:
(1) If TaiBiao/dataSets/Main folder do not exist: Create it;
Else: Delete it;
Create a new folder;
(2) Create train.txt,test.txt; N = 125375;
(3) for each .xml file;
If N%10 >= 0 and N%10 <= 2: Write test.txt;
Else:
Write trainval.txt;
BTV-Beijing Satellite TV
btvbjws 8 btvbjws
Mango TV mgtv 9 mgtv
Shenzhen satellite TV
szws 10 szws
The images have many types of jpg,gif,bmp,jpeg and so on. If the data format is not normalized, the transformation of different types of pictures will take more time when the model is trained. In order to ensure that a large number of different formats are not required to be translated and delayed in training, all the pictures are processed in advance and the training set or test set is saved as a unified format.
4.2 Train of network model
Generally speaking, training a deep network model requires at least 20 thousand pictures. In the paper, the sample data satisfied the theoretical requirement due to the training sample data reach 87762. Considering that the VGG model is a widely used and well performing network model, we use the pre-training method to train the model by adjusting the parameters on the existing VGG network model.
Since a large number of different formats of images reading require conversion and extraction. So in order to ensure that the time is not lost during the training process, the pictures will be processed in advance and the training and test sets will be saved in a uniform format.
In order to ensure that the model can be well converged and will not be over-fitting in the training process, the detect_eval value in the log is detected every 2000 iterations. When the detect_eval value tends to 0, the model tends to converge.
Figure 7. Detect_eval value with an iterative model change table
When iterating the first generation model, the detect_eval value reached 20.025. After the 60000 iteration, the detect_eval value decreased from 12.023. However, after the 78000 iteration of the model, the detect_eval value trend to 0 and the post fluctuation is small. Based on the previous analysis we note that the detection result is globally optimal due to the model achieves convergence after 80000 iteration. Thus, the model is trained to end .
4.3 Score of network model
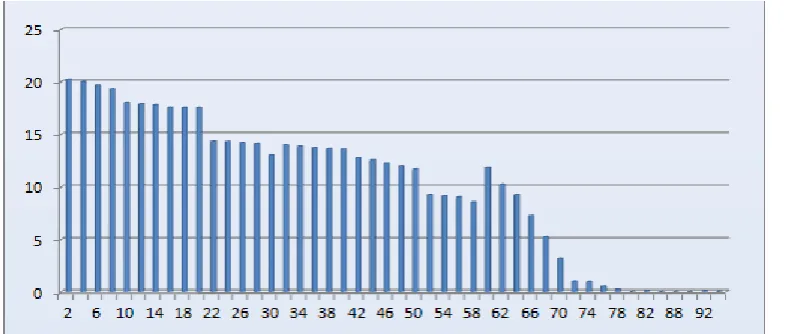
In the program, the images between the detection set which consists of 37612 images with station caption and the training set which all images stored in trainval.txt are mutually exclusive.The procedure is to model each iteration once, and then grade the latest iteration model. Figure 8 describes the model scores of each 10000 iteration models.
Figure 8. Iteration model score with iteration number change table
Figure 8 exhibits the results showing that the rate of model detection in the 10000 iteration to the 50000 iteration is still low, but the detection rate keeps going up. After about 80000 iteration, the accuracy of the model score is 98.2%,and the scores from 80000 iteration to 90000 iteration are fluctuating near 98%. Thus, it can be judged that the detection model of the station logo achieves convergence in the 80000 iteration and reaches the global optimum. It is also observed that, with the amount of training data increases, the model becomes more and more accurate.
4.4 Comparison of experimental results
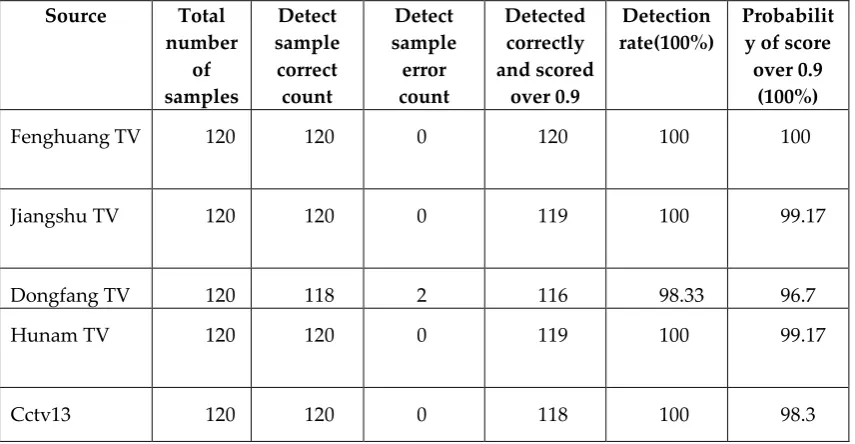
t is clearly that the model achieves convergence in the 80000 iteration and reaches the global optimum, so the model of the test algorithm adopts the 80000 iteration model. This paper selected the sample types and tested results show in Figure 9.
Table 2.80000 iterative model detection sample statistics
Source Total
number of samples
Detect sample correct count
Detect sample error count
Detected correctly and scored
over 0.9
Detection rate(100%)
Probabilit y of score over 0.9
(100%)
Fenghuang TV 120 120 0 120 100 100
Jiangshu TV 120 120 0 119 100 99.17
Dongfang TV 120 118 2 116 98.33 96.7
Hunam TV 120 120 0 119 100 99.17
Cctv13 120 120 0 118 100 98.3
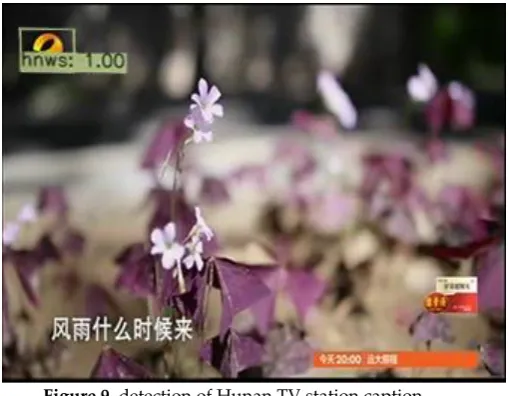
Figure 9 is an advertisement screenshot of Hunan satellite TV (hnws), where the score of the algorithm is 1 for the station caption of the Hunan satellite TV(the closer to 1, the more computer determined).
Figure 9. detection of Hunan TV station caption
Finally, in order to prove the advantage of the algorithm of this paper ,we compare the algorithm of the station logo detection in the paper with the classical detection algorithm.
Table 2 .Comparison of accuracy rate of table mark detection under 4 algorithms
Methods Accuracy/%
Classical Hu invariant moments method 35.81
SIFT Feature operator matching algorithm 88.88
The Matching method based Polar coordinates Corner pair 89.03
Station logo detection algorithm based SSD 98.12
5. Conclusions
In this paper, we proposed a station caption detection method of deep leaning based on convolutional neural network. The method refers to the network structure and hierarchical classification of the algorithm, as well as the module of the application of the algorithm, which includes a sample collection module for selecting a station logo sample, a sample screening module for rejecting the unqualified station label, a sample frame drawing module for sample form
conversion, and a sample labeling module for extracting the logo feature and position, a sample preprocessing module for converting the annotated data format, a sample segmentation module for scaling the training and testing required sample data, a sample training module for the
typographical detection model training, a sample test module for testing the effectiveness of the trained model in practice. Compared with the results by station caption detection method of deep leaning and classical station caption detection algorithm, station caption detection method of deep leaning could improve the results to prove the superiority of the algorithm.
Supplementary Materials: The following are available online at www.mdpi.com/xxx/s1, Figure S1: title, Table S1: title, Video S1: title.
Funding: This research was funded by Shaanxi Science and Technology Project, grant number 2017CG-022, Xi’an
Science and Research Project, grant number 2017080CG/RC043(XALG034) , CERNET Innovation Project, grant number NGII20161201.
References
1. Ahmadi S, Manivarnosfaderani A, Habibi B. Motor oil classification using color histograms and pattern recognition techniques[J]. Journal of Aoac International, 2018.101(6):pp.1967-1976.
2. Zhang X, Yang J, Nguyen E. Breast cancer detection via Hu moment invariant and feedforward neural network[C]. American Institute of Physics Conference Series. 2018.
3. Liang C H, Chang Q. Weighted modified hu moment in human behavior recognition[J]. Advanced Materials Research, 2013, 765-767:pp.2603-2607.
4. Liu P, Miao Z, Guo H, et al. Adding spatial distribution clue to aggregated vector in image retrieval[J]. EURASIP Journal on Image and Video Processing, 2018, 2018(1):pp.9-22.
5. Zhang H, Nie F, Zhang R, et al. Auto-weighted 2-dimensional maximum margin criterion[J]. Pattern Recognition. 2018, 83(2018):pp.220-229.
6. Routray S, Ray A K, Mishra C, et al. Efficient hybrid image denoising scheme based on SVM classification[J]. Optik. 2018,157:503-511.
7. Wang J. New color segmentation method and its applications[M]. 1999.
8. Shi Y, Wang T, Zhou X. Real-time video detection based on local accumulative histogram in non-equational similar hue region of partition[J]. Computer Engineering. 2004, 30(10):pp.153-155.
9. Qu H, Lei L, Tang X, et al. A lightweight intrusion detection method based on fuzzy clustering algorithm for wireless sensor networks[J]. 2018:pp.93-104.