DEVELOPING A NOVEL ENVIRONMENTAL ASSESSMENT MODEL
FOR POWER GENERATION PLANTS
NDALA Y. MULONGO & CLINTON AIGBAVBOA Faculty of Engineering and the Built Environment,
University of Johannesburg, South Africa
Abstract
Environmental assessment is a concept that has been designed to facilitate the present generation to meet their needs without compromising the ability of future generations to meet their own needs as well. Thus, this concept has drawn significant attention from various scholars, researchers and industrial practitioners around the world over the past three decades. Life Cycle Environmental Assessment (LCEA) is a widely metric used to assess the potential ecological impacts, which can be caused by electricity generating supply systems or by other systems than power production plants. However, the current LCEA model is biased and ineffective. Because, its omits factors that are increasingly contributing to the ecological degradation. This study has identified the omitted factors through a critical analysis of a set of previous journal articles conducted in the energy sector. In light of this, this study has developed a novel LCEA framework addressing those blind spots. The framework developed in this study is holistic in nature including all the life cycle stages of a power supply system such as Extraction of the Raw Material (ERM), Transport of Raw Material (TRM), Conversion of Raw into Electricity (CRE), and Transmission and Distribution of Electricity (TDE) to the end users. The novel developed LCEA model has been tested and applied to nine power generation plants such as coal, gas, nuclear, biomass, geothermal, hydro, solar thermal, wind onshore and wind offshore. The results have demonstrated that of conventional technologies including coal, gas, and nuclear, coal energy generating source has got the highest life cycle greenhouse gas Grid Emission Factor (GEF) of 2 866 kg CO2e/MWh, followed by gas with 728 kg CO2e/MWh, and nuclear has got the least GEF of 35 kg CO2e/MWh. Whereas of renewable energy sources biomass has got the highest GEF of 1 508 kg CO2e/MWh, followed by solar thermal with 46.6 kg CO2e/MWh, hydro 39 kg CO2e/MWh, wind offshore 25.25 kg CO2e/MWh, wind onshore 10.1 kg CO2e/MWh, and geothermal closes the ranking with 6.23 kg CO2e/MWh.
Keywords: environmental assessment, novel LCEA model, electricity generating supply systems, lifecycle greenhouse gas grid emission factor.
1.
Introduction
Electricity production usually involves the combustion of fossil fuels, which gives rise to greenhouse gas (GHG) emissions. This latter has caused one of the major concern striking the 21st century is the development of Sustainable Development (SD) whilst rising mankind welfare. Contemporary technology generally has controverting impacts over the concept of SD, as portrayed through the present power supply system. Low-priced, easily-available electrical energy is very important to various contemporary society ‘s most significant technologies and SD advances. Meanwhile, the immense mainstream of the global’s electrical energy is produced by means of fossil fuels, which caused stern ecological burdens. Thus, any shift towards a sustainable, thriving future will necessitate resources of electrical energy, which can offer the benefits of current ‘s power production system whilst diminishing its harmful impacts. One possible solution to this situation is the extensive assessment of the three sustainability pillars (economic, environmental, and social) associated with electricity generating technologies. This will assist all stakeholders involved in decision making process to invest in technologies, which will make significant contribution to SD. Increasing the demand for power reinforces the necessity for reducing effects from electrical energy production per unit generated. Worldwide electrical energy generation grew at an annual average of 3.5% from 2003 to 2013 (Hans and
Anders, 1999; Hatice et al, 2016; Hiroki and Yue, 2017; Hondo, 2005; Hrayshat, 2009).
Forecasts have demonstrated that, in the present coal reliance is not lowered, coal-based power plants within emerging nations alone will generate more greenhouse gas emissions than the whole OECD energy sector in the year 2030 (Ishan and Pallav, 2017; Ivan et al, 2016; Janie and Anthony, 2017; Jelena et al, 2012). The effects of emerging countries working in achieving improved lifestyles, driving by inhabitants’ increase can further upsurge the electrical energy usage rates. To achieve growing power supplies with negligible ecological effect, shift to the present electricity production practices are needed to take in augmented power efficiency as of fossil fuel burning technologies by introducing renewable energy sources into the market. However, fossil fuels electricity generating resources provide high reliability and low-priced. Therefore, cautious ecological assessment regarding each technology is required to manage upcoming investment and policy. In this paper, we assessed the sustainability of 9 power production, including coal, gas, nuclear, wind offshore, wind onshore, biomass, geothermal, solar thermal, hydro, on basis of the greenhouse gas Grid Emission Factor (GEF) is the total amount of GHGs emitted per unit of electricity generated for and distributed by an electricity grid, taking in account imports and exports of electricity from the interconnection with other grids. These emissions comprise methane (CH₄); carbon oxide (CO); carbon dioxide (CO₂); mercury (Hg); nitrous oxide (N₂O); ammonia (NH₃); nitrogen oxide (NOX); lead (Pb); sulphur hexafluoride (SF₆); sulphur dioxide (SO₂); volatile organic compounds (VOC0. The GEF is typically expressed as t CO2e/MWh. CO2e is used to denote the inclusion of non-CO2 gases.
2.
Existing literatures
The aim of any significant work is to bring significant contribution to the body of knowledge. In light of this, the present study identified gap in the existing literature through a thorough critical assessment of a set of previous studies that used Life Cycle Environmental Assessment (LCEA) tool to assess the environmental aspect of electricity generating technologies. It should be noted that the environmental system boundaries considered in those previous studies are also scrutinized. This section aims at scrutinizing all the studies that used only Life Cycle Assessment (LCA) tool to assess the environmental aspect of electricity generating technologies. It should be noted that the environmental system boundaries considered in these are also scrutinized.
Ning et al [1] carried out a sustainability study regarding the electricity sector in China. The focus was on thermal power, hydropower, solar PV, nuclear power, and wind power. The system boundaries considered here for the sustainability assessment comprised Extraction of Raw Material (ERM), Conversion of Raw Material into Electricity (CRE), and Transport and Distribution of Electricity (TDE). To this end, the sustainability of this study is not complete because the authors focused only on the environmental aspect ignoring two crucial sustainability pillars which are economic and social aspects. Additionally, the environmental assessment of power plants is naïve since the TRM was left out. Therefore, one should not fully rely on the results of this study. In light with this, the findings gathered by the authors show that there are discrepancies regarding Global Warming Potential (GWP) of those power plants. Particularly, thermal power release 19, 66, 123, and 164 times more emissions comparing to solar PV, hydro, wind, and nuclear power plants, separately. Furthermore, there are inconsistencies in the GWP about 1 kWh of thermal power regarding different regions and national average. Lastly, the outcomes show that there are incongruities in the GWP of hybrid power concerning various regions. For example, the results show that Inner Mongolia and Qinghai have the largest and the smallest GWP for 1 kWh of hybrid electricity supply, respectively.
and energy scenarios for 2030 and 2050 were evaluated. To this end, the sustainability of this study is not complete because the authors focused only on the environmental aspect ignoring two crucial sustainability pillars which are economic and social aspects. Additionally, the environmental assessment of power plants is naïve since the ERM and TDE were left out. The findings of this study demonstrate that the life cycle GHG per PJ energy generated may be importantly lessen (from 68 to 17 Gg CO2- eq/PJ) by increasing the deployment of wind and residual biomass power plants. Energy crops for producing biofuels and the deployment of these biofuels for heavy terrestrial transport contribute significantly to the pollution of the environment in the 2050 scenarios, specially emissions generated from upstream due to land occupation, fertilizer use and nitrogen oxides emissions emitting during the TRM. Land used by energy crop production augmented to an array of 600–2100 106 m2 /PJ depending on the quantity and kinds of energy crops introduced.
Turconi et al [32] conducted a critical assessment of 167 case studies. These studies focused on the LCA of power generating sources (coal, natural gas, oil, nuclear, biomass, hydroelectric, solar PV and wind. The authors aimed at determining extent of emission regarding GHG, nitrogen oxide, and sulphur dioxide associated with different technologies. However, the study conducted by these authors based on the critical appraisal of those 167 case studies does not add significant value to the field of sustainability. Because the sustainability frameworks of those studies are not comprehensive since they focused only on the environmental aspect leaving out two critical sustainability pillars which are economic and social aspects. In addition, the environmental analysis of those study including for Turconi et al [32] is biased since the TRM and TDE are ignored. The findings demonstrate that most of emissions are emitted during the operation of the plant and are generated by fossil fuel technologies. In contrast, fuel provision was the major contributor concerning biomass technologies (71% for GHG, 54% for NOx and 61% for SO2) and nuclear power (60% for GHG, 82% for NOx and 92% for SO2). The construction of infrastructures offered the contribute significantly for renewable energy sources. Therefore, this critical review shows that the inconsistency of current LCA outcomes for power production plants can give rise to contradictory decisions concerning the environmental impacts of implementing new technologies. in their works Rita et al [2] and Hans & Anders [3] performed an environmental assessment of different electricity generating sources. The authors focused only on one aspect of sustainable development. Due to this blow, the results of this work should not have been fully relied on. As the authors missed to include other two critical aspects of sustainability, which are financial and social aspects of a power production plant. Fatemeh et al [25] conducted a critical literature review of previous LCA studies. However, as mentioned in the lines above that an -in-depth sustainable development evaluation takes into account three main components, thus, the results of this work should not be fully relied on. As the authors missed to include other two critical aspects of sustainability, which are financial and social aspects of a power production plant.
Due to non-inclusion of economic and social aspects in the framework, therefore, one should not fully rely on the findings presented in this study in terms of sustainable development. Another bias is based on TDE, which is not included in the environmental assessment. The findings illustrate that the major hotspots are energy crops cultivation and the management of digestate, largely owing to both NOx and CH4 emissions, affecting Global Warming, Acidification, Marine and Freshwater Eutrophication.
Yemane et al [12] carried out an environmental analysis concerning three biomass-based options cases that characterised energy transition and transformation of power sector in Canada, with the dominant case of coal electrical energy generating source. This study treats the sustainability matter naively because it does not cover social aspect and also the environmental assessment include only the PRM phase ignoring three main phases ERM, TRM, and TDE. To this end, the findings collected concerning the biomass environmental life cycle demonstrated a significant improvement from 47 to 92% for global warming, 46 to 90% for mankind health, and 47 to 91% for environmental issues comparing to coal-fired power plant case. In contrast, the coal power production plant showed roughly 63-83% less life cycle cost impact than other options.
Sastre et al [15] conducted a sustainability assessment study of electricity in Spain. The aim of their study was to offer more accurate findings regarding LCA of electrical energy production from wheat straw grown by including certain factor ambiguity and erraticism in the inventories. Their findings demonstrate that most of the simulations electrical energy generated through the combustion of wheat straw biomass release very few GHG emissions and used up not as much of fossil energy than electrical energy produced by gas technology. But, their findings also revealed that only 58% of the simulations met the sustainability target of 60% GHG savings as recommended by the European Union (EU). Although, the results of this study shows a significant saving of GHG emissions of around 58%, the sustainability analysis is still incomplete since economic and social aspects, which two fundamental sustainability aspects were ignored. Furthermore, the environmental assessment only considered the ERM and CRE stages ignoring other crucial life cycle stages. To this end, one should not fully rely on the results of this study because it does not meet the requirement of a holistic sustainability framework.
Santoyo-Castelazo et al [13] used LCA approach to assess the environmental sustainability of electricity generating sources in Mexico, where 79% of electricity is generated from fossil fuels, hydropower 13.5%, geothermal 3% and wind 0.02% and 4.8% is produced by nuclear technology. The findings of this study show that 225 TWh of electrical energy produced emit at least 129 million tonnes of CO2 eq. per annum, most of which (87%) is because of the burning of fossil fuels. Whereas, hydropower, geothermal, wind and nuclear contribute only 1.1% to the overall CO2 eq. Despite this, the sustainability framework developed by Santoyo- Castelazo et al [13] is biased because it only focused on environmental aspect, thus, leaving out economic and social impacts of the power plants. Additionally, some important environmental indictors, such as ERM, TRM, and TDE.
important diminution of all ten life cycle issues comparing to the 2014 circumstances and up to an 80% decrease. However, this study does not also add substantial value to the field of sustainability. Because the sustainability framework developed concentrated only on the environmental aspect ignoring two critical sustainability pillars which are economic and social aspects. Additionally, the environmental analysis is not complete since the ERM, TRM, and TDE stages were not included in the framework.
Paul et al [16] assessed the impact of life cycle GHG emissions per MWh of electrical energy generated, this is based on a range of various power production plant for Australian electricity sector. They findings show that Liquefied natural gas does not emit a lot of GHG emission as black coal, however, the difference is minor for OCGT plant and for CSG. In accordance with their results traditional natural gas consumed within a traditional OCGT plant is roughly 38% less GHG intensive throughout its life cycle than black coal consumed in a sub-critical plant, per MWh of electrical energy generated. Paul et al (2012) point out that, if OCGT combustion is compared to the most efficient new ultra-supercritical coal-fired power, the difference narrows significantly. Coal seam gas LNG is roughly 13–20% more GHG intensive during its life cycle, on a like-for-like basis, than conventional LNG, and thus compares less favourably to coal than conventional LNG under all technology combinations. But, this study does not also add significant value to the field of sustainability. Since the sustainability framework developed is incomplete due to the fact that they authors considered only the environmental aspect disregarding two critical sustainability pillars which are economic and social aspects. Additionally, the environmental analysis is not complete since the ERM, TRM, and TDE stages were not included in the framework.
Andrew et al [18] applied LCA to a 3 kW hydro-power located in Thailand. The authors considered the cradle to grave assessment framework for the hydropower during a period of two decades, as well as all appropriate equipment, materials and transportation. Their findings demonstrate that when comparing small-scale hydropower plant with largescale hydropower plant. The former one has a greater environmentally impact per kWh of electricity generated and perform less well environmentally than latter one. However, the results show that hydropower unit used in this study produce better ecological and financial results than diesel generator and grid connection options. However, the framework developed in this study is biased and does not also add substantial value to the field of sustainability. since the authors considered only the environmental impact, thus, disregarding two critical sustainability pillars which are economic and social aspects. Additionally, the environmental analysis itself is not complete due to lack of the ERM, TRM, and TDE stages in the framework.
Oliveira et al [17] developed a LCA model to assess the impacts of the climate change, mankind toxicity, particulate matter formation, and fossil resource diminution. Various power plants mix were deployed to demonstrate cases where the designated technologies meet particular applications. Their findings show that the impacts renewable energy sources during the employment phase of the storage technologies is insignificant. Belgium electricity mix of 2011 was used as benchmark, the sodium sulphur battery is revealed to be the best performer for all the impacts assessed. With pumped hydro storage ranks at the second position. Considering infrastructure and end of life, the findings illustrate that battery systems have higher impacts due to lower number of cycles and life time energy. However, the framework developed in this study is biased and does not also add substantial value to the field of sustainability. Because the authors took only the environmental aspect into account, therefore, ignoring two significant sustainability aspects, which are financial and social aspects. In addition, the environmental analysis itself is not complete because it did not cover the ERM, TRM, and TDE stages in the framework.
environmental analysis would have enabled them to assess the impact of the electrical energy demand on the GHG emissions. the authors state that due to the LCA tool, the carbon dioxide equivalent content does not only reflect activities associated with the electricity generation in a power plant, however, including GHG emissions associated with the construction of the plant and the fuel supply chain. In their work Messagie et al [21] focused on nuclear, oil, coal, natural gas, bio-waste, blast furnace gas, wood, solar PV, hydro-power installations and wind power plants. However, the downside with this study is that it cannot fully be relied on since is messing critical information regarding some aspects of sustainability such as economic and social impacts. In addition, the environmental appraisal of those power production plant is not comprehensive because of lack of the TRM, and TDE stages in the analysis. The results of this work indicate that electricity produced through the wind and solar power plants is more carbon intensive than the electrical energy generated by thermal power plants, one possible explanation is because of the lower electricity output. The total average GWP per kWh was 0.184 kg CO2eq/kW h. over the 2011, the authors argued that this figure varies from a minimum of 0.102 kg CO2eq/kW h to a maximum of 0.262 kg CO2eq/kW h depending on the timing.
Meier et al [20] investigated the sustainability of natural gas power plant for the electricity sector in United States. In their work Meier et al [20] viewed natural gas as a sustainable carbon-lowering measure. Their results indicate that important GHG emissions are emitted into the environment during the gas power plant’s upstream, mostly over fuel- cycle operations. The authors tested two carbon- lowering measures making use of life-cycle emission rates developed for the United States power sector. Depending fully on new natural gas units for CSA compliance can necessitate a 600% growth in natural gas produced electrical energy and practically full shift of coal from the fuel mix. On the other hand, a 240% growth in nuclear or renewable energy sources achieve the same target with minimal coal usage. The authors concluded their work by arguing that their study illustrate that how disregarding life-cycle GHG, particularly those being generated in upstream of the gas power plant, can lead to flawed appraisal of supply side compliance options. However, there is an important gap in this study due to sustainability framework developed, which treats the sustainability issues naively. Because, the model is pure environmental, thus, it does not consider the impacts associated with economic and social aspects. Another prejudice to this study is that the environmental evaluation of the power plants leaves out some crucial stages of life cycle such as ERM, TRM, and TDE.
Changqing et al [19] used LCA approach to compare the environmental sustainability of biomass and coal-fired plant. The focus of the environmental analysis was on TRM, PRM, and TDE. His findings demonstrate that for each biomass based scenario, the driving elements polluting the environment comprise GHG emissions such as nitrogen oxides, phosphorus, mercury, and particulate matter. Additionally, CO2 produced from CH4 burning, road transport, and electrical energy use contribute significantly to the pollution of the environment. But, when comparing with coal-fired power plant, it generates important ecological benefits in most key categories with the exception of climate change and human toxicity. Hence, in accordance with the results biomass is not totally cleaner than fossil fuel. however, this study does not add much on sustainability field. Because of lack of economic and social impacts in the assessment and in the context of environmental analysis there ERM stage was not considered. Thus, this gag needs to be filled in order to have a comprehensive assessment.
that Gas-fired CT plant has the least ETW water use estimated at 960 g/kWh, which is 34-60% lesser than China's current coal power plant. However, this study does not also add substantial value to the field of sustainability. Because the sustainability framework developed concentrated only on the environmental aspect ignoring two critical sustainability pillars which are economic and social aspects. Additionally, the environmental analysis is not complete since the TRM, and TDE stages were not included in the framework.
Yaw et al [24] conducted a critical review of 79 studies based on LCA of onshore and offshore winds, hydropower, wave and tidal energy, geothermal, solar PV, solar thermal, biomass, waste, and heat pumps. The results show that offshore wind had the least GHG emissions since its life cycle GHG emissions was estimated at 5.3–13 gCO2 eq/kWh. The findings also revealed that GHG generated by fossil fuel heat and electricity are relatively higher compared to renewable energy sources without considering nuclear technology. In their work Yaw et al (2014) considered renewable energy sources, waste treatment and dedicated biomass technologies (DBTs) were found to potentially have high GHG emissions based on the feedstock, selected boundary and the inputs required for their production. Though, the authors have given insight regarding environmental assessment of different power plants, the sustainability appraisal itself is not complete since it is missing some crucial information regarding economic and social impacts. Furthermore, the environmental assessment did not consider some important life cycle stage, such as TRM, and TDE.
Manfred [22] reviewed a set of studies regarding environmental impact of nuclear technology. The results show that the GHG emissions emitted by nuclear power plants using the reactor of types LWR and HWR range from 0.1 and 0.3 kWh, and on average about 0.2 kWh for every kWh of electrical energy produced. These energy intensities translate into GHG emissions for LWR and HWR ranging from 10 and 130g CO2- e/kWh, with an average of 65 g CO2-e/kWh. Despite the fact these GHG emissions are expectedly lower than those of fossil technologies (typically 600– 1200 g CO2-e/kWh), they are higher than reported figures for wind turbines and hydroelectricity (around 15–25 g CO2-e/kWh) and in the order of, or slightly lower than, solar PV or solar thermal power (around 90 g CO2-e/kWh). However, the downside with this study is that it cannot fully be relied on since is messing critical information regarding some aspects of sustainability such as economic and social impacts. In addition, the environmental appraisal of those power production plant is not comprehensive because of lack of the ERM, TRM, and TDE stages in the analysis.
3.
Conceptional framework
integrated sustainability assessment framework for power generation plants, the 183 studies were labelled on the basis of a set of standards, involving the general type of sustainability analysis used, the lifecycle phases (i.e, extraction of raw material, transportation of raw material, conversion of raw material into electricity, transmission and distribution of electricity to end-users); sustainability pillars taken into account (i.e. environmental, economic, and social aspects), the type of indicators used to assess the economic, environmental, and social impacts of different power generation plants. The outcomes of the critical appraisal of literature review generated various conclusions, first and foremost in current decade there has been a significant growth regarding the number of articles published related to sustainability in the electricity industry. Renewable Sustainable Energy Reviews was most represented in the literature review, with 61 of the 183 journal articles, followed by Energy Policy with 52 articles, Journal of Cleaner Production ranks at the third position with 28 articles, Energy with 25 articles, Applied Energy 21, Sustainability 14, Energies 10, Technological Forecasting and Social Change 9, and Renewable Energy 7 articles. Whereas, the remaining of the appropriate journals were just about equally distributed with low frequency (1-6 articles). Furthermore, the results of literature survey revealed that 77% of studies performed in electricity sector focused separately either on economic, environmental, or social aspects of power plants, while 7% attempted to combined only two aspects, and only 16% of the works attempted to incorporate all the three sustainability pillars into one framework. Supporting the idea that the electricity sector would benefit from a holistic and comprehensive framework for sustainability assessment. Based on the gap identified in the previous studies, this study as expanded the environmental analysis framework as per table 2 below. The environmental system boundaries considered in this study of each electricity generating source account for the cradle-to-grave. The boundaries include four lifecycle phases as presented in the table 2 below. It should be noted that geothermal, wind, water, solar, electricity producing sources do not require extraction neither transportation, thus they are not considered in these stages.
Table 2. Expanded environmental assessment framework Environmental system boundaries
Technologies ERM TRM CRE TDE
Coal
×
×
×
×
Gas
×
×
×
×
Nuclear
×
×
×
×
Biomass
×
×
×
×
Wind offshore
×
×
Wind onshore
×
×
Geothermal
×
×
Solar thermal
×
×
Hydro
×
×
4. Research findings
4.1 Environmental profile for coal power plant
Table 3. Life cycle greenhouse gas emissions for coal power plant
Coal Life Cycle Greenhouse Gases Emissions (kg/MWh)
GHGs ERM TRM CRE TDE Total
CH₄ 4.952E+00 7.694E‐02 2.328E‐01 0.00E+00 5.262E+00
CO 2.124E‐01 2.784E‐01 3.568E+01 0.00E+00 3.617E+01
CO₂ 4.255E+02 6.823E+01 2.323E+03 0.00E+00 2.817E+03
Hg 3.759E‐04 6.218E‐04 4.862E‐03 0.00E+00 5.859E-03
N₂O 3.326E‐03 2.283E‐03 7.924E‐01 0.00E+00 7.980E-01 NH₃ 3.675E‐03 3.113E‐02 2.745E-02 0.00E+00 6.225E-02 NOx 2.784E‐01 2.517E‐01 2.473E+00 0.00E+00 3.003E+00
Pb 2.597E‐03 7.684E‐04 3.746E‐02 0.00E+00 4.082E-02
SF₆ 3.162E‐02 3.455E‐04 7.431E‐02 3.268E+00 3.374E+00 SOx 4.436E‐01 6.628E‐02 5.243E‐01 0.00E+00 1.034E+00 VOC 3.971E‐02 3.726E‐02 6.262E‐04 0.00E+00 7.759E-02
CO2e/MWh 4.32E+02 6.897E+01 2.362E+03 3.268E+00 2.866E+03
4.2 Environmental profile for gas power plant
Table 4. Life cycle greenhouse gas emissions for gas power plant
Gas Life Cycle Greenhouse Gases Emissions (kg/MWh)
GHGs ERM TRM CRE TDE Total
CH4 2.82E+00 8.78E‐01 6.87E‐02 0.00E+00 3.77E+00
CO 5.46E‐02 7.34E‐02 4.21E‐02 0.00E+00 6.62E‐02
CO2 3.08E+01 4.86E+00 5.97E+02 0.00E+00 6.33E+02
Hg 8.29E‐02 6.28E‐03 3.57E‐03 0.00E+00 9.28E‐02
N2O 7.64E‐02 5.94E‐04 2.53E‐03 0.00E+00 7.95E‐02
NH₃ 2.11E‐03 2.19E‐04 2.95E‐01 0.00E+00 5.28E‐01
NOX 5.93E‐04 8.81E‐03 4.16E‐02 0.00E+00 1.89E‐01
Pb 2.95E‐01 2.76E‐02 3.82E‐02 0.00E+00 3.61E‐01
SF6 3.52E‐02 9.88E‐04 7.43E‐04 3.27E+00 3.31E+00
SO₂ 6.98E‐03 4.26E‐01 2.28E‐02 0.00E+00 5.19E‐02
VOC 4.92E‐03 5.69E‐03 4.83E‐01 0.00E+00 4.94E‐01
CO2e/MWh 7.98E+01 4.87E+01 5.97E+02 3.27E+00 7.28E+02
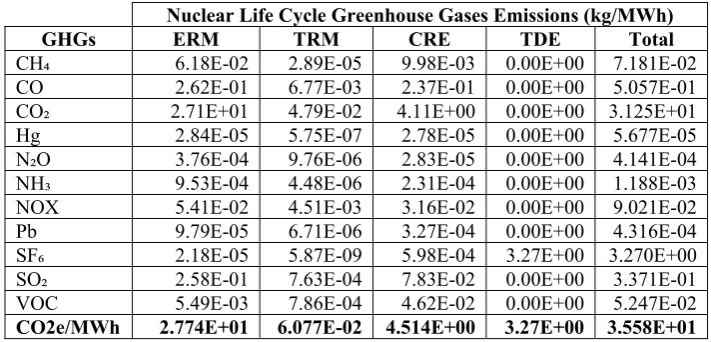
4.3 Environmental profile for nuclear power plant
Table 5. Life cycle greenhouse gas emissions for nuclear power plant
Nuclear Life Cycle Greenhouse Gases Emissions (kg/MWh)
GHGs ERM TRM CRE TDE Total
CH₄ 6.18E‐02 2.89E‐05 9.98E‐03 0.00E+00 7.181E-02
CO 2.62E‐01 6.77E‐03 2.37E‐01 0.00E+00 5.057E-01
CO₂ 2.71E+01 4.79E‐02 4.11E+00 0.00E+00 3.125E+01
Hg 2.84E‐05 5.75E‐07 2.78E‐05 0.00E+00 5.677E-05
N₂O 3.76E‐04 9.76E‐06 2.83E‐05 0.00E+00 4.141E-04
NH₃ 9.53E‐04 4.48E‐06 2.31E‐04 0.00E+00 1.188E-03
NOX 5.41E‐02 4.51E‐03 3.16E‐02 0.00E+00 9.021E-02
Pb 9.79E‐05 6.71E‐06 3.27E‐04 0.00E+00 4.316E-04
SF₆ 2.18E‐05 5.87E‐09 5.98E‐04 3.27E+00 3.270E+00
SO₂ 2.58E‐01 7.63E‐04 7.83E‐02 0.00E+00 3.371E-01
VOC 5.49E‐03 7.86E‐04 4.62E‐02 0.00E+00 5.247E-02
4.4 Environmental profile for biomass power plant
Table 6. Life cycle greenhouse gas emissions for biomass power plant
Biomass Life Cycle Greenhouse Gases Emissions (kg/MWh)
GHGs ERM TRM CRE TDE Total
CH₄ 5.678E+00 8.256E‐02 1.257E‐01 0.00E+00 5.886E+00
CO 4.791E‐01 2.734E‐02 2.745E+01 0.00E+00 2.795E+01
CO₂ 9.328E+01 7.895E+00 1.457E+03 0.00E+00 1.558E+03
Hg 4.854E‐04 9.381E‐04 3.546E‐01 0.00E+00 3.560E-01
N₂O 4.964E‐03 3.586E‐03 2.584E‐03 0.00E+00 1.113E-02
NH₃ 5.485E‐03 2.762E‐03 8.397E‐02 0.00E+00 9.223E-02
NOx 3.842E‐01 2.423E‐02 9.387E‐01 0.00E+00 1.347E+00
Pb 3.878E‐04 2.295E‐04 2.376E‐02 0.00E+00 2.437E-02
SF₆ 3.969E‐03 3.789E‐05 2.829E‐02 3.268E+00 3.300E+00
SOx 5.649E‐01 5.987E‐02 4.897E‐01 0.00E+00 1.114E+00
VOC 6.735E‐02 3.873E‐03 4.323E‐01 0.00E+00 5.035E-01
CO2e/MWh 1.005E+01 8.100E+00 1.487E+03 3.268E+00 1.508E+03
4.5 Environmental profile for wind onshore power plant
Table 7. Life cycle greenhouse gas emissions for wind onshore power plant
Wind Onshore Life Cycle Greenhouse Gases Emissions (kg/MWh) CRE facility
GHGs TRKC TBNM WFC WFO LFW
CH₄ 9.448E-03 8.97E-02 5.43E-03 3.23E-02 3.11E‐04 0.00E+00
CO 8.72E‐02 3.12E‐01 9.64E‐02 2.47E‐03 8.29E‐05 0.00E+00
CO₂ 9.39E-01 4.47E+00 2.15E-01 1.44E-01 1.06E-02 0.00E+00
Hg 7.23E‐06 8.96E‐07 4.45E‐09 2.45E‐10 4.97E‐11 0.00E+00
N₂O 3.32E-04 9.36E-03 5.68E-04 6.41E-04 8.74E‐08 0.00E+00
NH₃ 4.35E‐04 2.37E‐04 4.46E‐04 2.23E‐05 3.32E‐07 0.00E+00
NOX 2.71E‐02 9.82E‐02 4.26E‐03 3.26E‐03 9.46E‐05 0.00E+00
Pb 2.17E‐04 5.68E‐04 4.82E‐05 7.34E‐07 4.96E‐10 0.00E+00
SF₆ 1.53E-05 6.96E-04 8.203E-06 8.35E-07 2.63E‐15 3.27E+00
SO₂ 3.58E‐02 2.61E‐01 3.21E‐03 8.45E‐04 4.79E‐05 0.00E+00
VOC 2.68E‐03 3.86E‐02 6.52E‐03 2.34E‐04 2.87E‐05 0.00E+00
CO2e/MWh 1.102E+00 5.287E+00 3.326E-01 1.83E-01 1.12E-02 3.27E+00
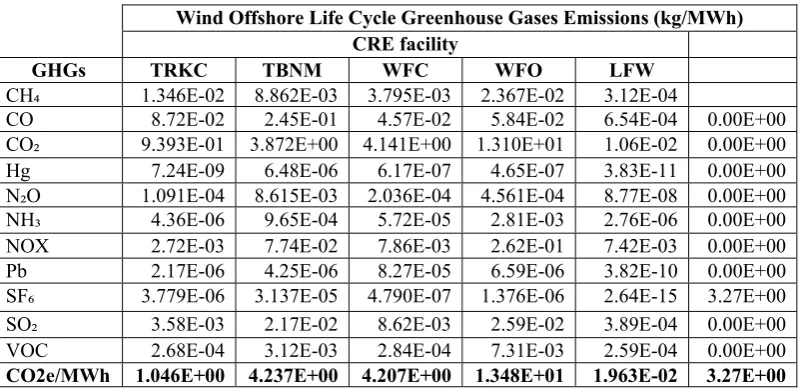
4.6 Environmental profile for wind offshore power plant
Table 8. Life cycle greenhouse gas emissions for wind offshore power plant
Wind Offshore Life Cycle Greenhouse Gases Emissions (kg/MWh) CRE facility
GHGs TRKC TBNM WFC WFO LFW
CH₄ 1.346E-02 8.862E-03 3.795E-03 2.367E-02 3.12E‐04
CO 8.72E‐02 2.45E‐01 4.57E‐02 5.84E‐02 6.54E‐04 0.00E+00
CO₂ 9.393E-01 3.872E+00 4.141E+00 1.310E+01 1.06E‐02 0.00E+00
Hg 7.24E‐09 6.48E‐06 6.17E‐07 4.65E‐07 3.83E‐11 0.00E+00
N₂O 1.091E-04 8.615E-03 2.036E-04 4.561E-04 8.77E‐08 0.00E+00
NH₃ 4.36E‐06 9.65E‐04 5.72E‐05 2.81E‐03 2.76E‐06 0.00E+00
NOX 2.72E‐03 7.74E‐02 7.86E‐03 2.62E‐01 7.42E‐03 0.00E+00
Pb 2.17E‐06 4.25E‐06 8.27E‐05 6.59E‐06 3.82E‐10 0.00E+00
SF₆ 3.779E-06 3.137E-05 4.790E-07 1.376E-06 2.64E‐15 3.27E+00
SO₂ 3.58E‐03 2.17E‐02 8.62E‐03 2.59E‐02 3.89E‐04 0.00E+00
VOC 2.68E‐04 3.12E‐03 2.84E‐04 7.31E‐03 2.59E‐04 0.00E+00
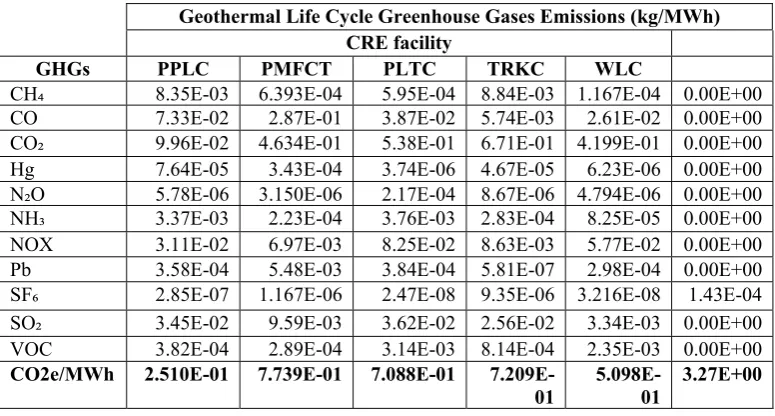
4.7 Environmental profile for Geothermal power plant
Table 9. Life cycle greenhouse gas emissions for geothermal power plant
Geothermal Life Cycle Greenhouse Gases Emissions (kg/MWh) CRE facility
GHGs PPLC PMFCT PLTC TRKC WLC
CH₄ 8.35E‐03 6.393E-04 5.95E‐04 8.84E‐03 1.167E-04 0.00E+00
CO 7.33E‐02 2.87E‐01 3.87E‐02 5.74E‐03 2.61E‐02 0.00E+00
CO₂ 9.96E‐02 4.634E-01 5.38E‐01 6.71E‐01 4.199E-01 0.00E+00
Hg 7.64E‐05 3.43E‐04 3.74E‐06 4.67E‐05 6.23E‐06 0.00E+00
N₂O 5.78E‐06 3.150E-06 2.17E‐04 8.67E‐06 4.794E-06 0.00E+00
NH₃ 3.37E‐03 2.23E‐04 3.76E‐03 2.83E‐04 8.25E‐05 0.00E+00
NOX 3.11E‐02 6.97E‐03 8.25E‐02 8.63E‐03 5.77E‐02 0.00E+00
Pb 3.58E‐04 5.48E‐03 3.84E‐04 5.81E‐07 2.98E‐04 0.00E+00
SF₆ 2.85E‐07 1.167E-06 2.47E‐08 9.35E‐06 3.216E-08 1.43E‐04
SO₂ 3.45E‐02 9.59E‐03 3.62E‐02 2.56E‐02 3.34E‐03 0.00E+00
VOC 3.82E‐04 2.89E‐04 3.14E‐03 8.14E‐04 2.35E‐03 0.00E+00
CO2e/MWh 2.510E-01 7.739E-01 7.088E-01 7.209E-01
5.098E-01
3.27E+00
4.8 Environmental profile for solar thermal power plant
Table 10. Life cycle greenhouse gas emissions for solar thermal power plant
Solar Thermal Life Cycle Greenhouse Gases Emissions (kg/MWh)
CRE facility TDE Total
GHGs PLTC CLTC STO TRKC
CH₄ 4.12E-03 6.13E-02 5.78E-02 5.23E-04 0.00E+00 1.237E-01
CO 5.99E‐02 7.86E‐02 5.98E‐01 3.65E‐03 0.00E+00 7.401E-01
CO₂ 2.73E+00 1.110E+01 2.80E+01 4.07E-01 0.00E+00 4.226E+01
Hg 2.76E‐08 8.83E‐06 3.86E‐09 2.87E‐09 0.00E+00 9.521E-06
N₂O 2.15E-05 6.987E-03 8.07E-04 5.25E-06 0.00E+00 7.821E-03
NH₃ 5.21E‐05 2.97E‐05 6.88E‐06 2.15E‐06 0.00E+00 9.083E-05
NOX 2.83E‐02 4.64E‐02 5.24E‐02 6.32E‐04 0.00E+00 1.277E-01
Pb 2.77E‐06 2.67E‐05 5.85E‐08 3.68E‐07 0.00E+00 3.042E-05
SF₆ 1.27E-05 6.221E-06 1.22E-06 5.37E-09 3.27E+00 3.268E+00
SO₂ 4.26E‐03 6.39E‐02 3.48E‐03 9.12E‐04 0.00E+00 7.255E-02
VOC 7.61E‐04 3.86E‐02 8.51E‐03 5.85E‐05 0.00E+00 4.792E-02
CO2e/MWh 2.83E+00 1.139E+01 2.87E+01 4.13E-01 3.27E+00 4.665E+01
4.9 Environmental profile for hydro power plant
Table 11. Life cycle greenhouse gas emissions for hydro power plant
Hydro Life Cycle Greenhouse Gases Emissions (kg/MWh) CRE facility TDE Total
GHGs TRKC DHFC HPO
CH₄ 1.337E-04 8.306E-03 3.62E-01 0.00E+00 3.703E-01
CO 4.49E‐02 2.28E‐01 0.00E+00 0.00E+00 2.729E-01
CO₂ 6.426E-02 9.97E+00 2.92E+01 0.00E+00 3.924E+01
Hg 3.73E‐07 6.35E‐04 0.00E+00 0.00E+00 6.387E-04
N₂O 1.286E-05 6.036E-05 0.00E+00 0.00E+00 7.322E-04
NH₃ 2.51E‐04 3.52E‐03 0.00E+00 0.00E+00 3.771E-03
NOX 7.86E‐03 2.83E‐02 0.00E+00 0.00E+00 3.616E-02
SF₆ 1.355E-06 5.652E-06 0.00E+00 2.54E-04 2.610E-04
SO₂ 2.18E‐03 2.34E‐02 0.00E+00 0.00E+00 2.558E-02
VOC 7.71E‐07 6.82E‐03 0.00E+00 0.00E+00 6.827E-03
CO2e/MWh 1.19E-01 1.03E+01 2.96E+01 2.54E-04 3.99E+01
5. Data analysis
This section aims at analyzing the results of the greenhouse gas grid emission factor for each electricity generating technology as presented in the previous section. The analysis is based on the entire life cycle.
5.1 Environmental assessment for coal power plant
Figure 1. life cycle greenhouse gas for coal power plant
From the figure above, it can be depicted that the life cycle greenhouse gas grid emission factor of coal electricity generating source varies widely depending upon life cycle stage. For instance, at ERM the GEF is around 432 kg CO2e/MWh this is due to various activities involved during the extraction process of raw material. This amount goes down to 68.97 CO2e/MWh at TRM this is due to the transport system and the distance from the mining to the plant. Generally, coal is always moved by railway or truck. Direct ecological effects can take place at the mine, where the coal is being moved, conveyed or loaded. indirect ecological bearings from coal transportation mainly result from the combustion of fuel for the transportation itself. No surprisingly, the figure of GEF increases at 2 362 kg CO2e/MWh at CRE. Whilst, at TDE stage the GEF decreases to 3.268. it should be noted that at TDE stage only the Sulphur hexafluoride is realised into the air. The reason may be due to the fact it is seen as an excellent electrical insulator for high voltage.
0 500 1000 1500 2000 2500
(kg CO2e/MW
h) ERM
5.2 Environmental assessment for gas power plant
Figure 2. life cycle greenhouse gas for gas power plant
The figure 2 above shows that the GEF related to ERM and TRM of gas power range from 79.8 kg CO2e/MWh to 48.7 kg CO2e/MWh. The results for ERM is mostly influenced by various fluids for hydraulic fracturing that are often employed to extract the gas, and most of those fluids contain various chemical compounds. Whilst, the GEF results for TRM depend largely upon the distance and pipeline leakage. At the CRE stage, the figure increases to 597 kg CO2e/MWh, and TDE it goes down to 3.27 kg CO2e/MWh. As with coal energy generating source at TDE stage when conveying the electricity from gas to the end-users the Sulphur hexafluoride is realised into the air. The reason may be due to the fact it is seen as an excellent electrical insulator for high voltage.
5.3 Environmental assessment for nuclear power plant
Figure 3. life cycle greenhouse gas for nuclear power plant
Various studies have argued that nuclear energy generating source is the best answer to climate change issue since it does not release greenhouse gas emission into the air. Whilst this argument maybe true, it is also misleading when considering the amount of GHGs that maybe produced by nuclear power plant. Because, during the operation of nuclear power plants there is always an
0 100 200 300 400 500 600
(kg CO2e/MW
h) ERM
TRM CRE TDE
0 5 10 15 20 25 30
(kg CO2e/MW
h) ERM
insignificant GHGs emissions that are realised into the air. For example, in the case of our study we can see nearly 4.51 kg CO2e/MWh are generated during the operation of nuclear power plant. Additionally, the figure 3 above, shows that at ERM stage a significant amount of GHGs are discharged into the environment, these emissions are linked to the activities associated with enrichment of uranium. The TRM of radioactive waste also yields carbon dioxide emissions in our study is estimated at 0.06 kg CO2e/MWh. As with coal energy generating source at TDE stage when conveying the electricity from nuclear to the end-users the amount of Sulphur hexafluoride realised into the air is estimated at 3.27 kg CO2e/MWh. The reason may be due to the fact it is seen as an excellent electrical insulator for high voltage.
5.4 Environmental assessment for biomass power plant
Figure 4. life cycle greenhouse gas for biomass power plant
From the figure above, it can be depicted that the life cycle greenhouse gas grid emission factor of biomass electricity generating source varies widely depending upon life cycle stage. For instance, at ERM the GEF is around 10.05 kg CO2e/MWh this is due to various activities involved during the extraction process of raw material. The GHGs at TRM phases amounted to 8.1 kg CO2e/MWh. Whilst, the figure of GHGs at CRE increases to 1487 kg CO2e/MWh. Lastly, as with other power generating sources presented in the above sections. At TDE stage when conveying the electricity from biomass to the end-users the amount of Sulphur hexafluoride realised into the air is estimated at 3.268 kg CO2e/MWh. The reason may be due to the fact it is seen as an excellent electrical insulator for high voltage.
0 200 400 600 800 1000 1200 1400 1600
(kg CO2e/MW
h) ERM
5.5 Environmental assessment for wind onshore power plant
Figure 5. life cycle greenhouse gas for wind onshore power plant
Unlike with conventional energy sources, the emissions linked to the wind onshore power plant are associated with the activities of manufacturing and constructing of CRE facilities. Since wind does not require extraction and transportation. Thus, considering the impact that wind onshore facilities may have on the environment the figure above shows the life cycle GHGs related to Trunkline Construction (TRKC) amounted to 1.102 kg CO2e/MWh, Turbine Manufacturing (TBNM) estimated at 5.287 kg CO2e/MWh, wind farm operation (WFO) evaluated at 0.183 kg CO2e/MWh, Wind Farm Construction (WFC) amounted to 0.33 kg CO2e/MWh, Landfille Waste (LFW) estimated at 0.011 kg CO2e/MWh. Lastly, as with other power generating sources presented in the above sections. At TDE stage when conveying the electricity from wind onshore to the end-users the amount of Sulphur hexafluoride realised into the air is estimated at 3.27 kg CO2e/MWh. The reason may be due to the fact it is seen as an excellent electrical insulator for high voltage.
5.6 Environmental assessment for wind offshore power plant
Figure 6. life cycle greenhouse gas for wind offshore power plant
As with wind onshore energy sources, the emissions linked to the wind offshore power plant are associated with the activities of manufacturing and constructing of CRE facilities. Since wind
0 1 2 3 4 5 6
(kg CO2e/MW
h)
TRKC TBNM WFC WFO LFW TDE
0 2 4 6 8 10 12 14
(kg CO2e/MW
h)
does not require extraction and transportation. Thus, considering the impact that wind onshore facilities may have on the environment the figure above shows the life cycle GHGs related to Trunkline Construction (TRKC) amounted to 1.046 kg CO2e/MWh, Turbine Manufacturing (TBNM) estimated at 4.23 kg CO2e/MWh, wind farm operation (WFO) evaluated at 13.48 kg CO2e/MWh, Wind Farm Construction (WFC) amounted to 4.21 kg CO2e/MWh, Landfille Waste (LFW) estimated at 0.019 kg CO2e/MWh. Lastly, as with other power generating sources presented in the above sections. At TDE stage when conveying the electricity from wind offshore to the end-users the amount of Sulphur hexafluoride realised into the air is estimated at 3.27 kg CO2e/MWh. The reason may be due to the fact it is seen as an excellent electrical insulator for high voltag
5.7 Environmental assessment for geothermal power plant
Figure 7. life cycle greenhouse gas for geothermal power plant
Geothermal energy is thermal energy produced and stored in the Earth. Thermal energy is the energy that regulates the heat of substance. The geothermal energy of the Earth's crust derives from the creation of the earth (20%) and from radioactive decomposition of natural resources (80%). The geothermal gradient that is the difference within heat involving the heart of the earth and its surface, creates an incessant transmission of electrical energy within the form of temperature from the heart to the surface. Earth's core temperature is thermal energy produced throughout the degeneration of radioactive and constant temperature loss from planet's formation. Hence, it does not require extraction and transportation. Thus, this study presents the life cycle GHGs emissions associated with the manufacturing and construction of geothermal CRE facilities. As it can be seen from the figure 7 above shows that the life cycle GHGs related to Pipeline construction (PPLC) amounted to 0.25 kg CO2e/MWh, Plant construction (PLTC) estimated at 0.71 kg CO2e/MWh, PMFCT evaluated at 0.77 kg CO2e/MWh, Trunkline Construction (TRKC) amounted to 0.72 kg CO2e/MWh, well construction (WLC) estimated at 0.051 kg CO2e/MWh. Lastly, as with other power generating sources presented in the above sections. At TDE stage when conveying the electricity from geothermal to the end-users the amount of Sulphur hexafluoride realised into the air is estimated at 3.27 kg CO2e/MWh. The reason may be due to the fact it is seen as an excellent electrical insulator for high voltage.
0 0.5 1 1.5 2 2.5 3 3.5
(kg CO2e/MW
h)
5.8 Environmental assessment for solar thermal power plant
Figure 8. life cycle greenhouse gas for solar thermal power plant
Energy is captured from radiation and it is converted into heat afterward is employed for producing electrical energy within steam turbines. As with wind energy sources, the emissions linked to the solar thermal power plant are associated with the activities of manufacturing and constructing of CRE facilities. Since wind does not require extraction and transportation. Thus, considering the impact that wind onshore facilities may have on the environment the figure above shows the life cycle GHGs related to plant construction (PLTC) estimated at 2.83 kg CO2e/MWh, collector construction (CLTC) evaluated at 11.39 kg CO2e/MWh, solar thermal operation (STO) estimated at 28.7 kg CO2/MWh, Trunkline Construction (TRKC) amounted to 0.41 kg CO2e/MWh. Lastly, as with other power generating sources presented in the above sections. At TDE stage when conveying the electricity from solar thermal to the end-users the amount of Sulphur hexafluoride realised into the air is estimated at 3.27 kg CO2e/MWh. The reason may be due to the fact it is seen as an excellent electrical insulator for high voltage.
5.9 Environmental assessment for hydro power plant
Figure 9. life cycle greenhouse gas for hydro power plant
The GHGs emissions linked to the hydro power plant are associated with the activities of manufacturing and constructing of CRE facilities. Since water does not require extraction and transportation. Thus, considering the impact that hydro facilities may have on the environment
0 5 10 15 20 25 30
(kg CO2e/MW
h) PLTC
CLTC STO TRKC TDE
0 5 10 15 20 25 30
(kg CO2e/MW
h) TRKC
the figure 9 above shows the life cycle GHGs related to Trunkline Construction (TRKC) amounted to 0.119 kg CO2e/MWh, Dam and Hydropower Facility Construction (DHFC) estimated at 10.3 kg CO2e/MWh, hydro plant operation (HPO) evaluated at 29.6 kg CO2e/MWh. At TDE stage when conveying the electricity from hydro to the end-users the amount of Sulphur hexafluoride realised into the air is estimated at 2.54 kg CO2e/MWh. The reason may be due to the fact it is seen as an excellent electrical insulator for high voltage.
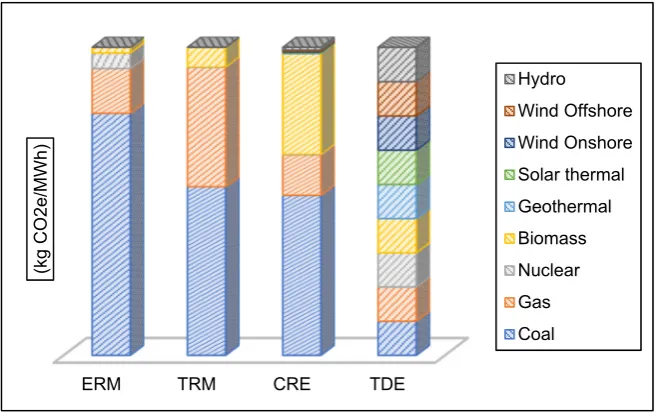
5.10 Comparative environmental assessment results for different power generating plants
Figure 10. life cycle greenhouse gas for different power production plants
From the figure 10 above, it can be depicted the life cycle greenhouse gas grid emission factor results for various technologies. The first impression is that a significant amount of GHGs emissions for the majority of technologies are emitted during the CRE stage. For example, coal, biomass, and gas power generation plants, the core point of greenhouse gas grid emission factor is the combustion of fuel at the CRE stage. Whilst, the major point of GHGs emissions concerning hydropower, is the slow deterioration of plant deposit in the reservoir. The production of naturally-stirring carbon dioxide from geofluid is the main point of greenhouse gas emissions from geothermal energy generating source. Whereas, wind and solar energy sources are different from the technologies highlighted above since their main point of GEF is not generated from the activities associated with operation of the CRE, however, the GEF are linked to the activities related to the manufacturing of equipment and building of the CRE facility. The figure 10 also demonstrates that nuclear is the only energy generating source that has got the highest GEF for ERM than for the CRE. The reason is because the enrichment of uranium requires an important amount of energy that makes the ERM stage the main source of GEF for nuclear power plant. It was also noticed that most of renewable energy sources have the highest assortment of ambiguity in life cycle greenhouse gas emission results. This ambiguity is due to inconsistency aspect of the operation of the plant. For example, the production of electricity from wind depends on the availability and strength of the wind. Whilst, the generation of energy from solar depends on the availability of the sun. this implies that whenever the sky is cloud the amount of electricity is insignificant. Since the GEF of wind energy comprises the allotment of manufacturing and construction emissions per unit of energy generated throughout its lifespan of a wind farm. An akin assumption may be drawn up for solar energy source.
ERM TRM CRE TDE
(kg CO2e/MW
h)
Conclusion
Environmental assessment is a concept that has been designed to facilitate the present generation to meet their needs without compromising the ability of future generations to meet their own needs as well. Thus, this concept has drawn significant attention from various scholars, researchers and industrial practitioners around the world over the past three decades. Life Cycle Environmental Assessment (LCEA) is a widely metric used to assess the potential ecological impacts, which can be caused by electricity generating supply systems or by other systems than power production plants. However, the current LCEA model is biased and ineffective. Because, its omits factors that are increasingly contributing to the ecological degradation. The novel developed LCEA model has been tested and applied to nine power generation plants such as coal, gas, nuclear, biomass, geothermal, hydro, solar thermal, wind onshore and wind offshore. The results have demonstrated that of conventional technologies including coal, gas, and nuclear, coal energy generating source has got the highest life cycle greenhouse gas Grid Emission Factor (GEF) of 2 866 kg CO2e/MWh, followed by gas with 728 kg CO2e/MWh, and nuclear has got the least GEF of 35 kg CO2e/MWh. Whereas of renewable energy sources biomass has got the highest GEF of 1 508 kg CO2e/MWh, followed by solar thermal with 46.6 kg CO2e/MWh, hydro 39 kg CO2e/MWh, wind offshore 25.25 kg CO2e/MWh, wind onshore 10.1 kg CO2e/MWh, and geothermal closes the ranking with 6.23 kg CO2e/MWh. It was depicted that the life cycle greenhouse gas grid emission factor results for various technologies. The first impression is that a significant amount of GHGs emissions for the majority of technologies are emitted during the CRE stage. For example, coal, biomass, and gas power generation plants, the core point of greenhouse gas grid emission factor is the combustion of fuel at the CRE stage. Whilst, the major point of GHGs emissions concerning hydropower, is the slow deterioration of plant deposit in the reservoir. The production of naturally-stirring carbon dioxide from geofluid is the main point of greenhouse gas emissions from geothermal energy generating source. Whereas, wind and solar energy sources are different from the technologies highlighted above since their main point of GEF is not generated from the activities associated with operation of the CRE, however, the GEF are linked to the activities related to the manufacturing of equipment and building of the CRE facility. The figure 10 also demonstrates that nuclear is the only energy generating source that has got the highest GEF for ERM than for the CRE. The reason is because the enrichment of uranium requires an important amount of energy that makes the ERM stage the main source of GEF for nuclear power plant. It was also noticed that most of renewable energy sources have the highest assortment of ambiguity in life cycle greenhouse gas emission results. This ambiguity is due to inconsistency aspect of the operation of the plant. For example, the production of electricity from wind depends on the availability and strength of the wind. Whilst, the generation of energy from solar depends on the availability of the sun. this implies that whenever the sky is cloud the amount of electricity is insignificant. Since the GEF of wind energy comprises the allotment of manufacturing and construction emissions per unit of energy generated throughout its lifespan of a wind farm. An akin assumption may be drawn up for solar energy source.
References
Abbaspour M., Monavari M., Karbassi A & Kargari N.2011. Nuclear Power and Its Role in CO2 Emissions from the Electricity Generation Sector in Iran, Energy Sources, Part A: Recovery, Utilization, and Environmental Effects, 34:1, 43-52, DOI: 10.1080/15567036.2010.483532
Adams, B., Kennedy, A., & Sahely, R.2005. Developing sustainability criteria for urban infrastructure systems. Journal of Civil Engineering, 32, 72-85.
Alexandru M.2014. Sustainability assessment of electricity generation technologies using weighted multi-criteria decision analysis. Energy Policy 65, 284–297
Alvaro R, Edson B , Raphael M.2015. A life cycle assessment of the Brazilian coal used for electric power generation. Journal of Cleaner Production 92,179-186
Amit B, Richard H, Paul F, William R, Nilay S, Niall M,John D, Markus K, Mohammed P, Mathieu I, Jenny J, Nigel B, Ausilio B, Corinne B, Andrew S, Jethro A. 2017. Screening and techno-economic assessment of biomass-based power generation with CCS technologies to meet 2050 CO2 targets. Applied Energy 190, 481–489
Andhra P, India K, Suresh J, Arvind K, Sunil D.2014. A life cycle environmental impact assessment of natural gas combined cycle thermal power plant in. Environmental Development 11, 162–174
Andrew P, Tania U, Andrew M.2011. Life cycle assessment of a community hydroelectric power system in rural Thailand. Renewable Energy 36, 2799-2808
Ángel G., Gonzalo G., Laurence S., Adisa A.2016. Enhanced data envelopment analysis for sustainability assessment: A novel methodology and application to electricity technologies, Computers and Chemical Engineering 90, 188–200
Annette E, Vladimir S, Tim J.2009. Assessment of sustainability indicators for renewable energy technologies. Renewable and Sustainable Energy Reviews 13, 1082–1088
Araújo M, Ribeiro F, Ferreira P,. 2013. Evaluating future scenarios for the power generation sector using a multi-criteria decision analysis (MCDA) tool: the Portuguese case. Energy 2013;52:126–36
Ariaratnam, S & Koo, D.2008. Application of a Sustainability Model for Assessing Water Main Replacement Options. Journal of Construction Engineering and Management, 134, 8, 563-574.
Arvesen A, Hertwich E. 2012. Assessing the life cycle environmental impacts of wind power: a review of present knowledge and research needs. Renewable and Sustainable Energy Reviews 16, 5994–6006
Arvesen A., Ingrid B., Bernhard M., Edgar G.2015. Life cycle assessment of transport of electricity via different voltage levels: A case study for Nord-Trøndelag county in Norway. Applied Energy 157, 144–151
Arvidsson R, Kristin F, Morgan F, Magdalena S, Sverker M. 2012. “Energy Use Indicators in Energy and Life Cycle Assessments of Biofuels: Review and Recommendations.” Journal of Cleaner Production 31, 54–61.
Ays¸ e, Emrah O, Ihsan K., Hameed A. 2017. Life cycle assessment (LCA) of digested sewage sludge incineration for heat and power production, Journal of Cleaner Production 142, 1684-1692
Bohm M. 2007. Capture-ready coal plants – options, technologies and economics. International journal of greenhouse gas control, 1, 113–120.
Bonou , Alexis L, Stig I.2016. Life cycle assessment of onshore and offshore wind energy-from theory to application Alexandra. Applied Energy 180, 327–337
Bridget M. , Zeb J, Carol A. .2009.Comparison of Life Cycle Carbon Dioxide Emissions and Embodied Energy in Four Renewable Electricity Generation Technologies in New Zealand. Environ. Sci. Technol. 2009, 43, 6406–6413
Burcin A, Adisa A.2015. Life cycle environmental impacts of electricity from fossil fuels in Turkey Journal of Cleaner Production 106, 555-564
Burcin A, Adisa A.2016. Renewable electricity in Turkey: Life cycle environmental impacts. Renewable Energy 89, 649-657
Cameron M, John B, Eric S, Amberli Y , Jessica S, Tiffany Y, Shabbir H.2015. Comparative Life Cycle Assessment of a Thai Island's diesel/PV/wind hybrid. Renewable Energy 80, 85-100
Carlo S, Adriana D, Paola C, Michela G, Emma B, Paola G.2015. Life Cycle Assessment and Life Cycle Costing of a SOFC system for distributed power generation Energy Conversion and Management 100, 64–77
Carrera D, Mack A. 2012.Sustainability assessment of energy technologies via social indicators: result of a survey among European energy experts. Energy Policy; 38:1030–9.
Chao F, Xuenong G, Yuting T, Yuansheng Z. 2014. Comparative life cycle environmental assessment of flue gas desulphurization technologies in China. Journal of Cleaner Production 68, 81-92
Cristina I, Carine L, Francesco C.2016. Life-cycle assessment of a biogas power plant with application of different climate metrics and inclusion of near-term climate forcers. Journal of Environmental Management 184, 517-527.
Dalia S, Ilona A.2014. External costs of electricity generation options in Lithuania. Renewable Energy 64 , 215-224
De Feo G, Forni M, Petito F, Renno C. 2016. Life cycle assessment and economic analysis of a low concentrating photovoltaic system. Environmental Technology, 37:19, 2473-2482, DOI: 10.1080/09593330.2016.1152308
Diego G, Daniel G, Javier D.2017. Prospective life cycle assessment of the Spanish electricity production. Renewable and Sustainable Energy Reviews 75, 21–34
Diego G, Diego I, Daniel G.2017. Prospective analysis of energy security: A practical life-cycle approach focused on renewable power generation and oriented towards policy-makers Applied Energy 190, 891–901
Diego G, Diego I, Mario M, Javier D, Kari E, Arne L.2016. Integration of life-cycle indicators into energy
optimisation models: the case study of power generation in Norway. Journal of Cleaner Production 112, 2693-2696
Diego G., Kari, E., Arne. L., Martin, K. 2016. The role of the discount rates in energy systems optimisation models. Renewable and Sustainable Energy Review, 59, 56-72. Available from www.sciencedirect.com
Diogo A, Ivete D, Mary L, Aldo R.2014. Life cycle assessment of the sugarcane bagasse electricity generation in Brazil. Renewable and Sustainable Energy Reviews 32, 532–547
Edgar R, Arturo M.2014. Optimizing the energy portfolio of the Mexican electricity sector by 2050 considering CO2eq emissions and Life Cycle Assessment. Energy Procedia 57, 850 – 859
Eduard C, Nicholas F., Sarah J., and Joule B. 2015. Sustainability of Rooftop Technologies in Cold Climates Comparative Life Cycle Assessment of White Roofs, Green Roofs, and Photovoltaic Panels, Journal of Industrial Ecology, DOI: 10.1111/jiec.12269
Eduard O, Antoni G, Alvaro d, Dieter B, Luisa F.2012. Comparative life cycle assessment of thermal energy storage systems for solar power plants. Renewable Energy 44, 166-173
Elvira B, Laura V, Alberto C, Sergio U.2015. Integrating life cycle assessment and emergy synthesis for the evaluation of a dry steam geothermal power plant in Italy Energy 86, 476-487
Elvira B, Pier P, Sergio U.2012. Assessing the environmental performance and sustainability of bioenergy production in Sweden: A life cycle assessment perspective. Energy 37, 69-78
Ernesto L, Elena R, Henri S, Osvaldo R, Steven De M, Dewulf J. 2016. A comparative assessment of anaerobic digestion power plants as alternative to lagoons for vinasse treatment: life cycle assessment and exergy analysis. Journal of Cleaner Production 113, 459-471.
Fatemeh D, Majid S, Khosro A.2017. A well to wire LCA model development and sensitivity analysis for carbon footprint of combined cycle power plants in Iranian electricity network, International Journal of Green Energy, 14:5, 499-508, DOI: 10.1080/15435075.2017.1279618
Felix M; Gheewala S.2012. Environmental assessment of electricity production in Tanzania. Energy for Sustainable Development, 16, 439–447.
Francisca F, Carlos P, Mercedes R.2016. Life cycle assessment of biodiesel in Spain: Comparing the environmental sustainability of Spanish production versus Argentinean imports. Energy for Sustainable Development 33, 36–52
Fthenakis V, Kim HC. 2007. Greenhouse-gas emissions from solar electric- and nuclear power: a life-cycle study. Energy Policy; 35:2549–57