Assessing the Relation Between Plasma PCB concentrations and Elevated Autistic Behaviours using Bayesian Predictive Odds Ratios
Authors:
Brendan A. Bernardoa, Bruce P. Lanpheara, Scott A. Vennersa, Tye E. Arbuckleb, Joseph M. Braunc, Gina Muckled, William D. Frasere, Lawrence C. McCandlessa.
Affiliations:
aFaculty of Health Sciences, Simon Fraser University
bPopulation Studies Division, Environmental Health Science and Research Bureau, Healthy Environments and Consumer Safety Branch, Health Canada
cDepartment of Epidemiology, Brown University dÉcole de psychologie, Université Laval
eDepartment d’obstétrique et gynécologie, Université de Sherbrooke
Corresponding author:
Lawrence C McCandless, Faculty of Health Sciences, Simon Fraser University, 8888 University Drive, Burnaby, BC V5A 1S6, Canada; [email protected]
Keywords:
Autism; polychlorinated biphenyls; environmental chemicals; children; neurodevelopment
Disclosure:
JMB was financially compensated for serving as an expert witness for plaintiffs in litigation related to tobacco smoke exposures.
Abstract
Autism spectrum disorder (ASD) is a neurodevelopmental condition characterized by impaired social communication and repetitive or stereotypic behaviours. In utero exposure to
INTRODUCTION
Autism spectrum disorder (ASD) is a neurodevelopmental condition affecting 1-2% of children that is characterized by impaired social communication and repetitive or stereotypic behaviours that manifest during early childhood [1]. It has been suggested that maternal exposure to some environmental chemicals during fetal development may play a role in the etiology of ASD [2–8]. The first and third trimesters of pregnancy have been identified as important developmental windows for chemical exposure [9]. One such class of chemicals is the polychlorinated
biphenyls (PCBs), which have well-established neurotoxic properties [10]. PCBs are persistent organic pollutants that were widely used in coolant fluids for different heating and electrical systems and industrial applications [11]. In Canada, action on PCBs has been taken since the late 1970s [12]. Globally, the Stockholm Convention on Persistent Organic Pollutants and PCBs came into force in 2004 [13]. Still, PCBs continue to persist in the environment [11]. Many studies have found that PCBs can affect several mechanisms thought to be involved in the etiology of ASD, including immune response and functions, neuronal development,
neuroexcitability, oxidative stress, and steroid hormones [8,14–17].
The impact of prenatal PCB exposure on neurodevelopment in children has been studied extensively [16,18–22]. However, only a few studies have examined PCBs in relation to ASD, and the effects of low-level PCB exposure are uncertain. Braun et al. [22] reported modest, but imprecise differences in autistic behaviours associated with gestational exposure to several endocrine disrupting chemicals, including some PCBs. A small case-control study by Cheslack-Postava et al. [20] reported weak associations between in utero PCB exposure and ASD. More recently, in a large population-based case-control study, Lyall et al. [21] reported that several PCB congeners were associated with increased ASD risk in children. Overall, the effects of low-level PCB exposure on ASD and autistic behaviour remain unclear.
The purpose of this study was to examine the relation between plasma PCB concentrations measured during the first trimester of pregnancy and elevated autistic behaviour in 3- to 4-year-old children using the social responsiveness scale (SRS). We used Bayesian statistics to analyze data from 546 mother and child pairs who completed the child follow-up and
METHODS
Maternal-Infant Research on Environmental Chemicals (MIREC) Study
We used data from the MIREC study, a prospective pregnancy and birth cohort study from ten Canadian cities between 2008 and 2011. The goal of the MIREC Study was to obtain national biomonitoring data on pregnant women and their infants to examine the effects of prenatal exposure to environmental chemicals on pregnancy and child health outcomes [23]. Study criteria and further details about participant eligibility and exclusions are discussed in the cohort profile by Arbuckle et al. [23]. For this study, we employed the subsample of participants in the MIREC follow-up neurodevelopment study when the children were 3 to 4 years old (average: 3.4 years). We included mothers who had socio-demographic and child neurodevelopment information, as well as plasma PCB concentrations and total lipid concentrations measured during the first trimester of the pregnancy. A total of 546 met all the above criteria for inclusion in our analysis (Table 1). This research was approved by ethics review boards from Health
Canada, Sainte-Justine Research Center, and Simon Fraser University. All women provided informed consent for their and their child’s participation in the study.
Biomarkers of PCB Exposure
We measured concentrations of 24 congeners in plasma samples collected during the first trimester of the pregnancy, at an average of 12.0 weeks gestation (range: 6.0-14.0 weeks). Biomarker analysis occurred at the Toxicology Laboratory of the Institut national de santé publique du Québec, and all samples were stored at -20°C [24]. We quantified PCB congener concentrations (International Union for Pure and Applied Chemistry no. 28, 52, 66, 74, 99, 101, 105, 118, 128, 138, 146, 153, 156, 163, 167, 170, 178, 180, 183, 187, 194, 201, 203, 206) using gas chromatography/mass spectrometry at the Toxicology Laboratory of the Institut national de santé publique du Québec, and all samples were stored at -20°C [24]. We retained PCB
units of ng/g lipids [26,27]. Additionally, we conducted further sensitivity analyses related to LOD and plasma lipid dilution, which are detailed below.
Social Responsiveness Scale Score
The Social Responsiveness Scale-2 (SRS-2) was the dependent variable in our analysis, a valid and reliable caregiver-reported questionnaire that provides a quantitative measure of autistic behaviour and, at higher scores, differentiates autism from other disorders [28]. The SRS score has been cross-validated in a large European sample of clinical ASD cases [29], and it has been compared with the Diagnostic and Statistical Manual of Mental Disorders (DSM) [30]. The SRS consists of a series of 65 questions on a Likert Scale that measure a child’s behavioural characteristics during the previous 6 months. The sum of the questions gives a total T-score, where higher scores describe greater deficiencies in reciprocal social behaviour (i.e.
interpersonal, repetitive, or stereotypic behaviours) that are more likely to indicate clinically diagnosed autism spectrum disorder [29,31,32]. SRS score cut-offs have been defined to denote the range of autistic behaviours. Scores from 60 to 65 are categorized as ‘Mild’, 66 to 75 as ‘Moderate’, and above 75 as ‘Severe’. The SRS has two DSM-V subscales for ASD and five treatment subscales (social awareness, social cognition, social communication, social
motivation, and restricted interests and repetitive behaviour), which measure receptive, cognitive, expressive and motivational aspects of social behaviour as well as autistic preoccupations.
Covariates
We included variables that may potentially confound the relationship between plasma PCB concentrations and autistic behaviours. We created a Directed Acyclic Graph (DAG) (Supplementary Figure 1) to identify factors that are common causes of PCB exposure and autistic behaviour [33]. Our final set of covariates included: child sex, mother’s age in years, maternal race, maternal education, annual income, marital status, ever smoked/consumed alcohol during pregnancy, and pre-pregnancy BMI. We used the same set of covariates in all analyses.
We used Bayesian linear regression to estimate the confounder-adjusted associations between mother plasma PCB concentrations and child mean SRS scores. Each PCB concentration was included in a single-pollutant model using indicator variables to create four sub-groups,
separated into quartiles at the 25th, 50th and 75th percentiles, along with measured covariates. Comparisons based on PCB quartiles are easier to interpret than incremental plasma PCB concentrations changes. We did not adjust for co-pollutant confounding from multiple PCBs. An autoregressive prior on the regression coefficients was used to smooth the dose-response relationship. We used Markov Chain Monte Carlo (MCMC) with the software Stan [34] to generate a sample from the posterior distribution [35]. Further details are given in the Supplementary Materials.
For comparisons with odds ratios for ASD observed in other studies, we examined SRS scores as both a continuous and a binary outcome using Bayesian analysis (Lyall [21] and Cheslack-Postava [20]). Bayesian statistics is an approach to statistics where uncertainty about the results is represented using probability distributions on model parameters. One advantage of Bayesian methods is that we can calculate the probability of any model parameter output (e.g. the probability that SRS >60). We calculated Bayesian predictive odds ratios (BPORs) for more autistic behavior using SRS scores >60 and calculated from Equation (1) in the Supplementary Material with logistic errors. We obtained 95% posterior credible intervals (PCIs), which are the Bayesian equivalent of frequentist confidence intervals (CIs). The abbreviation CI is specific to frequentist confidence intervals. The parameters are interpreted as random variables and the boundaries indicate a 95% probability range for the unknown quantity. The BPOR approach gives much narrower 95% interval estimates for the OR of ASD compared to logistic regression directly on the dichotomized SRS score because it uses the underlying linear model for SRS to predict the probability that SRS >60. Additionally, we used the MCMC samples to calculate the posterior probability that the odds ratios were greater than 1.0.
We conducted additional multiple linear regression analyses to estimate differences in
Sensitivity Analyses
Because some PCBs were detected in fewer than 50% of participants, we conducted a sensitivity analysis that repeated the regression analyses using the single imputation “fill-in” approach where the logarithm PCB concentrations <LOD were randomly sampled from a truncated lognormal distribution with mean and standard deviation estimated from the data [39]. Additionally, building on the work of O’Brien et al. [24], we conducted a sensitivity analysis to compare results when plasma lipid concentrations were included as a covariate in our regression models for SRS.
RESULTS
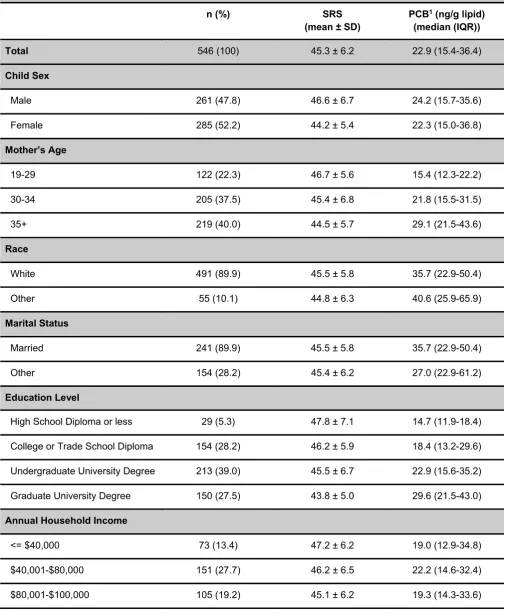
The women were generally ≥30 years of age (77.5%) with a post-secondary degree (94.7%), and had an annual household income ≥ $80,000 (59.0%) (Table 1). Eight (6 boys and 2 girls) out of 546 children in the MIREC sample (1.5%) had SRS scores >60. Characteristics that were predictive of lower SRS scores included: higher maternal age, higher education, an annual income ≥ $100,000, and having a female child.
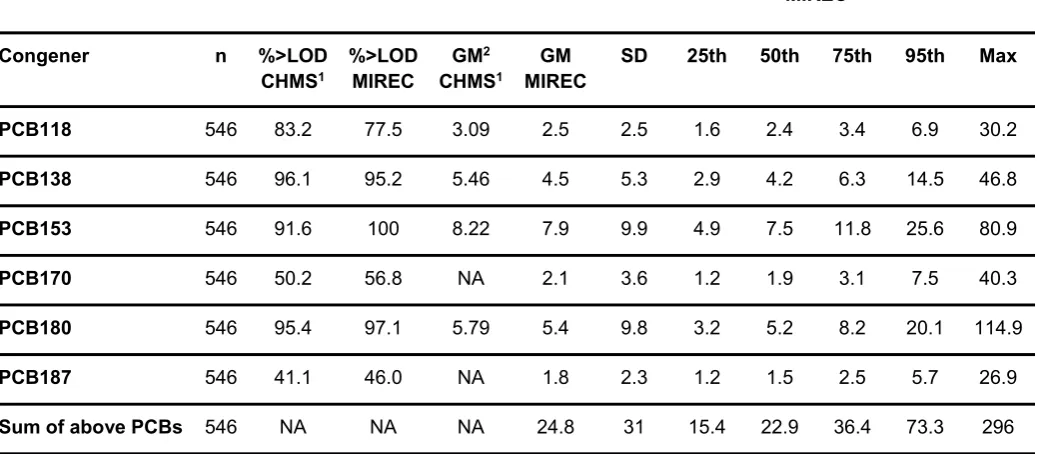
Six (118, 138, 153, 170, 180, 187) of 24 PCB congeners were detected in >40% of participants; PCB153, which was the most prevalent, was detected in 100% of participants (Table 2).
Geometric mean concentrations (ng/g lipid) among the 6 PCBs were as high as 7.9 (range: 1.7-80.9) for PCB153 and as low as 1.8 (range: 0.5-26.9) for PCB187. The geometric means of PCBs for pregnant women in MIREC were generally lower than the Canadian women of childbearing age (20-39 years) from Canadian Health Measures Survey (CHMS) [40,41]. PCB153 had the highest geometric mean for MIREC and CMHS, at 7.9 and 8.2 ng/g lipids, respectively.
The Cronbach’s alpha for all SRS scores (i.e. total SRS, two DSM-V subscales and five
versus married mothers, respectively.
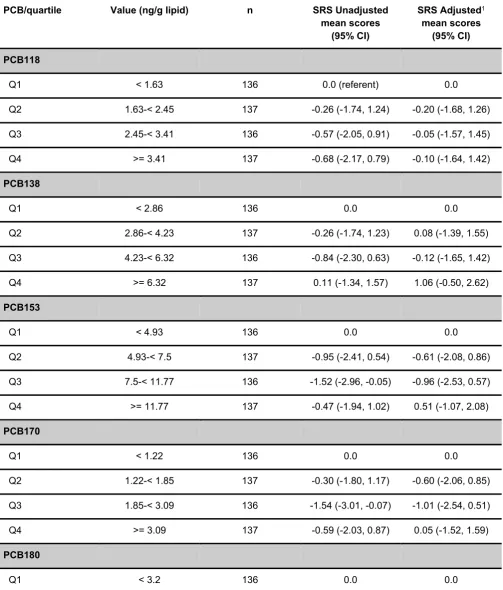
Higher plasma PCB concentrations were associated with subtle non-monotonic differences in continuous SRS scores, meaning that we saw a change in direction of the response between the quartiles of ng/g lipid PCB concentrations (Table 3). PCBs 138, 153, 170, 187, and the sum of the 6 PCBs were associated with weak and imprecise increases in the mean SRS when comparing the fourth quartile with the first quartile. For instance, mean SRS scores were 1.1-points [95%PCI: -0.5, 2.6] higher among children born to women in the 4th PCB138 quartile
compared to children born to women in the 1st quartile. In a Bayesian analysis, the word
imprecise means a large posterior standard deviation for the parameter. In other settings, comparisons of the 2nd or 3rd PCB quartile to the lowest quartile were associated with reductions in the mean SRS score (e.g. PCB153 in Table 3).
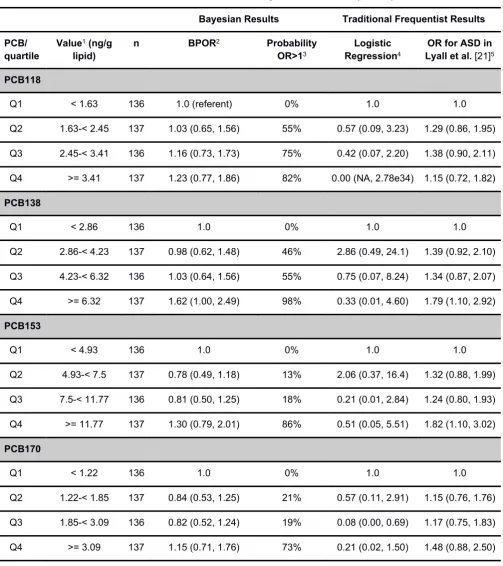
For all six PCBs, we observed small increases in the odds ratio of SRS >60 in the fourth quartile compared to the first quartile, although the resulting 95% interval estimates were very imprecise (large posterior standard deviation). For instance, PCB138 exhibited a modest odds ratio in the fourth quartile compared to the first quartile, with an odds ratio of 1.6 [95%PCI: 1.0, 2.5]. To recognize the importance of the BPORs and PCIs, we also report the posterior probabilities that the OR is greater than 1.0 (Table 4). This tells the reader that if the model is correct, then for PCB138, there is an estimated 98% probability that the odds ratio (fourth quartile versus first quartile) is greater than 1, emphasizing the value of the BPOR approach and narrower 95% interval estimates.
We conducted additional analyses to estimate differences in subscales of the SRS score (Supplementary Tables 2-6) and a sex stratified analysis for males (n=261) and females (n=285) (Supplementary Tables 7-8). However the width of the 95% CIs for model parameters were wider, and this makes the interpretation of results more challenging. Changes in PCB concentrations were associated with small increases or decreases in the SRS subscales. In some cases, we saw the same patterns with the Bayesian models for the total SRS score (Supplementary Tables 2-6). For instance, the Social Communication subscale had a mean increase of 1.3 [95%CI: -0.3, 2.9] for PCB138, compared to the first quartile. In the sex stratified analysis for PCB138, we saw an overall increase in the mean SRS score, with increases of 0.3 [95%PCI: -2.3, 2.9] for boys and 0.8 [95%PCI: -1.2, 2.7] for girls (Supplementary Tables 7-8).
In sensitivity analyses, we found that using a single imputation “fill-in” value for PCB<LOD, rather than LOD/sqrt(2) did not meaningfully change the results (Supplementary Table 9). This is unsurprising because PCB exposure was categorized into quartiles. Further sensitivity analyses showed that including plasma lipid concentrations as a covariate did not have an impact on our results (data not shown). For instance, linear regression models showed similar increases in the mean SRS when comparing the fourth quartile with the first quartile for PCB138, with a mean SRS score increase of 0.5 [95%CI: -1.1, 2.0] without the lipid covariate (but PCB adjusted for lipids) versus 0.5 [95%CI: -1.1, 2.1] with lipids as a covariate and adjusted for lipids.
DISCUSSION
though only 8 out of 546 children in the MIREC sample (1.5%) had scores for SRS >60. The reason is because BPORs leverage the underlying linear regression model for SRS from
equation (1) (see Supplementary Methods) to enable more accurate Bayesian predictions of the odds ratio compared to logistic regression directly on the dichotomized SRS score data.
We found that small changes in the mean SRS score translated to observably larger changes in the odds of autistic behaviour based on an SRS threshold of 60. For example, for PCB138 an average increase of 1.1 [95%PCI: -0.5, 2.6] in the mean SRS for (Q4 versus Q1) translates to an odds ratio of 1.6 [95%PCI: 1.0, 2.5]. Furthermore, an important property of the logistic error model given in Equation (1) (see Supplementary Methods) is that BPOR is invariant to the choice of threshold used to define ASD [42]. In other words, it can be shown that using a threshold of 60, 75, or any other value will give the same odds ratio for more autistic behavior. These findings have important implications in the study of autistic behavior using the SRS score because seemingly small effect sizes can translate to larger effect sizes on the multiplicative risk scale. This phenomenon has been demonstrated in previous studies looking at the impact of toxicants on children, as depicted by Lanphear et al. in how “Little things matter” [43–46].
This study builds on the existing literature examining in utero PCB exposure and autistic
behaviours [16,18–22]. Cheslack-Postava et al. [20] found some evidence that higher total PCB levels were associated with high frequency of ASD, whereas Braun et al. [22] found evidence that several PCBs (e.g. PCB138) were associated with more autistic behaviours. The larger case-control study of Lyall et al. [21] presented clearer evidence of monotonic dose-response relationships between PCBs (e.g. PCB 138 and 153) and risk of ASD in offspring. More generally, there is a evidence from human and animal studies that that some PCB congeners are associated with neurotoxic endpoints even at low doses [47,48].
This is one of only a few studies to examine in utero PCB exposures and autistic behaviour in a prospective cohort of pregnant women. PCBs have long half-lives and PCB levels in plasma are fairly stable over time; hence, we can rely on accurate and rigorous measurements of PCB exposure [9,49]. Additionally, our study is the first of its kind to estimate predictive odds ratios using Bayesian methods rather than using logistic regression applied directly to the
implement other novel and innovative approaches with their data [50].
The study has some limitations. Although our linear model for SRS given in Equation (1) of the Supplementary Material accounts for non-linear dose-response using PCB quartiles, it is overly simplistic and does not account for co-pollutant confounding or interaction between PCB congeners. The analysis ignores the effect of combined exposure to multiple PCBs on autistic behaviour. The lack of association observed with the sum of the 6 PCB congeners suggests that calculating the sum is not satisfactory to characterize the combined effect of multiple PCBs. Individual congeners or the sum of PCBs with similar chemical properties may play a larger role in associations with autistic behaviour or other neurodevelopmental disorders [21].
Another limitation of our analysis is that SRS scores are not a perfect quantitative measure of autistic traits. Our BPOR analysis defines elevated autistic behavior using an established threshold of >60, which indicates mild, moderate or severe autistic behavior [29], rather than clinical information. The SRS is not a diagnostic test for ASD; it also measures other aspects of social behaviours that tend to co-occur with other behavioural disorders such as attention deficit hyperactivity disorder or language disorders [29,51,52]. Furthermore, SRS may have low specificity for ASD, because of traits related to social motivation and ADHD [51–53].
In conclusion, we found no association between plasma PCB concentrations and autistic
behavior. However, we found some evidence that plasma PCB concentrations during pregnancy may be associated with small increases in autistic behaviours in children, as measured by SRS scores. Our findings demonstrate the value of measuring associations between PCBs and autistic behaviour on both continuous and binary scales using Bayesian statistics. Further research is needed to examine the effects of chemical mixtures and combined exposure to multiple PCBs to improve our understanding of the effects of multiple correlated exposures.
DECLARATIONS
Ethics Approval and Consent to Participate:
Competing Interests:
None declared. Funding:
This projected was funded by a Discovery Grant from the Natural Sciences and Engineering Research Council of Canada (RGPIN-2015-05155), a Catalyst Grant from the Canadian
Institutes for Health Research (L-CIP-150736), and a Research Project Grant from the National Institute of Environmental Health Sciences (R01 ES024381).
Author’s Contributions:
BB and LM designed the study with input from SV, BL, JB, TA. BB conducted the analysis and wrote the bulk of the content with LM. BL, GM, TA and WF provided the data. SV, BL, JB, TA and WF assisted with editing and revising the manuscript.
Acknowledgements:
We are grateful to all the participants who took part in the MIREC Study, as well as to all study staff.
REFERENCES
1. Autism and Developmental Disabilities Monitoring Network Surveillance Year 2008 Principal Investigators, Centers for Disease Control and Prevention. Prevalence of autism spectrum disorders--Autism and Developmental Disabilities Monitoring Network, 14 sites, United States, 2008. MMWR Surveill Summ. 2012;61: 1–19.
2. Kalkbrenner AE, Schmidt RJ, Penlesky AC. Environmental Chemical Exposures and Autism Spectrum Disorders: A Review of the Epidemiological Evidence. Curr Probl Pediatr Adolesc Health Care. Elsevier; 2014;44: 277–318.
3. Lyall K, Schmidt RJ, Hertz-Picciotto I. Maternal lifestyle and environmental risk factors for autism spectrum disorders. Int J Epidemiol. 2014;43: 443–464.
5. Herbert MR. Contributions of the environment and environmentally vulnerable physiology to autism spectrum disorders. Curr Opin Neurol. 2010;23: 103–110.
6. de Cock M, Maas YGH, van de Bor M. Does perinatal exposure to endocrine disruptors induce autism spectrum and attention deficit hyperactivity disorders? Review. Acta Paediatr. 2012;101: 811–818.
7. Elsabbagh M, Divan G, Koh Y-J, Kim YS, Kauchali S, Marcín C, et al. Global prevalence of autism and other pervasive developmental disorders. Autism Res. 2012;5: 160–179. 8. Lyall K, Croen L, Daniels J, Fallin MD, Ladd-Acosta C, Lee BK, et al. The Changing
Epidemiology of Autism Spectrum Disorders. Annu Rev Public Health. 2017;38: 81–102. 9. Adetona O, Horton K, Sjodin A, Jones R, Hall DB, Aguillar-Villalobos M, et al.
Concentrations of select persistent organic pollutants across pregnancy trimesters in maternal and in cord serum in Trujillo, Peru. Chemosphere. 2013;91: 1426–1433.
10. Roelens SA, Beck V, Aerts G, Clerens S, Vanden Bergh G, Arckens L, et al. Neurotoxicity of polychlorinated biphenyls (PCBs) by disturbance of thyroid hormone-regulated genes. Ann N Y Acad Sci. 2005;1040: 454–456.
11. Breivik K, Alcock R, Li Y-F, Bailey RE, Fiedler H, Pacyna JM. Primary sources of selected POPs: regional and global scale emission inventories. Environ Pollut. 2004;128: 3–16. 12. Polychlorinated Biphenyls (PCBs). Available:
https://www.canada.ca/en/health- canada/services/chemical-substances/fact-sheets/chemicals-glance/polychlorinated-biphenyls.html (Accessed on September 19, 2018)
13. Warmuth A OK. The PCBs elimination network: the information exchange platform created for the risk reduction of polychlorinated biphenyls (PCBs). Available:
http://chm.pops.int/Implementation/IndustrialPOPs/PCBs/PCBEliminationNetwork/PENOver view/Relatedarticlesandlinks/PCBsInfoexchangeplatform/tabid/3016/Default.aspx
14. Nowack N, Wittsiepe J, Kasper-Sonnenberg M, Wilhelm M, Schölmerich A. Influence of Low-Level Prenatal Exposure to PCDD/Fs and PCBs on Empathizing, Systemizing and Autistic Traits: Results from the Duisburg Birth Cohort Study. PLoS One. 2015;10: e0129906.
15. Ashwood P, Schauer J, Pessah IN, Van de Water J. Preliminary evidence of the in vitro effects of BDE-47 on innate immune responses in children with autism spectrum disorders. J Neuroimmunol. Elsevier; 2009;208: 130–135.
16. Kimura-Kuroda J, Nagata I, Kuroda Y. Disrupting effects of hydroxy-polychlorinated
biphenyl (PCB) congeners on neuronal development of cerebellar Purkinje cells: a possible causal factor for developmental brain disorders? Chemosphere. Elsevier; 2007;67: S412– 20.
17. Shelton JF, Hertz-Picciotto I, Pessah IN. Tipping the balance of autism risk: potential mechanisms linking pesticides and autism. Environ Health Perspect. 2012;120: 944–951. 18. Jacobson JL, Jacobson SW. Intellectual impairment in children exposed to polychlorinated
19. Rossignol DA, Genuis SJ, Frye RE. Environmental toxicants and autism spectrum disorders: a systematic review. Transl Psychiatry. 2014;4: e360.
20. Cheslack-Postava K, Rantakokko PV, Hinkka-Yli-Salomäki S, Surcel H-M, McKeague IW, Kiviranta HA, et al. Maternal serum persistent organic pollutants in the Finnish Prenatal Study of Autism: A pilot study. Neurotoxicol Teratol. 2013;38: 1–5.
21. Lyall K, Croen LA, Sjödin A, Yoshida CK, Zerbo O, Kharrazi M, et al. Polychlorinated Biphenyl and Organochlorine Pesticide Concentrations in Maternal Mid-Pregnancy Serum Samples: Association with Autism Spectrum Disorder and Intellectual Disability. Environ Health Perspect. 2017;125: 474–480.
22. Braun JM, Muckle G, Arbuckle T, Bouchard MF, Fraser WD, Ouellet E, et al. Associations of Prenatal Urinary Bisphenol A Concentrations with Child Behaviors and Cognitive Abilities. Environ Health Perspect. 2017;125: 067008.
23. Arbuckle TE, Fraser WD, Fisher M, Davis K, Liang CL, Lupien N, et al. Cohort profile: the maternal-infant research on environmental chemicals research platform. Paediatr Perinat Epidemiol. 2013;27: 415–425.
24. Fisher M, Arbuckle TE, Liang CL, LeBlanc A, Gaudreau E, Foster WG, et al. Concentrations of persistent organic pollutants in maternal and cord blood from the maternal-infant research on environmental chemicals (MIREC) cohort study. Environ Health. 2016;15: 59.
25. Axelrad DA, Goodman S, Woodruff TJ. PCB body burdens in US women of childbearing age 2001-2002: An evaluation of alternate summary metrics of NHANES data. Environ Res. 2009;109: 368–378.
26. O’Brien KM, Upson K, Cook NR, Weinberg CR. Environmental Chemicals in Urine and Blood: Improving Methods for Creatinine and Lipid Adjustment. Environ Health Perspect. 2016;124: 220–227.
27. Schisterman EF, Whitcomb BW, Louis GMB, Louis TA. Lipid adjustment in the analysis of environmental contaminants and human health risks. Environ Health Perspect. 2005;113: 853–857.
28. (SRSTM-2) Social Responsiveness ScaleTM, Second Edition | WPS [Internet]. [cited 30 Jan 2018]. Available: https://www.wpspublish.com/store/p/2994/srs-2-social-responsiveness-scale-second-edition
29. Bolte S, Poustka F, Constantino JN. Assessing Autistic Traits: Cross-Cultural Validation of the Social Responsiveness Scale (SRS). Autism Res. 2008;1: 354–363.
30. Cheon K-A, Park J-I, Koh Y-J, Song J, Hong H-J, Kim Y-K, et al. The social responsiveness scale in relation to DSM IV and DSM5 ASD in Korean children. Autism Res. 2016;9: 970– 980.
31. Frazier TW, Youngstrom EA, Hardan AY, Georgiades S, Constantino JN, Eng C. Quantitative autism symptom patterns recapitulate differential mechanisms of genetic transmission in single and multiple incidence families. Mol Autism. 2015;6: 58.
the general population. Biol Psychiatry. 2005;57: 655–660.
33. Hernán MA, Hernández-Díaz S, Werler MM, Mitchell AA. Causal knowledge as a
prerequisite for confounding evaluation: an application to birth defects epidemiology. Am J Epidemiol. 2002;155: 176–184.
34. Carpenter B, Gelman A, Hoffman M, Lee D, Goodrich B, Betancourt M, et al. Stan: A Probabilistic Programming Language. Journal of Statistical Software, Articles. 2017;76: 1– 32.
35. Dunson DB. Commentary: practical advantages of Bayesian analysis of epidemiologic data. Am J Epidemiol. 2001;153: 1222–1226.
36. Brock M, Hatton D. Distinguishing features of autism in boys with fragile X syndrome. J Intellect Disabil Res. 2010;54: 894–905.
37. Solomon M, Miller M, Taylor SL, Hinshaw SP, Carter CS. Autism symptoms and
internalizing psychopathology in girls and boys with autism spectrum disorders. J Autism Dev Disord. 2012;42: 48–59.
38. Hartley SL, Sikora DM. Sex differences in autism spectrum disorder: an examination of developmental functioning, autistic symptoms, and coexisting behavior problems in toddlers. J Autism Dev Disord. 2009;39: 1715–1722.
39. Lubin JH, Colt JS, Camann D, Davis S, Cerhan JR, Severson RK, et al. Epidemiologic evaluation of measurement data in the presence of detection limits. Environ Health Perspect. ncbi.nlm.nih.gov; 2004;112: 1691–1696.
40. Haines DA, Saravanabhavan G, Werry K, Khoury C. An overview of human biomonitoring of environmental chemicals in the Canadian Health Measures Survey: 2007–2019. Int J Hyg Environ Health. 2017;220: 13–28.
41. Report on Human Biomonitoring of Environmental Chemicals in Canada: Results of the Canadian Health Measures Survey Cycle 1 (2007-2009) Ottawa: Health Canada. Health Canada. 2010; Available: https://www.canada.ca/content/dam/hc-sc/migration/hc-sc/ewh-semt/alt_formats/hecs-sesc/pdf/pubs/contaminants/chms-ecms/report-rapport-eng.pdf 42. Albert JH, Chib S. Bayesian Analysis of Binary and Polychotomous Response Data. J Am
Stat Assoc. [American Statistical Association, Taylor & Francis, Ltd.]; 1993;88: 669–679. 43. Canadian Environmental Health Atlas. Little Things Matter: The Impact of Toxins on the
Developing Brain [Internet]. Youtube; 2014. Available: https://www.youtube.com/watch?v=E6KoMAbz1Bw
44. Needleman HL, Bellinger D. The health effects of low level exposure to lead. Annu Rev Public Health. annualreviews.org; 1991;12: 111–140.
45. Needleman HL, Bellinger D. Prenatal exposure to toxicants. Johns Hopkins Univ. Press, Baltimore; 1994.
47. Korrick SA, Sagiv SK. Polychlorinated biphenyls, organochlorine pesticides and neurodevelopment. Curr Opin Pediatr. 2008;20: 198–204.
48. Longnecker MP, Wolff MS, Gladen BC, Brock JW, Grandjean P, Jacobson JL, et al. Comparison of Polychlorinated Biphenyl Levels across Studies of Human
Neurodevelopment. Environ Health Perspect. 2002;111: 65–70.
49. Batterman SA, Chernyak S, Su F-C. Measurement and Comparison of Organic Compound Concentrations in Plasma, Whole Blood, and Dried Blood Spot Samples. Front Genet. 2016;7: 64.
50. Marrero O. What is Bayesian statistics? The Mathematical Gazette. Cambridge University Press; 2016;100: 247–256.
51. Hus V, Bishop S, Gotham K, Huerta M, Lord C. Factors influencing scores on the social responsiveness scale. J Child Psychol Psychiatry. 2013;54: 216–224.
52. Reiersen AM, Constantino JN, Volk HE, Todd RD. Autistic traits in a population-based ADHD twin sample. J Child Psychol Psychiatry. 2007;48: 464–472.
53. Jones EJH, Venema K, Earl RK, Lowy R, Webb SJ. Infant social attention: an
Table 1. Sociodemographic characteristics of MIREC study participants, Canada, 2008-2011 (n=546).
n (%) SRS
(mean ± SD)
PCB1 (ng/g lipid) (median (IQR))
Total 546 (100) 45.3 ± 6.2 22.9 (15.4-36.4)
Child Sex
Male 261 (47.8) 46.6 ± 6.7 24.2 (15.7-35.6)
Female 285 (52.2) 44.2 ± 5.4 22.3 (15.0-36.8)
Mother’s Age
19-29 122 (22.3) 46.7 ± 5.6 15.4 (12.3-22.2)
30-34 205 (37.5) 45.4 ± 6.8 21.8 (15.5-31.5)
35+ 219 (40.0) 44.5 ± 5.7 29.1 (21.5-43.6)
Race
White 491 (89.9) 45.5 ± 5.8 35.7 (22.9-50.4)
Other 55 (10.1) 44.8 ± 6.3 40.6 (25.9-65.9)
Marital Status
Married 241 (89.9) 45.5 ± 5.8 35.7 (22.9-50.4)
Other 154 (28.2) 45.4 ± 6.2 27.0 (22.9-61.2)
Education Level
High School Diploma or less 29 (5.3) 47.8 ± 7.1 14.7 (11.9-18.4)
College or Trade School Diploma 154 (28.2) 46.2 ± 5.9 18.4 (13.2-29.6)
Undergraduate University Degree 213 (39.0) 45.5 ± 6.7 22.9 (15.6-35.2)
Graduate University Degree 150 (27.5) 43.8 ± 5.0 29.6 (21.5-43.0)
Annual Household Income
<= $40,000 73 (13.4) 47.2 ± 6.2 19.0 (12.9-34.8)
$40,001-$80,000 151 (27.7) 46.2 ± 6.5 22.2 (14.6-32.4)
> $100,000 217 (39.7) 44.2 ± 5.7 26.3 (18.1-39.2)
Has Ever Smoked During Pregnancy
Yes 189 (34.6) 45.6 ± 6.5 24.4 (16.1-38.4)
No 357 (65.4) 45.2 ± 6.0 22.7 (15.1-34.8)
Has Ever Consumed Alcohol During Pregnancy
Yes 91 (16.7) 44.7 ± 6.0 23.4 (17.8-38.7)
No 455 (83.3) 45.4 ± 6.2 22.8 (15.0-36.0)
Pre-Pregnancy BMI
Underweight 14 (2.6) 45.2 ± 4.9 34.7 (14.4-53.7)
Normal 332 (60.8) 45.4 ± 6.5 24.8 (17.0-38.1)
Overweight 112 (20.5) 44.7 ± 5.4 22.9 (14.2-35.5)
Obese 88 (16.1) 45.9 ± 6.1 15.8 (12.8-24.6)
Table 2. Distributions of Blood Plasma PCBs (ng/g lipid) during the first trimester for MIREC study participants, Canada, 2008-2011 (n=546).
MIREC
Congener n %>LOD
CHMS1
%>LOD MIREC
GM2 CHMS1
GM MIREC
SD 25th 50th 75th 95th Max
PCB118 546 83.2 77.5 3.09 2.5 2.5 1.6 2.4 3.4 6.9 30.2
PCB138 546 96.1 95.2 5.46 4.5 5.3 2.9 4.2 6.3 14.5 46.8
PCB153 546 91.6 100 8.22 7.9 9.9 4.9 7.5 11.8 25.6 80.9
PCB170 546 50.2 56.8 NA 2.1 3.6 1.2 1.9 3.1 7.5 40.3
PCB180 546 95.4 97.1 5.79 5.4 9.8 3.2 5.2 8.2 20.1 114.9
PCB187 546 41.1 46.0 NA 1.8 2.3 1.2 1.5 2.5 5.7 26.9
Sum of above PCBs 546 NA NA NA 24.8 31 15.4 22.9 36.4 73.3 296
1 Plasma concentrations (ng/g lipid) for Canadian women of childbearing age (20-39 years), Canadian Health Measures
Survey (CHMS) Cycle 1, 2007-2009 [40,41].
Table 3. Mother PCB levels (quartiles) in relation to mean child SRS score in MIREC study participants, Canada, 2008-2011 using Bayesian Autoregressive Quantile Regression (n=546).
PCB/quartile Value (ng/g lipid) n SRS Unadjusted
mean scores (95% CI)
SRS Adjusted1
mean scores (95% CI)
PCB118
Q1 < 1.63 136 0.0 (referent) 0.0
Q2 1.63-< 2.45 137 -0.26 (-1.74, 1.24) -0.20 (-1.68, 1.26)
Q3 2.45-< 3.41 136 -0.57 (-2.05, 0.91) -0.05 (-1.57, 1.45)
Q4 >= 3.41 137 -0.68 (-2.17, 0.79) -0.10 (-1.64, 1.42)
PCB138
Q1 < 2.86 136 0.0 0.0
Q2 2.86-< 4.23 137 -0.26 (-1.74, 1.23) 0.08 (-1.39, 1.55)
Q3 4.23-< 6.32 136 -0.84 (-2.30, 0.63) -0.12 (-1.65, 1.42)
Q4 >= 6.32 137 0.11 (-1.34, 1.57) 1.06 (-0.50, 2.62)
PCB153
Q1 < 4.93 136 0.0 0.0
Q2 4.93-< 7.5 137 -0.95 (-2.41, 0.54) -0.61 (-2.08, 0.86)
Q3 7.5-< 11.77 136 -1.52 (-2.96, -0.05) -0.96 (-2.53, 0.57)
Q4 >= 11.77 137 -0.47 (-1.94, 1.02) 0.51 (-1.07, 2.08)
PCB170
Q1 < 1.22 136 0.0 0.0
Q2 1.22-< 1.85 137 -0.30 (-1.80, 1.17) -0.60 (-2.06, 0.85)
Q3 1.85-< 3.09 136 -1.54 (-3.01, -0.07) -1.01 (-2.54, 0.51)
Q4 >= 3.09 137 -0.59 (-2.03, 0.87) 0.05 (-1.52, 1.59)
PCB180
Q2 3.2-< 5.15 137 -1.84 (-3.31, -0.38) -1.48 (-3.02, 0.07)
Q3 5.15-< 8.24 136 -1.92 (-3.38, -0.48) -1.26 (-2.88, 0.35)
Q4 >= 8.24 137 -0.99 (-2.45, 0.45) -0.01 (-1.67, 1.69)
PCB187
Q1 < 1.18 136 0.0 0.0
Q2 1.18-< 1.46 137 0.45 (-1.01, 1.93) -0.05 (-1.53, 1.40)
Q3 1.46-< 2.5 136 -0.48 (-1.92, 0.98) -0.46 (-1.91, 0.98)
Q4 >= 2.5 137 0.00 (-1.45, 1.46) 0.56 (-0.96, 2.08)
Sum of above PCBs
Q1 < 15.41 136 0.0 0.0
Q2 15.41-< 22.94 137 -0.45 (-1.88, 1.01) -0.15 (-1.62, 1.34)
Q3 22.94-< 36.42 136 -1.45 (-2.93, 0.05) -1.02 (-2.58, 0.56)
Q4 >= 36.42 137 -0.12 (-1.58, 1.35) 0.83 (-0.75, 2.41)
1 Adjusted for child’s sex, mother’s age, race, marital status, education level, annual income, whether the mother
Table 4. Bayesian Predictive Odds Ratios (BPORs) for the relation between mother PCB levels (quartiles) and child autistic behaviours defined by an SRS >60 threshold, in MIREC study participants, Canada, 2008-2011 (n=546).
Adjusted Odds Ratio (95% CI)
Bayesian Results Traditional Frequentist Results
PCB/ quartile
Value1 (ng/g lipid)
n BPOR2 Probability
OR>13
Logistic Regression4
OR for ASD in Lyall et al. [21]5
PCB118
Q1 < 1.63 136 1.0 (referent) 0% 1.0 1.0
Q2 1.63-< 2.45 137 1.03 (0.65, 1.56) 55% 0.57 (0.09, 3.23) 1.29 (0.86, 1.95)
Q3 2.45-< 3.41 136 1.16 (0.73, 1.73) 75% 0.42 (0.07, 2.20) 1.38 (0.90, 2.11)
Q4 >= 3.41 137 1.23 (0.77, 1.86) 82% 0.00 (NA, 2.78e34) 1.15 (0.72, 1.82)
PCB138
Q1 < 2.86 136 1.0 0% 1.0 1.0
Q2 2.86-< 4.23 137 0.98 (0.62, 1.48) 46% 2.86 (0.49, 24.1) 1.39 (0.92, 2.10)
Q3 4.23-< 6.32 136 1.03 (0.64, 1.56) 55% 0.75 (0.07, 8.24) 1.34 (0.87, 2.07)
Q4 >= 6.32 137 1.62 (1.00, 2.49) 98% 0.33 (0.01, 4.60) 1.79 (1.10, 2.92)
PCB153
Q1 < 4.93 136 1.0 0% 1.0 1.0
Q2 4.93-< 7.5 137 0.78 (0.49, 1.18) 13% 2.06 (0.37, 16.4) 1.32 (0.88, 1.99)
Q3 7.5-< 11.77 136 0.81 (0.50, 1.25) 18% 0.21 (0.01, 2.84) 1.24 (0.80, 1.93)
Q4 >= 11.77 137 1.30 (0.79, 2.01) 86% 0.51 (0.05, 5.51) 1.82 (1.10, 3.02)
PCB170
Q1 < 1.22 136 1.0 0% 1.0 1.0
Q2 1.22-< 1.85 137 0.84 (0.53, 1.25) 21% 0.57 (0.11, 2.91) 1.15 (0.76, 1.76)
Q3 1.85-< 3.09 136 0.82 (0.52, 1.24) 19% 0.08 (0.00, 0.69) 1.17 (0.75, 1.83)
PCB180
Q1 < 3.2 136 1.0 0% 1.0 1.0
Q2 3.2-< 5.15 137 0.63 (0.38, 0.97) 27% 0.85 (0.15, 5.24) 1.00 (0.66, 1.50)
Q3 5.15-< 8.24 136 0.76 (0.46, 1.19) 13% 0.10 (0.00, 1.04) 1.17 (0.75, 1.81)
Q4 >= 8.24 137 1.17 (0.68, 1.86) 73% 0.25 (0.02, 2.28) 1.49 (0.89, 2.49)
PCB187
Q1 < 1.18 136 1.0 0% 1.0 1.0
Q2 1.18-< 1.46 137 1.07 (0.67, 1.61) 62% 0.51 (0.08, 2.72) 0.89 (0.58, 1.36)
Q3 1.46-< 2.5 136 0.96 (0.61, 1.43) 43% 0.11 (0.00, 0.93) 1.22 (0.79, 1.87)
Q4 >= 2.5 137 1.39 (0.87, 2.12) 93% 0.38 (0.06, 2.30) 1.32 (0.79, 2.20)
Sum of above PCBs
Q1 < 15.41 136 1.0 0% 1.0 NA5
Q2 15.41-< 22.94 137 0.91 (0.57, 1.38) 34% 2.22 (0.40, 17.5) NA5
Q3 22.94-< 36.42 136 0.80 (0.50, 1.24) 17% 0.17 (0.01, 2.22) NA5
Q4 >= 36.42 137 1.46 (0.89, 2.30) 94% 0.46 (0.04, 4.98) NA5
1 Quartiles defined in MIREC are not the same quartiles in Lyall et al. [21], given a different distribution for PCB
exposure.
2 BPORs for autistic behaviour in MIREC using an SRS threshold of 60. Adjusted for child’s sex, mother’s age,
race, marital status, education level, annual income, whether the mother has ever smoked during pregnancy, has ever consumed alcohol during pregnancy, and pre-pregnancy bmi.
3 The probability the OR>1 was calculated using the posterior mean and posterior standard deviation.
4 Frequentist logistic regression using the dichotomized SRS data as the dependent variable (SRS >60). Adjusted
for child’s sex, mother’s age, race, marital status, education level, annual income, whether the mother has ever smoked during pregnancy, has ever consumed alcohol during pregnancy, and pre-pregnancy BMI.
5 ORs for ASD copied directly from Table 3 of Lyall et al. [21]. Lyall et al. did not report ORs for ASD based on the