A Generic Approach for Error Estimation of Depth
Data from (Stereo and RGB-D) 3D Sensors
Luis Fernandez†, Viviana Avila†and Luiz Gonçalves *
Universidade Federal do Rio Grande do Norte, Av. Salgado Filho, 3000, Lagoa Nova, 59.078-970, Natal, RN, Brazil; Emails: [email protected] (L.F.); [email protected] (V.A.)
* Correspondence: [email protected]; Tel.: +55-84-3215-3771 † These authors contributed equally to this work.
Academic Editor: name
Received: date; Accepted: date; Published: date
Abstract: We propose an approach for estimating the error in depth data provided by generic 3D sensors, which are modern devices capable of generating an image (RGB data) and a depth map (distance) or other similar 2.5D structure (e.g. stereo disparity) of the scene. Our approach starts capturing images of a checkerboard pattern devised for the method. Then proceed with the construction of a dense depth map using functions that generally comes with the device SDK (based on disparity or depth). The 2D processing of RGB data is performed next to find the checkerboard corners. Clouds of corner points are finally created (in 3D), over which an RMS error estimation is computed. We come up with a multi-platform system and its verification and evaluation has been done, using the development kit of the board nVIDIA Jetson TK1 with the MS Kinects v1/v2 and the Stereolabs ZED camera. So the main contribution is the error determination procedure that does not need any data set or benchmark, thus relying only on data acquired on-the-fly. With a simple checkerboard, our approach is able to determine the error for any device. Envisioned application is on 3D reconstruction for robotic vision, with a series of 3D vision sensors embarked in robots (UAV of type quadcopter and terrestrial robots) for high-precision map construction, which can be used for sensing and monitoring.
Keywords:accuracy; depth data; RMS error; 3D vision sensors; stereo disparity
1. Introduction
A common sort of 3D artificial vision algorithms are being developed to compute 3D visual information through the use of visual sensory data coming from 2.5 or 3D devices, such as stereo cameras and RGB-D sensors (i.e. MS Kinect). In general applications in Robotics field, these kind of devices capture data from the environment, which are processed through computer vision techniques, allowing drones or other type of artificial creatures (robots) to perceive the environment and to respond autonomously to some given perceptions. To achieve this goal, the algorithms or methods normally compute 3D models of the objects in a scene from 2D images of them and, hence, depth is estimated in some way. There are several devices that can be used nowadays to determine the depth, such as the stereo cameras (PointGrey Bumblebee [1], Stereolabs ZED [2], and Minoru 3D System [3]) and RGB-D systems (MS Kinect [4], Asus Xtion [5], and PrimeSense [6]), among others. Nevertheless, the listed devices have errors associated to the disparity and/or depth computation that are consequently arrested in the posterior calculated 3D measurements. These errors can be inherent to the design of the acquisition system or given by several sources, as illumination conditions, discrete nature of the sensors, or even by the computations performed. Specifically in the case of stereo cameras the errors can be associated to the use of lenses with high distortion, inadequate camera layout, poor resolution for image capture, lighting problems, and high re-projection calibration error. In the RGB-D devices the errors appear mainly because of the low range of the captured rate and resolution, as they are designed for entertainment and not for the development of computer vision
and robotic applications. Thus the 3D data (or 2.5 D in case of disparity only) given by the several devices are good estimations of an ideal value, in general.
Despite the limitations inherent to each type of sensor, the devices cited above are serving as the basis for many research projects in aerial robotics and computer vision, mainly because of the relative low cost and acceptable accuracy. However, a problem that we identified in the straight use of the above sensors is the lack of reliable data regarding the accuracy of the errors measurement, mainly in the stage of depth computation from data provided by them, or in its later use. This is the case of the ZED camera, for example, which we noticed in the literature that there is to date no statistic information about its depth data error. A certainly relevant information found is that it can be used up to 20 meters [2].
Thus notice that every sensing device has inherent errors that should be somehow determined (or estimated) for being treated accordingly in the further computations. Actually, depth error estimation is a relevant problem in robotics, vision, computer graphics, virtual reality, between several other fields. Different methods are proposed in the literature aiming to solve such problem, particularly, but none that can be extensive to most of the devices generally adopted in such applications.
Thus, in this work our goal is to propose a method to establish the error in the computed depth data for generic 3D sensors, anyone that is capable of generating a color image (RGB) and a depth (or disparity) map. Basically, we use a pattern in form of a checkerboard providing spatially distributed corner points that are located on, at most, three different plans. After the detection of corners using the RGB data acquired from the pattern, re-projection equations are applied and a depth map is generated using the device SDK, from which point clouds are created. This cloud goes to registration and alignment with known correspondence using singular value decomposition (SVD). Finally, the calculation of the root mean square (RMS) error in the 3D coordinates is done in a frame referenced in the pattern used, which is empirically determined by the user.
Our main contribution is the generic method devised for computing the estimated error of such 3D sensing devices. It relies on using distances between vectors (points) registered in the 3D scene instead of using raw data for this. With this, it is possible to use this approach in other devices that gives depth information or stereo disparity measures, in order to calculate the most probable errors values based on RMS. This method has shown to be general in order to be applied to several kind of existing devices. With our proposed method and with the on-line acquisition based on the checkerboard pattern as proposed here, one can estimate more precisely the errors of any such device. Applications such as aerial robotics, with small-aircraft based depth sensors, can rely on such approach in order to have a more reliable error information. Also this work constitutes an excellent tool for the testing of disparity and depth generation algorithms at the construction of 3D vision devices.
In the following sections we present the methodology necessary for implementing our proposal, then an analysis of the related works followed by the mathematics solution and multi-platform algorithm developed for the proposed method. At the end, results are analyzed, and considerations about the developed method with ideas of future works are also presented.
2. Methodology
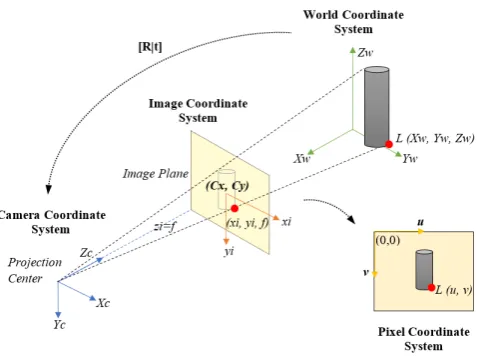
Figure 1.Pinhole Camera Model: ideal projection of a 3D object on a 2D image.
u= fXc Zc+Cx
v= fYc Zc+Cy
(1)
Xc= u−Cx f Zc
Yc= v−Cy f Zc
(2)
Distortions given by the camera lenses are given by Equations3and4.
xir =xi(1+K1r2+K2r4+K3r6)
yir =yi(1+K1r2+K2r4+K3r6)
(3)
xit=xi+ [2p1xi∗yi+p2(r2+2xi2)]
yit=yi+ [2p2xi∗yi+p1(r2+2yi2)]
(4)
Notice that both radial and tangential distortions are considered [7]. The image point(xi, yi)is the original location of a scene point in the image coordinate system, and(xiu,yiu)is its new location resulting from the correction applied.K1,K2andK3are the radial distortion coefficients and p1and p2are the tangential distortion coefficients, withr2=xi2+yi2.
eQ= N
∑
i=1
kpi0−(R0pi+T
0
)k2 (5)
The RMS error of the distance between the points of two data sets is calculated through the square root of the arithmetic mean of the quadratic error as given by Equation6:
eRMS= r
1
N eQ (6)
where N is the number of points in the clouds, p0i is a point cloud with (rigid) rotation R0 and translationT0 andpirepresents an initial point cloud.
3. Related Works
As listed above, there are several sensing devices for developing 3D vision applications available in the market, which we could divide in this work into two large groups according to the technology they use: infrared light and stereoscopic vision devices. As cited above, in the first group the most popular are the MS Kinect, Asus Xtion and the PrimeSense, and in the second group we can find the PointGrey Bumblebee, RICOH SV-M-S1, the Minoru 3D Camera and the Stereolabs ZED. There is a number of previous works that have done researches on the performance and functionality of each device, comparing them or their error, as presented next.
3.1. Comparison of sensors for 3D vision
The work of Diaz [9] compares two generations of RGB-D sensors by evaluating the Asus Xtion Pro and MS Kinect v2 sensors. The reported results confirm that the latter has higher accuracy and lesser noise under controlled lighting conditions. In the work of Samir [10], the MS Kinect v1 and v2 are evaluated for tracking the breathing (respiratory) movement in humans. The results show that the accuracy of v2 is slightly better than v1. In terms of static accuracy, its error is stable around 5mm up to a distance of 4.5m.
Kazmi [11] presents a comparison of the PointGrey Bumblebee XB3 and MS Kinect v2, concluding that ToF cameras are sensitive to ambient light and stereo vision is relatively more robust for outdoor lighting and also that it has better resolution. In the same way Sabattini [12] and Beltran [13] test the PointGrey Bumblebee XB3 and MS Kinect v1. The results show that, due to the resolution, the BumbleBee stereo camera has a better performance in localizing a mobile robot.
3.2. Accuracy estimation methodologies for 3D vision sensors
Since its inception the MS Kinect has been used for the development of applications in computer vision. It is known that it has limitations, one of them is that the error in the depth measurements increases quadratically with the increasing of the distance between the sensor and the target [14]. For mapping applications it is recommended that data should be acquired from 1 to 3m of distance to the sensor. Also, a mathematical model to calculate the error at a given distance is proposed in that previous work [14].
The work by Haggag [15] compares MS Kinect and Asus Xtion, concluding that the first is more sensitive to radiant illuminated objects. It is also reported that the infrared rays emitted by the depth sensor affect the accuracy of the depth of the another sensor if they come to be used together to capture the same scene, without sufficient separation.
The characteristics of MS Kinect stochastic errors are presented for each direction of the axis in the work by Choo [17]. The depth error is measured using a 3D chessboard, similarly the one used in our approach. The results show that, for all three axes, the error should be considered independently. In the work of Song [18] it is proposed an approach to generate a per-pixel confidence measure for each depth map captured by MS Kinect in indoor scenes through supervised learning and the use of artificial intelligence.
A problem in all the above works is the use of specifically developed techniques that are not able to be applied to each another device. Even in the comparisons found, different techniques are used for different devices. So, based on the methodology described in Section2, from here we start building our system model for error estimate determination in a generic 3D device, aiming to generalize this procedure for any device.
4. The proposed approach
Basically, our system starts with capture of data and construction of point clouds, and registering them, ending up with RMS error determination.
4.1. Acquiring images and depth data
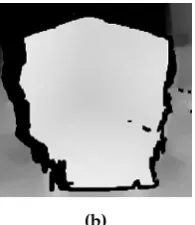
Using the sensing device, it is taken an initial image of the checkerboard and its depth map, as shown in the Figure2. Note that this pattern used has the some specific characteristics:
• Each plan contains a chess.
• The sizes of all black and white squares are the same.
• Each chess has a white space at its border to make the corners detection more robust in various lighting conditions and environments.
• Each chess has a different number of inner corners (example 6x4, 7x6, 7x5, etc.).
(a) (b)
Figure 2.RGB Image (a) and depth map (b), taken with the 3D vision sensor.
We remark that in the case of a stereo vision sensing device, an RGB image is obtained from the left camera by our system.
4.2. Corners detection and coordinates converting
To find the(u, v)coordinates of each corner within the pattern, we propose using the method proposed by Geiger [19] instead of known methods for that existent in Matlab and OpenCV. We adapted these functions to detect and order the corners according to the scheme shown in Figure3.
Devices that provide depth data generally relate a color image to the map, so that for each pixel (u,v)in the image, the map has a depth valueZc, as seen in Figure4. With the values of(u,v)andZc
we can getXcandYcusing the Equation2. Thus, each corner can be obtained from the pattern in 3D
4.3. 3D Corners representation: Registration and alignment
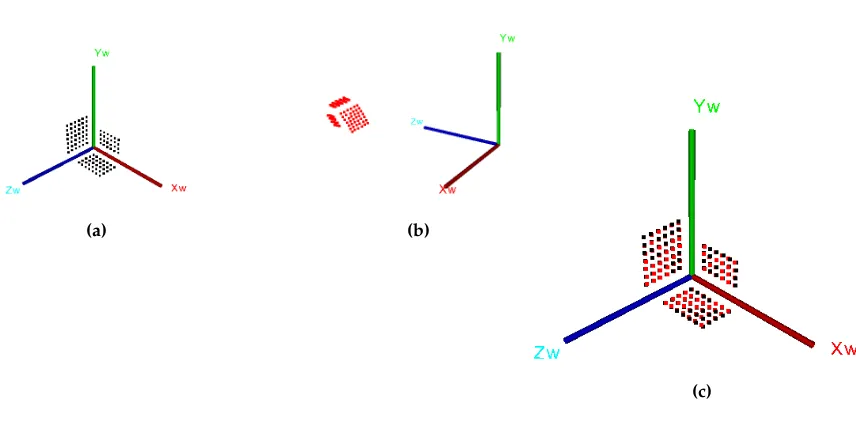
With the(Xc,Yc,Zc)coordinates of each corner it is possible create a point cloud with the real
locations as shown in Figure5a. Likewise, an ideal cloud can be created since the coordinates of each corner of the 3D pattern are known Figure5b. Then, using the algorithm above mentioned [8], we can finally provide the registration, that is, to obtain the matrix[R|t]of both point clouds, and align them in a single world coordinate system, as shown in Figure5c.
4.4. RMS error estimation
For the estimation of the error in depth data provided by the 3D vision sensor, the quadratic error is calculated using the Equation5. Here we perform a summation of the euclidean distances
|e1|,|e2|,|. . .|,|en| measured for each point (p1,p2, . . . ,pi) to (p1,p2, . . . ,pr) as shown in the Figure6. The RMS error is obtained by using the Equation6.
(a)
(b)
Figure 3.Detection (a) and ordering (b) of corners in the three planes of the pattern.
(a) (b)
(c)
Figure 5.Point clouds, (a) ideal (black), (b) real (red), (c) result of registering and alignment.
Figure 6.RMS error computational process on the resulting point cloud.
4.5. Generalizing the Method
Once all the steps of the method are known, a procedure for making it more general is introduced here, as described in the Algorithm1:
• Take an image of the pattern with the 3D vision sensor (left camera in the stereo case) and get its depth map.
• Detect the internal corners of the pattern and find its coordinates(u, v)in pixels. Using these coordinates, search within the map for the corresponding depth value.
• Find the(Xc, Yc, Zc)coordinates of each corner, using 2D equations for 3D projection. In other words, convert the image coordinates of each corner into camera coordinates.
• Create a point cloud with the ideal locations (in mm) of each corner in the pattern.
• Using the coordinates(Xc, Yc, Zc)form a cloud of points with real coordinates (in mm).
• Register and align the real and ideal clouds of points and find the transformation matrix[R|t].
• Calculate the difference between the ideal and real coordinates of each corner and get the RMS error value.
Algorithm 1:Algorithm for depth data error estimation provided by 3D vision sensor. input :3DVSensor: Device to be measured error;
l: Side dimension (mm) of each square in the pattern
output:RMSerror: RMS error in depth data provided by 3D vision sensor
/* Image-Depth Map - Corner Detection */
1 f lag= f alse; 2 while f lagdo
3 if3DVSensorthen
4 src←3DVSensor.retrieve(RGB); 5 depth←3DVSensor.retrieve(DEPTH); 6 [cUV,xyS,yzS,xzS]← f indCorners(src); 7 ifcUVthen
8 f lag=true;
/* 3D Corners Representation */
// Real Point Cloud (mm)
9 fori=0 : 1 :i<cUV.size()do 10 Zc=depth(cUV[i].y,cUV[i].x); 11 3Dpoint←
u−Cx
f x Zc, v−Cy
f y Zc,Zc
;
12 cCamera=3Dpoint;
13 fori=0 : 1 :i<cCamera.size()do 14 pointXYZ←cCamera[i].XYZ; 15 realCloud= pointXYZ;
// Ideal Point Cloud (mm)
16 cWorld←createcWorld(xyS,yzS,xzS,l); 17 fori=0 : 1 :i<cWorld.size()do 18 pointXYZ←cWorld[i].XYZ; 19 idealCloud=pointXYZ;
20 [R|t]←registrationSVD(realCloud,idealCloud;
/* RMS error estimation */
21 fori=1 : 1 :realCloud.size()do
22 eQ←kidealCloud−(R∗realCloud+t)k2; 23 eRMS=
s
1
realCloud.size() eQ; 24 returneRMS;
being this procedure executed locally without necessity of benchmarks or other data for getting the errors.
5. Experiments and results
To verify the usefulness of the proposed method and to test it we constructed an embedded system [20], which is basically composed of an nVIDIA Jetson TK1 development board and any sensing devices. In this case we use the MS kinects v1 and v2, and the Stereolabs ZED (see Figures7). Notice that other devices like Minoru 3D stereo camera and PointGrey Bumblebee could also be used here, mainly for comparing their performance. However the subject of this work is the method itself, thus the three chosen devices are enough to show its robustness. In such embedded systems the same algorithm is implemented without modifications in order to test the devices.
(a)
(b)
(c)
Figure 7. 3D vision sensors used in the experiments, (a) MS Kinect v1, (b) MS Kinect v2 and (c) Stereolabs ZED.
shown in Figure2. After the corners are detected and the point clouds are constructed, the RMS error for the depth data is obtained.
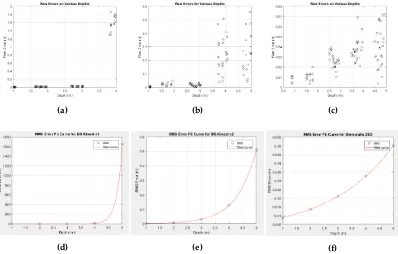
With the raw error and depth data of Figures8a,8band8c, the mathematical models for the RMS error of the MS Kinect v1, v2 and the Stereolabs ZED camera are obtained at a similar capture resolution (640x480px, 512x424 and 672x376px). Figures8d, 8eand8frepresent the adjustment of the data to a curve using least squares regression, in order for a better understanding of the error bound. The use of an exponential fitting curve is justified here due to the relationship between data sources. In the case of the MS Kinect v1, the RMS error and the depth data have a correlation measure of 0.89. For the MS Kinect v2 this correlation is of 0.79 and it is of 0.98 for the Stereolabs ZED camera. Table1, lists the coefficients for the exponential curves with the Equation7and the SSE value, which is the sum of squares due to error of the fitting strategy. A value close to zero indicates a good fitting, which is more useful for the prediction.
eRMS=a∗exp(b∗depth) (7)
Table 1.Coefficients and SSE of exponentially adjusted curves for the RMS error.
Device Coefficients
(with 95% confidence bounds) SSE Kinect v1 a=2,009e-08; b=5,027 0,000168 Kinect v2 a=0,0004875; b=1,392 0,000333 ZED a =0,005823; b=0,4306 8,919e-07
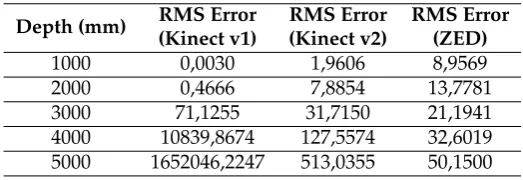
Table 2.RMS error (in millimeters) results for the various 3D vision sensors.
Depth (mm) RMS Error (Kinect v1)
RMS Error (Kinect v2)
RMS Error (ZED)
1000 0,0030 1,9606 8,9569
2000 0,4666 7,8854 13,7781
3000 71,1255 31,7150 21,1941
4000 10839,8674 127,5574 32,6019 5000 1652046,2247 513,0355 50,1500
6. Conclusion
(a) (b) (c)
(d) (e) (f)
Figure 8. Upper plots show raw error data estimated for various depths: (a) MS Kinect v1, (b) MS Kinect v2 and (c) Stereolabs ZED. These data are estimated with the checkerboard pattern placed at various distances from the 3D vision sensors. Bottom graphics show the fitted curves for (d) MS Kinect v1, (e) MS Kinect v2 and (f) Stereolabs ZED.
order to test and verify their errors. Basically, a series of points extracted from a 3D checkerboard are used for computing a point cloud that is compared to a previous known coordinates of an ideal point cloud, through using a registering procedure and a posterior RMS based error measure procedure. Such kind of approach is extremely important for applications that rely on the given error of a device in order to have better performance as is the case of 3D methods in probabilistic robotics (for mapping and visual SLAM), in computer graphics and vision, and in virtual reality applications.
The proposed method can be implemented in any device including PC architectures or development boards as the nVIDIA Jetson family, and can be used to estimate the depth data error of any 3D vision sensor such as MS Kinect v1/v2, Asus Xtion Pro, PrimeSense Carmine, and the PointGrey Bumblebee stereo camera among others.
An advantage of the proposed method is that a 1D/2D/3D pattern can be used. Considering that in the experiments the most reliable RMS error values were obtained using 2D/3D checkerboards because the error is analyzed in two and three axes respectively, separately.
Most works found in the literature provide an accuracy analysis for RBGD devices, however there is little or no information on the error for stereo devices, so this work also provides a new tool for the users of said devices that work in application development to 3D vision, as is the case of the ZED stereo camera.
As a further, currently ongoing work, we will provide a comparison between data coming from the most known 3D sensor devices used in robotics, computer graphics, virtual reality, and vision as: ZED camera (all resolutions and distances), Bumblebee XB3 camera, and the Minoru 3D system.
Acknowledgments: We thank CNPq and CAPES, Brazilian Sponsoring Agencies for Research Sponsoring, for the grants of Luis Fernandez (CAPES), Viviana Avila (CAPES), and Luiz Gonçalves (CNPq).
construction, mainly reporting and analyzing the results. Luiz Gonçalves is supervisor of both and has contributed with the ideas, physical and intellectual resources necessary, mainly with the background on computer vision, and with the text (writing and revising).
Conflicts of Interest:The authors declare no conflict of interest. The founding sponsors had no role in the design of the study; in the collection, analyses, or interpretation of data; in the writing of the manuscript, and in the decision to publish the results.
Abbreviations
The following abbreviations are used in this manuscript:
RGB-D: Red, Green, and Blue (Colored Image) plus Depth
ZED: Name for the Stereolabs 3D stereo cameras device (without any meaning) 3D: Three-Dimensional (in space dimension)
GPU: Graphics Processing Unit
nVIDIA: A Company that produces GPU boards UAV: Unmanned Aerial Vehicle
RMS: Root Mean Squared
SVD: Singular Value Decomposition
References
1. FLIR. (formerly Point Grey Research) Bumblebee 3D Stereo Vision Cameras Systems. https://www.ptgrey.com/stereo-vision-cameras-systems, 2017. Accessed: 2017-05-18.
2. Stereolabs. ZED 2K Stereo Camera - The World’s First 3D Camera for Depth Sensing and Motion Tracking. https://www.stereolabs.com/, 2017. Accessed: 2017-05-18.
3. Minoru3D. (Webcam) Stereo 3D Camera. http://www.minoru3d.com/, 2017. Accessed: 2017-05-18. 4. Microsoft. Meet Kinect for Windows. https://developer.microsoft.com/en-us/windows/kinect/, 2017.
Accessed: 2017-05-18.
5. Asus. Xtion Pro Series 3D Depth and RGB Sensor. https://www.asus.com/3D-Sensor/, 2017. Accessed: 2017-05-18.
6. OpenNI. 3D Sensor Carmine 1.08 Specifications. http://openni.ru/rd1-08-specifications/index.html, 2017. Accessed: 2017-05-18.
7. Trucco, E.; Verri, A.Introductory Techniques for 3-D Computer Vision; Prentice Hall, 1998.
8. Arun, K.S.; Huang, T.S.; Blostein, S.D. Least-Squares Fitting of Two 3-D Point Sets. IEEE Transactions on Pattern Analysis and Machine Intelligence1987,PAMI-9, 698–700.
9. Diaz, M.G.; Tombari, F.; Rodriguez-Gonzalvez, P.; Gonzalez-Aguilera, D. Analysis and Evaluation Between the First and the Second Generation of RGB-D Sensors.IEEE Sensors Journal2015,15, 6507–6516. 10. Samir, M.; Golkar, E.; Rahni, A.A.A. Comparison between the Kinect V1 and Kinect V2 for respiratory motion tracking. 2015 IEEE International Conference on Signal and Image Processing Applications (ICSIPA), 2015, pp. 150–155.
11. Kazmi, W.; Foix, S.; Alenyà, G.; Andersen, H.J. Indoor and outdoor depth imaging of leaves with time-of-flight and stereo vision sensors: Analysis and comparison. {ISPRS} Journal of Photogrammetry and Remote Sensing2014,88, 128 – 146.
12. Sabattini, L.; Levratti, A.; Venturi, F.; Amplo, E.; Fantuzzi, C.; Secchi, C. Experimental comparison of 3D vision sensors for mobile robot localization for industrial application: Stereo-camera and RGB-D sensor. Control Automation Robotics Vision (ICARCV), 2012 12th International Conference on, 2012, pp. 823–828. 13. Beltran, D.; Basañez, L., A Comparison between Active and Passive 3D Vision Sensors: BumblebeeXB3 and Microsoft Kinect. In ROBOT2013: First Iberian Robotics Conference: Advances in Robotics, Vol. 1; Armada, M.A.; Sanfeliu, A.; Ferre, M., Eds.; Springer International Publishing: Cham, 2014; pp. 725–734. 14. Khoshelham, K. Accuracy Analysis of Kinect Depth Data. ISPRS - International Archives of the
15. Haggag, H.; Hossny, M.; Filippidis, D.; Creighton, D.; Nahavandi, S.; Puri, V. Measuring depth accuracy in RGBD cameras. Signal Processing and Communication Systems (ICSPCS), 2013 7th International Conference on, 2013, pp. 1–7.
16. Yang, L.; Zhang, L.; Dong, H.; Alelaiwi, A.; Saddik, A.E. Evaluating and Improving the Depth Accuracy of Kinect for Windows v2. IEEE Sensors Journal2015,15, 4275–4285.
17. Choo, B.; Landau, M.; DeVore, M.; Beling, P.A. Statistical Analysis-Based Error Models for the Microsoft KinectTM Depth Sensor. Sensors2014,14, 17430.
18. Song, X.; Zhong, F.; Wang, Y.; Qin, X. Estimation of Kinect depth confidence through self-training. The Visual Computer2014,30, 855–865.
19. Geiger, A.; Moosmann, F.; Car, O.; Schuster, B. Automatic camera and range sensor calibration using a single shot. 2012 IEEE International Conference on Robotics and Automation, 2012, pp. 3936–3943. 20. Fernandez, L.O.; Avila, V.C.; Gonçalves, L. 3DRT - Embedded System for 3D Reconstruction in Real Time.