Original research article
1
The Effect of Ambient Temperature on Electric Power
2
Generation in Natural Gas Combined Cycle Power
3
Plant: A Case Study
4
Günnur Şen1, Mustafa Nil1*, Hayati Mamur1, Halit Doğan1, Mustafa Karamolla1, Mevlüt Karaçor2,
5
Fadıl Kuyucuoğlu1, Nuran Yörükeren3, M. R. Amin Bhuiyan4
6
1 Engineering Faculty, Manisa Celal Bayar University, 45140, Manisa, Turkey; gunnur_sen@hotmail.com,
7
hayati.mamur@cbu.edu.tr, halit.dogan@cbu.edu.tr, mustafa.karamolla@cbu.edu.tr
8
2 Technology Faculty, Manisa Celal Bayar University, 45400, Manisa, Turkey; mevlut.karacor@cbu.edu.tr
9
3 Engineering Faculty, Kocaeli University, 41100, Kocaeli, Turkey; nurcan@kocaeli.edu.tr
10
4 Department of Electrical and Electronic Engineering, Islamic University, 7003, Kushtia, Bangladesh;
11
mrab_eee@iu.ac.bd
12
* Correspondence: mustafa.nil@cbu.edu.tr; Tel.: +90-544-569-8672
13
14
Abstract: Natural gas combined cycle power plants (CCPPs) are widely used to meet peak loads in
15
electric energy production. Continuous monitoring of the output electrical power of CCPPs is a
16
requirement for power performance. In this study, the role of ambient temperature change having
17
the greatest effect on electric production is investigated for a natural gas CCPP. The plant has
18
generated electricity for fourteen years and setup at 240 MW in Aliağa, İzmir, Turkey. Depending
19
on the seasonal temperature changes, the study data were obtained from each gas turbine (GT),
20
steam turbine (ST) and combined cycle blocks (CCBs) in the ambient temperature range of 8-23°C.
21
It has been found that decreases of the electric energy in the GTs because of the temperature
22
increase and indirectly diminishes of the electricity production in the STs. As a result, the efficiency
23
of each GT, ST and CCB reduced, although the quantity of fuel consumed by the controllers in the
24
plant was decreased. As a result of this data, it has been recommended and applied that additional
25
precautions have been taken for the power plant to bring the air entering the combustion chamber
26
to ideal conditions and necessary air cooling systems have been installed.
27
Keywords: energy efficiency; combined cycle power plant; energy losses
28
29
1. Introduction
30
Energy founds in various forms such as heat, light, electricity, kinetic and potential in the
31
environment. Today, energy is among the indispensables of mankind. Among the energy types,
32
electricity energy is used often because it can be easily converted into other energy resources. While
33
fossil fuels such as petroleum, natural gas and coal are used for the production of electricity,
34
renewable energy resources such as wind, sun and geothermal also are used much more recently.
35
Electric power generated by using fossil fuels is employed in conventional power plants.
36
Thermal power plants, natural gas and nuclear power plants are among these traditional power
37
generation plants. These plants account for about 80% of electricity energy production in the world
38
[1]. This amount is quite high [2]. When energy expenditures and energy policies are considered in
39
the world, it is not expected that this amount would fall in the future at a great rate. Because the unit
40
production cost of renewable energy resources is still higher than the ones using traditional energy
41
resources [3]. When the studies are examined, researches are conducted in that these plants are
42
modernized and are made less harmful to the environment [4-7]. Since these power plants are highly
43
powerful, the smallest improvement proves to achieve a power level of MWs [8].
44
Conventional electric energy production plants have advantages such as higher power
45
generation, being able to be installed close to energy resources, being able performed to meet peak
46
loads when required, and being easier to access their technology [9]. However, the fact that the gases
47
emitted from these power plants cause damage to the environment and cause acid rain, also has the
48
disadvantages such as throwing away the water used in the power plant without cleaning it [10]. But
49
these disadvantages can be minimized by taking effective measures [7].
50
In conventional electric power generation plants, both gas turbines (GT) and steam turbines
51
(ST) are used. There are also natural gas combined cycle power plants (CCPPs) that use these two
52
types of turbines together [11] and have recently received great attention due to their efficiency [12].
53
Bronton Cycle in GTs of CCPPs and Rankine Cycle in STs are used [13, 14]. Therefore, CCPPs
54
provide lower environmental gas emissions, higher thermal efficiency and flexibility than other
55
conventional power plants [15].
56
Monitoring of electric energy production since the installation of natural gas CCPPs is
57
important for ensuring continuity of installed power efficiency [16, 17]. Moreover, their
58
thermodynamic modeling and continuous analysis of all hardware is an important measure to keep
59
the yield value high [18-20]. Considering all these facts, various studies have been carried out in the
60
literature in order to increase the yields for natural gas CCPPs, to improve the working conditions of
61
CCPP by performing energy and exergy analyzes and to minimize the harmful effects on
62
environment.
63
Almutairi et al. [21] The energetic and exergetic analyzes of a 2 GW CCPP operating at a yield of
64
54.5% on regional conditions have been carried out in their study. They argued that
65
low-temperature heat source technologies would increase plant performance without additional fuel
66
entry. Ameri et al. [22] they have conducted analyzes of a 420 MW CCPP. In their work, Neka
67
calculated the assesment of the irreversibility of each part of the CCPP. Within all the energy losses,
68
the fuel chamber has shown that it generates 83% of the GT, channel burner and heat recovery steam
69
generator (HRSG) losses. In addition to these, Tüfekci [23] based on six years of acquired CCPP data,
70
to get the best out of the CCPP, the machine learning regression method determines how being best
71
CCPP installation. In another study, Herraiz et al. [24] The exhaust gas recirculation has been
72
studied in order to provide the best burning in CCPP, to reduce the emission of flue gas and to
73
increase the efficiency and to minimize the environmental damages. Sahin et al. [25] have performed
74
an exergo-economic analysis of a CCPP and have reached different CCPP sizes and configurations in
75
their work in terms of energy-exergy efficiency, electricity cost and total investment criteria,
76
reducing electricity costs, minimizing environmental concerns and reducing investment costs.
77
Ganjehkaviri et al. [26] have suggested that maintaining at 88% the steam quality at the turbine
78
outlet station is a more realistic and feasible value for operating the ST in the CCPP at the optimum
79
level. Kilani et al. [27] made the comparison of CCPP in the two different structures in which the
80
vapor in the fuel chamber is different In the first, the injected steam was produced in the HRSG,
81
while the other was supplied using the HRSG placed at the outlet of the compressor. According to
82
the results, the second project was more effective in increasing performance.
83
It is also important to predict the electricity supplied by the natural gas CCPPs to the network in
84
order to meet the peak load [28]. The output powers of the GTs used in these are the most effective
85
parts of the system [29]. For the reuse of unburned gas, processes are operated with additional
86
devices in the CCPP system [30]. These output powers also vary with ambient temperature,
87
pressure, relative humidity, fuel structure, heat and power drawn [31-33]. From these variables, it
88
was determined that the most effective one in the system is the ambient temperature depending on
89
the front four-year data recorded. Depending on this result, additional arrangements for the air
90
cooler section have been added to the system to keep the air temperature entering the fuel chamber
91
at about 8°C. In this way, it is ensured to get the optimum level for the production of electricity of
92
used the energy source and to be operated the plant with the best efficiency.
93
In the first part of the present study, a brief introduction and literature search are given, then in
94
the second part, combined power plants, plant characteristics and flow chart are presented. In
95
addition, for energy and efficiency analysis the relevant equations are explained. In the third
96
chapter, the obtained results and conclusions are given. Finally, the results are expressed in the
97
2. Material and Methods
99
2.1. Combined power cycle plants
100
One of the plants that use fossil fuels is natural gas CCPPs. These natural gas CCPPs are an
101
electric power generation plant that is important for the establishment in the world and especially in
102
developing countries and they use natural gas as fuel type. Energy conversion block diagram of a
103
natural gas CCPP is shown at Figure 1.
104
105
106
Figure 1. Energy conversion block diagram of a natural gas CCPP.
107
Natural gas CCPPs are more efficient because they keep at low level the amount of fuel to be
108
used for energy production at the same level compared to single-cycle power plants. In combined
109
cycle systems, as well as being provided cycling of GT with burning fuel, the water, which is heated
110
in the HRSG and transformed to stream with the heat of the released exhaust gases, is sent to ST as
111
hot steam and this provides cycling of ST. Thus, with the fuel burned to cycle the GT, energy is
112
generated from the generators connected to both GT and ST. This increases the amount of energy
113
production and thus increases the efficiency of the combined cycle system.
114
115
2.2. Characteristics of the analyzed combined cycle natural gas power plant
116
In this study, the efficiency of electric energy production is considered according to the ambient
117
temperature of the 240 MW natural gas CCPP installed in the study and the appearance is located at
118
Figure 2. This natural gas CCPP consists of two combined cycle blocks (CCPs), each consisting of
119
two GTs, two HRSGs and one ST in each CCP. The models of the GTs used are the GE LM6000 and
120
the models of the STs are Thermodyn 8-10MC10.
121
123
Figure 2. HABAS natural gas CCPP in Aliağa, İzmir, Turkey.
124
125
2.3. Equation
126
It is important to be able to meet the power demanded by CCPPs. It should be monitored
127
continuously how much electricity the power plant can produce. Efficiency changes from fuel,
128
media and used equipment must also be calculated so that you can estimate how much of the
129
demanded energy can be met. For this purpose, the following equations are needed to calculate the
130
energy efficiencies of CCPP.
131
The energy released in a combustion gas resulting from a natural gas CCPP (QGYy- kcall/h);
132
amount of fuel consumed per hour (By - m3/h) is proportional to the instantaneous thermal value of
133
the fuel (Hy - kcall/m3) and is given by the following equation:
134
y y
GTy B H
Q (1)
According to the measurements made in natural gas CCPP, natural gas fuels carry 9564,208 kcal
135
energy. 1 kW is calculated as 860 kcall. The amount of energy released in kW (EGYy - kW/h) is
136
expressed as follows:
137
860
/
GTy
GTy
Q
E
(2)There are four GTs and two STs in the examined natural gas CCPP The amount of electric
138
power generated from these is shown as EGT1, EGT2, EGT3, EGT4, EST1, and EST2.
139
The yield value from a GT (ηGT) is described as follows:
140
GTy GT
GT
E
E
(3)In the examined natural gas CCPP, a CCB called CCB1 consists of two GTs and one ST.
141
Accordingly, the total energy generating of CCB1 (EBLOCK1- kW/h) is given as follows:
142
1 2 1
1 GT GT ST
BLOCK E E E
E (4)
Similar to CCB1 in CCB2, it is made from two GTs and one from ST. In this case, the total energy
143
generating of CCB2 (EBLOCK2- kW/h) is described as follows:
144
2 4 3
2 GT GT ST
BLOCK E E E
E (5)
After combustion, energy released from GTs (EGT1y, EGT2y - kW/h) forms a part of the input
145
energy quantities of natural gas CCPP. Therefore, the input energy amount of GTs in CCB1 (EBLOCK1y -
146
y GT y GT y
BLOCK
E
E
E
1
1
2 (6)The total of the input energies of the other two GTs in CCB2 (EGT3y, EGT4y, - kW/h) also form the
148
CCB2 GT input energy quantities. The total amount of CCB2 input energy that can be obtained
149
(EBLOCK2y - kW/h) is expressed by the following equation:
150
y GT y GT y
BLOCK
E
E
E
2
3
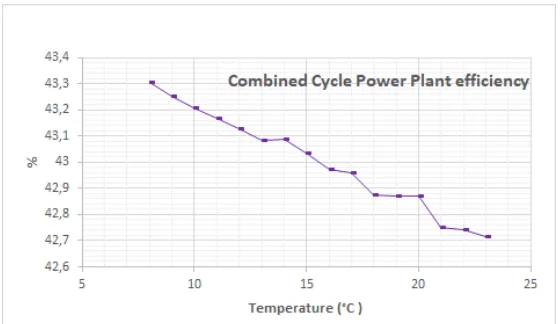
4 (7)Energy quantities produced in GTs and STs (EGT, EST) and depending on the amount of energy
151
released after the combustion, GTs (EGT) the efficiency of the CCBs (ηBLOCK) is expressed as follows:
152
BLOCKy BLOCK
BLOCK
E
E
(8)Depending on the amount of energy produced by each blot (EBLOCK1, EBLOCK2 - kW/h), the total
153
amount of energy produced in a natural gas CCPP (EPLANT - kW/h) is given as follows:
154
2
1 BLOCK
BLOCK
PLANT E E
E (9)
When input energy quantities released from the fuel in each CCB in the natural gas CCPP
155
(EBLOCK1y, EBLOCK2y - kW/h) the total amount of energy, which is released as the input energy in the
156
power plant, is calculated (EPLANT - kW/h) is as follows:
157
y BLOCK y
BLOCK
PLANTy
E
E
E
1
2 (10)When the energies obtained in each of the CCBs constituting the plant (EBLOCK1, EBLOCK2 - kW/h)
158
and the released energies of both CCBs to after the combustion (EBLOCK1y, EBLOCK2y - kW/hare known,
159
total power plant efficiency (ηPLANT) is found with the following equation:
160
)
(
)
(
/
PLANTy BLOCK1 BLOCK2 BLOCK1y BLOCK2yPLANT
PLANT
E
E
E
E
E
E
(11)3. Results and Discussion
161
In order to perform the efficient calculations of natural gas CCPP at different temperature
162
values, the necessary data were taken by the transmitters, current, voltage transformers and energy
163
analyzers located in the relevant places of the plant. The energies obtained from GTs and STs
164
between 8-23°C ambient temperatures were calculated based on the equations and these were
165
presented as a whole Table 1.
166
167
Table 1. Power generation values of GT and ST between ambient temperature 8-23°C.
168
Ambient
temperature
(°C)
Obtained power (MW) Ambient
temperature
(°C)
Obtained power (MW)
GT1 GT2 GT3 GT4 ST1 ST2 GT1 GT2 GT3 GT4 ST1 ST2
8 46 46.1 45.9 46 21.868 21.86 16 43.3 43.4 43.3 43.4 20.349 20.455
9 45.8 45.9 45.6 45.7 21.76 21.74 17 42.9 43 42.8 43 20.173 20.237
10 45.3 45.5 45.3 45.4 21.592 21.595 18 42.6 42.8 42.2 42.5 19.923 19.783
11 45 45.2 45 45.2 21.388 21.372 19 41.7 42 41,7 41.9 19.567 19.638
12 44.9 45 44.7 44.8 21.25 21.123 20 41.4 41.6 41,3 41.5 19.398 19.466
13 44.3 44.7 44,2 44.4 20.963 20.97 21 40.6 41 40.5 40.7 19.08 19.125
14 44 44.1 44 44.1 20.786 20.869 22 40.3 40.5 40.2 40.1 18.869 18.904
15 43.5 43.8 43.7 43.6 20.588 20.654 23 40 40.1 39.8 39.8 18.71 18.846
169
Electrical energy generating of GT1, GT2, GT3, GT4, ST1 and ST2 constituting natural gas CCPP
170
which is a combination of the combined cycle CCB1 and GT3, GT4 and ST2 combined with the
172
combination of GT1, GT2 and ST1 are presented.
173
174
(a) (b)
(c) (d)
(e) (f)
(g) (h)
Figure 3. GT, ST, CCB electric energy generating: (a) GT1, (b) GT2, (c) GT3, (d) GT4, (e) ST1, (f)
175
ST2, (g) CCB1 and (h) CCB2.
176
177
Figure 3 when examined in detail, the electric energy of GT1 is obtained 46 MW maximum at
178
ambient temperature of 8°C, depending on the sensor data of GT of natural gas CCPP. When the
179
ambient temperature was reached 15°C, the electric energy obtained from the GT1 was reduced to
180
43.5 MW. When the air temperature reached 23°C, the electric energy generating of 46 MW at 8°C
181
drops to 40 MW, although input was provided to generate maximum power at all temperatures
182
between 8-23°C via the GT1 controller. This situation has also been observed in other GTs. For GT2,
183
electric energy generating at 8°C was 46.1 MW, it was obtained as 43.8 MW at 15°C and 40.1 MW at
184
respectively for 8°C, 15°C and 23°C. The decrease value in the electrical energy obtained at the 15°C
186
temperature difference increase in GT3 is 6.1 MW. GT4 has close values to other GTs. The electric
187
energy generating at 8°C is 46 MW when it reaches 15°C and 43.6 MW when the temperature reaches
188
23°C, despite the value of the controller input for the highest electrical energy generating, the electric
189
energy generating was recorded as 39.8 MW decreasing 6.2 MW.
190
When the data obtained from all GTs were examined, almost 46 MW of electric energy was
191
generated at 8°C ambient temperature. When the ambient temperature reached 23°C at 15°C
192
temperature increase, their generated electrical energy decrease was estimated to be about 6 MW
193
and it was described as 40 MW.
194
The vapor produced using the CCBs, which have the exhaust gases from these GTs, combining
195
with the binary outputs formed the input energies of the STs. In other words, the input energies of
196
the STs were formed by the output exhaust energies of the GTs.
197
HRSG1 and HRSG2 systems were connected to the outputs of GT1 and GT2 in CCB1. The hot
198
exhaust gases obtained from the combustion in the combustion chambers of the GT1 and GT2 form
199
the inputs of the HRSG1 and HRSG2 systems. Here, the water is heated and pressurized into hot
200
steam, and forms the input energy of ST1. Therefore, changes in the generating of electric energy in
201
the GT1 and GT2 affect the generating of electric energy in the ST1.
202
The electrical energy obtained from ST1 was 21.9 MW when the ambient temperature was 8°C.
203
When the ambient temperature reached 15°C, electrical energy generating was reduced to 20.6 MW.
204
The outputs of the GTs were reduced by about 6 MW with increasing ambient temperature,
205
although the GTs that feed the ST1 was controlled by the controller for maximum power generation
206
at all temperatures between 8-23°C. Depending on the electrical energy generation in this ST1
207
ambient temperature 23°C, it reached 18.7 MW, decreasing 3.2 MW.
208
On the other hand, HRSG3 and HRSG4 systems were connected to the outputs of GT3 and GT4
209
in CCB2. The exhaust gases of GT3 and GT4 also constituted the input energies of HRSG3 and
210
HRSG4. The hot steam which was heated and pressurized by these systems was given to ST2. The
211
generating production of GT3 and GT4 affected the electric energy generating of ST2.
212
When ST2's electric energy generating was examined, the ambient temperature was 21.9 MW of
213
electric energy at 8°C. When the ambient temperature increased a little and reached 15°C, the
214
amount of electricity generated was slightly reduced and was recorded as 20.7 MW. Even when
215
control signals were sent with the help of a controller to generate maximum power to the GT3 and
216
GT4 that feed this type, when the ambient temperature reached 23°C, the electric energy from the
217
ST2 was 18.9 MW being reduced by about 3 MW.
218
On the other hand, when electrical energy productions of CCBs were examined, it was
219
observed that this GT and the STs connected to these CCBs differed depending on the energy
220
generating changes. The CCB1 system was created with GT1, GT2 and ST1. In CCB1, when the
221
ambient temperature was 8°C, the maximum electric energy was 114.0 MW, the maximum
222
temperature was 107.9 MW when the ambient temperature increased to 15°C. Although the
223
controller input for generating the maximum power at all temperatures between 8-23° C was
224
provided to the units constituting CCB1, the electric energy generating at 114.0 MW at 8° C has
225
reached the ambient temperature of 23°C, and 15°C temperature raised 15.2 MW down to 98.8 MW.
226
As for the other cycle block CCB2, the electric energy generating was close to the other CCB1
227
system. This has been introduced in CCB2 from GT3, GT4 and ST2. The electrical energy produced at
228
ambient temperatures of 8°C, 15°C and 23°C was measured as 113.8 MW, 108.0 MW and 98.4 MW,
229
respectively. The increase in temperature from 8°C to 23°C caused about 15.4 MW of energy loss.
230
The exhaust output of the two GTs in this natural gas CCPP combined to feed an ST. There are
231
two systems in this cycle. These are CCB1 and CCB2. Combined with these, a combined power
232
conversion plant was established. As a result, electrical energy generating of all natural gas CCPP
233
235
Figure 4. Electrical energy generating of natural gas CCPP.
236
237
Since the output power of the natural gas CCPP CCB1 and CCB2 blocks and the CCB1 and
238
CCB2 GTs were affected by the temperature, the overall system output had also changed depending
239
on their output. Figure 4, the electric energy output of natural gas CCPP was 227.7 MW at 8°C.
240
Although the output powers of all the units that make up the natural gas CCPP were adjusted to the
241
maximum power output by the controllers, this output value decreased as the temperature
242
increases. It is from 215.8 MW at 15°C to 197.3 MW at 23°C. There was a 30.4 MW decrease in power
243
consumption achieved at a temperature increase of approximately 15°C.
244
For all GTs at 8-23° C in the GTs, the amount of fuel going to the combustion chamber for each
245
GT in the combustion reaction (By) were measured and recorded with flow transmitters in the fuel
246
line. At the same time, the thermal value of the fuel used (Hy) was confirmed by BOTAS.
247
When the ambient temperature changes, the amount of oxygen in the air in the unit volume
248
varies. Since the difference in the amount of oxygen is effective in the combustion reaction occurring
249
in the combustion chamber, the amount of fuel entering the combustion chamber is being adjusted
250
by the control system of the GTs. The GT inspection system performs this operation by closing and
251
opening the fuel valve with a proportional valve.
252
Depending on the amount of fuel coming into the combustion chamber (By) and the thermal
253
value of the fuel passing (Hy) through the input power of the GT1, GT2, GT3 and GT4 was calculated
254
(1) and (2). The energy values (EGTy - kW/h) released from the fuel entering the combustion chamber
255
for temperature values between 8-23°C as a result of calculations and measurements were found.
256
Burning the fuel in GTs, the energy was disappointed. The released amount of energy forms part of
257
the input energies of the STs. These values are obtained from (6) and (7) (EBLOCKy - kW/h). Input
258
energy changes of GT1, GT2, GT3, GT4, CCB1 and CCB2 depending on the measured and calculated
259
values are shown as Figure 5.
260
Figure 5 when examined, the input energy of the GT1 was 131.4 MW when the ambient
261
temperature was 8°C. When the temperature increased to 15°C, the controller of the GT1 tried to
262
regulate the fuel entering the combustion chamber and measured the input power of 124.7 MW. At
263
an ambient temperature of 23°C, the GT1 control system continued to fuel the combustion chamber
264
further and the energy released in the combustion chamber of the GT1 was recorded at 114.8 MW
265
with a reduction of 16.6 MW. In GT2, while it has an input energy of 131.6 MW at 8°C, at 15°C the
266
controller tried to adjust by reducing the fuel entering the combustion chamber and the input power
267
was measured as 125.6 MW. When the ambient temperature reached 23°C, this input power was
268
further reduced and reduced to 115.5 MW. The input energy for the GT3 was 131.5 MW, 126.1 MW
269
and 115.7 MW, respectively for 8°C, 15°C and 23°C. The input energy of the GT4 in CCB2 was
270
measured at 131.4°C at 8°C and 115.9 MW at a temperature increase of 23°C with a reduction of 15.5
271
When GTs are considered collectively, the input power of almost every one at 8°C is 131 MW.
273
Their input power values decreased with temperature increase and were measured as about 115
274
MW. A decrease of 16 MW was observed when rising the temperature from 8°C to 23°C.
275
On the other hand, these reductions in the energy input values of the GTs cause the input
276
energies of CCB1 and CCB2 to decrease. In CCB1 the input energy was measured as 262.9 MW and
277
230.2 MW for 8°C and 23°C, respectively. The fall in input energy has been about 32.7 MW. In CCB2,
278
the total input energy to the open combustion chamber at 8°C was 262.9 MW and 231.6 MW with a
279
reduction of 31.3 MW at 23°C.
280
281
(a) (b)
(c) (d)
(e) (f)
Figure 5. The input energy changes for GT, ST, CCB1 and CCB2 are: the input energy changes
282
(a) GT1, (b) GT2, (c) GT3, (d) GT4, (e) CCB1 and (f) CCB2
283
284
As a result, natural gas CCPP energy input (EPLANTy - kW/h) was obtained by the total energies of
285
CCB1 and CCB2 units. The input energy of natural gas CCPP was found to be 525.8 MW for 8°C and
286
501.6 MW for 23°C with the aid of (10). The increase in ambient temperature from 8°C to 23°C
287
caused a reduction of about 24.2 MW at the input power of natural gas CCPP. The energy input of
288
this natural gas CCPP change is shown at Figure 6.
289
The efficiency of GTs and CCBs that make up the natural gas CCPP is presented Figure 7 These
290
energy generating efficiency values were met by division the amount of electricity generated in each
291
the ratio of the energy obtained from the fuel that is used to generate electricity and by being
292
294
Figure 6. Natural gas CCPP energy input.
295
296
297
(a) (b)
(c) (d)
(e) (f)
Figure 7. GTs and CCBs efficiency: (a) GT1, (b) GT2, (c) GT3, (d) GT4, (e) CCB1 and (f) CCB2.
298
299
With the increase in air temperature in the GT1, the energy output of 46 MW at 8°C declined to
300
40 MW at 23°C, despite the command to generate maximum power to the GT1, the energy released
301
The control system of the GT2 is equipped with temperature transmitters and gets ambient
303
temperature information. Since the amount of oxygen in the unit air is reduced as the temperature
304
increases, the control system attempts to reduce the amount of fuel entering the combustion
305
chamber so as to prevent excess fuel from entering the combustion reaction and to prevent it from
306
being thrown out. By doing so, the efficiency was tended to stabilize but the efficiency decreased
307
from 35.0% at 8°C to 34.9% at 23°C. Despite the increase in ambient temperature in GT2, the electric
308
energy generating at 46.1 MW at 8°C declined to 40.1 MW at 23°C, despite the command to generate
309
maximum power to GT2. The energy released from the fuel entering the combustion chamber at 8°C
310
was 131.6 MW, and at 23°C it was 115.5 MW. Depending on these, the electricity production of GT2
311
was calculated as 8°C and 23°C, 35.0% and 34.7%, respectively. The output value of the GT3 is also
312
close to that of the GT1 and GT2 and has decreased with the increase of the air temperature. These
313
values were found to be 34.9% for 8°C and 34.4% for 23°C. The efficiency of GT4 in CCB2 was also
314
35.0% and 34.4% for 8°C and 23°C, respectively.
315
Efficiency calculations have been made for CCBs. The efficiency values of CCBs are
316
significantly affected by the efficiency changes of GTs. The hot gas obtained from the outputs of the
317
GTs was reused in the HRSGs by heating the water into hot pressurized steam. This has increased
318
the efficiency of the system. In the established power generation system, these increase the efficient
319
values of each CCB. As a result, the minimum efficient value of CCB1 at 8° C was 43.3%, while this
320
value was 42.9% at 23°C. Whereas for CCB2 it was 43.3% and 42.5% for 8°C and 23°C, respectively.
321
The efficient of natural gas CCPP is also dependent on the efficient of GTs, STs and CCBs, being
322
consisted by them. The total system was calculated as 43.3% for 8°C and 42.7% for 23°C, depending
323
on the obtained temperature, depending on the obtained data. For the examined natural gas CCPP,
324
the efficient, which varies depending on the ambient temperature is shown at Figure 8.
325
326
327
Figure 8. Depending on the ambient temperature for the natural gas CCPP.
328
329
All of these results, depending on the temperature increase in the natural gas CCPP
330
productivity, the reason of reduction is interchange of the amount of oxygen inside the air entering
331
the combustion chamber. If the amount of fuel entering the low air temperature is injected into the
332
combustion reaction when the temperature of the incoming air is high, the reaction can’t be carried
333
out fully because the oxygen in the air entering the reaction is low. As a result, neither the desired
334
amount of energy is released nor the unburned fuel is discharged as waste in the combustion
335
reaction. This leads to an increase in the amount of natural gas used as input energy. In another
336
respect, hydrocarbons are formed out of combustion due to oxygen and the natural gas imbalance.
337
These situations increase both costs and reduce the efficiency.
338
Data were recorded with data acquisition cards (Data Acquisition Card - DAQ) from the
339
installation of this combined cycle power plant until nowadays. When the system was first installed,
340
it reached 240 MW at 8°C, which is the ideal operating temperature. The daily of electric power
341
generating is 227.7 MW maximum. The decline in the generating of this electric energy was due to
342
and thermal fatigue. Time dependent abrasion losses, occurring working under pressure in the
344
compression ratios in turbines also affect too. Moreover, the soot formed in the combustion
345
chambers, turbine blade abrasion, chilling in the cooling system and corrosive effects play an
346
important role in decreasing efficiency.
347
4. Conclusions
348
In this study, the changes in electric energy production of HABAŞ natural gas CCPP, which has
349
an installed capacity of 240 MW, depending on the temperature, were examined using real data
350
recorded for about fourteen years. Electricity energy generating at 8°C of natural gas CCPP was
351
227.7 MW, while electric energy generating at 23°C was calculated as 197.3 MW with a decrease of
352
30.4 MW. Depending on the seasonal temperature change, the efficient value was determined as
353
43.3% at 8°C and 42.7% at 23°C. At measurements made between 8-23°C; although the controllers in
354
the GTs are programmed to generate maximum power, the energy generating of the GTs is reduced
355
as the air temperature increases. These reductions are proportional to the amount of oxygen in the
356
air of the unit volume entering the combustion chamber. The temperature of the air entering the
357
combustion chamber decreases the amount of residual oxygen, which affects the combustion
358
response. Less burnout leads to less energy availability. Although the control systems of the GTs
359
attempt to protect the efficiency by controlling the fuel entering the combustion chamber, the
360
efficiency decreases as the ambient temperature increases in the GTs. To prevent production and
361
productivity loss, in areas where the temperature of the air is high and variable, to bring the highest
362
value of energy production and efficiency the inlet air temperature entering the combustion
363
chamber and to keep it fixed asset, special systems that only cool inlet air should be installed in
364
power plants.
365
366
Author Contributions: All authors provided the same contribution to this article.
367
Funding: This research received no external funding.
368
Acknowledgments: Authors gratefully acknowledge the support provided for this work by HABAŞ, Izmir,
369
Turkey and thanks to the Manager of the Plant Süleyman ELDEM for his kind contributions.
370
Conflicts of Interest: The authors declare no conflict of interest.
371
372
References
373
1. Abuelnuor, A.A.A.; Saqr, K.M.; Mohieldein, S.A.A.; Dafallah, K.A.; Abdullah, M.M.; Nogoud, Y.A.M.
374
Exergy analysis of Garri “2” 180 MW combined cycle power plant. Renewable and Sustainable Energy
375
Reviews, 2017, 79, 960-969, DOI: 10.1016/j.rser.2017.05.077
376
2. Kok, B.; Benli, H. Energy diversity and nuclear energy for sustainable development in Turkey. Renewable
377
Energy, 2017, 111, 870-877, DOI: 10.1016/j.renene.2017.05.001
378
3. Noroozian, A.; Mohammadi, A.; Bidi, M.; Ahmadi, M.H. Energy, exergy and economic analyses of a novel
379
system to recover waste heat and water in steam power plants. Energy Conversion and Management, 2017,
380
144, 351-360, DOI: 10.1016/j.enconman.2017.04.067
381
4. Kotowicz, J.; Brzęczek, M. Analysis of increasing efficiency of modern combined cycle power plant: A case
382
studies. Energy, 2018, 153, 90-99, DOI: 10.1016/j.energy.2018.04.030
383
5. Cihan, A.; Hacıhafızoğlu, O.; Kahveci, K. Energy–exergy analysis and modernization suggestions for a
384
combined-cycle power plant. International Journal of Energy Research, 2006, 30(2), 115-126, DOI:
385
10.1002/er.1133
386
6. Incekara, C.O.; Ogulata, S.N. Turkey’s energy planning considering global environmental concerns.
387
Ecological Engineering, 2017, 102, 589-595, DOI: 10.1016/j.ecoleng.2017.02.033
388
7. Jović, M.; Laković, M.; Banjac, M. Improving the energy efficiency of a 110 MW thermal power plant by
389
low-cost modification of the cooling system. Energy & Environment, 2018, 29(2), 245-259, DOI:
390
8. Blumberg, T.; Assar, M.; Morosuk, T.; Tsatsaronis, G. Comparative exergoeconomic evaluation of the latest
392
generation of combined-cycle power plants. Energy Conversion and Management, 2017, 153, 616-626, DOI:
393
10.1016/j.enconman.2017.10.036
394
9. Ersayin, E.; Ozgener, L. Performance analysis of combined cycle power plants: A case study. Renewable and
395
Sustainable Energy Reviews, 2015, 43, 832-842, DOI: 10.1016/j.rser.2014.11.082
396
10. Zhang, X.; Liu, J.; Tang, Y.; Zhao, X.; Yang, H.; Gerbens-Leenes, P.W.; Michelle, T.H. van Vliet; Yan, J.
397
China’s coal-fired power plants impose pressure on water resources. Journal of Cleaner Production, 2017,
398
161, DOI: 10.1016/j.jclepro.2017.04.040
399
11. Mohanty, D.K.; Venkatesh, V. Performance analysis of a combined cycle turbine under varying operation
400
condition. Mechanical Engineering: An International Journal (MEIJ), 2014, 1, (2), 11-25, DOI:
401
12. Meegahapola, L. Characterisation of gas turbine dynamics during frequency excursions in power
402
networks. IET Generation, Transmission & Distribution, 2014, 8(10), 1733-1743, DOI:
403
13. Ahmadi, G.R.; Toghraie, D. Energy and exergy analysis of Montazeri steam power plant in Iran. Renewable
404
and Sustainable Energy Reviews, 2016, 56, 454-463.
405
14. Xiang, Y.; Cai, L.; Guan, Y.; Liu, W.; Han, Y.; Liang, Y. Study on the configuration of bottom cycle in
406
natural gas combined cycle power plants integrated with oxy-fuel combustion. Applied Energy, 2018, 212,
407
465-477, DOI: 10.1016/j.apenergy.2017.12.049
408
15. Alobaid, F. Start-up improvement of a supplementary-fired large combined-cycle power plant. Journal of
409
Process Control, 2018, 64, 71-88, DOI: 10.1016/j.jprocont.2018.02.007
410
16. Pattanayak, L.; Sahu, J.N.; Mohanty, P. Combined cycle power plant performance evaluation using exergy
411
and energy analysis. Environmental Progress & Sustainable Energy, 2017, 36(4), 1180-1186, DOI: 10.1002/ep
412
17. Kaushik, S.C.; Reddy, V.S. ; Tyagi, S.K. Energy and exergy analyses of thermal power plants: A review.
413
Renewable and Sustainable Energy Reviews, 2011, 15(4), 1857-1872, DOI: 10.1016/j.rser.2010.12.007
414
18. Promes, E.J.O.; Woudstra, T.; Schoenmakers, L.; Oldenbroek, V.; Thattai, A.T.; Aravind, P.V.
415
Thermodynamic evaluation and experimental validation of 253 MW Integrated Coal Gasification
416
Combined Cycle power plant in Buggenum, Netherlands. Applied Energy, 2015, 155, 181-194, DOI:
417
10.1016/j.apenergy.2015.05.006
418
19. Ganjehkaviri, A.; Jaafar, M.M.; Ahmadi, P.; Barzegaravval, H. Modelling and optimization of combined
419
cycle power plant based on exergoeconomic and environmental analyses. Applied Thermal Engineering,
420
2014, 67(1-2), 566-578, DOI: 10.1016/j.applthermaleng.2014.03.018
421
20. Javadi, M.A., Ghomashi, H. Thermodynamics analysis and optimization of abadan combined cycle power
422
plant. Indian Journal of Science and Technology, 2016, 9(7) , DOI: 0.17485/ijst/2016/v9i7/87770
423
21. Almutairi, A.; Pilidis, P.; Al-Mutawa, N. Energetic and exergetic analysis of combined cycle power plant:
424
part-1 operation and performance. Energies, 2015, 8(12), 14118-14135, DOI: 10.3390/en81212418
425
22. Ameri, M.; Ahmadi, P.O.U.R.I.A.; Khanmohammadi, S.H.O.A.I.B. Exergy analysis of a 420 MW combined
426
cycle power plant. International Journal of Energy Research, 2008, 32(2), 175-183, DOI: 10.1002/er.1351
427
23. Tüfekci, P. Prediction of full load electrical power output of a base load operated combined cycle power
428
plant using machine learning methods. International Journal of Electrical Power & Energy Systems, 2014, 60,
429
126-140, DOI: 10.1016/j.ijepes.2014.02.027
430
24. Herraiz, L.; Fernández, E.S.; Palfi, E.; Lucquiaud, M. Selective exhaust gas recirculation in combined cycle
431
gas turbine power plants with post-combustion CO2 capture. International Journal of Greenhouse Gas Control,
432
2018, 71, 303-321, DOI: 10.1016/j.ijggc.2018.01.017
433
25. Sahin, A.Z.; Al-Sharafi, A.; Yilbas, B.S.; Khaliq, A. Overall performance assessment of a combined cycle
434
power plant: An exergo-economic analysis. Energy Conversion and Management, 2016, 116, 91-100, DOI:
435
10.1016/j.enconman.2016.02.079
436
26. Ganjehkaviri, A.; Jaafar, M.M.; Hosseini, S.E. Optimization and the effect of steam turbine outlet quality on
437
the output power of a combined cycle power plant. Energy Conversion and Management, 2015, 89, 231-243,
438
DOI: 10.1016/j.enconman.2014.09.042
439
27. Kilani, N.; Khir, T.; Brahim, A.B. Performance analysis of two combined cycle power plants with different
440
steam injection system design. International Journal of Hydrogen Energy, 2017, 42(17), 12856-12864. DOI:
441
10.1016/j.ijhydene.2017.01.233
442
28. Lee, J.H.; Kim, T.S.; Kim, E.H. Prediction of power generation capacity of a gas turbine combined cycle
443
29. Kim, M., Kim, D., Esfahani, I.J., Lee, S., Kim, M., Yoo, C. Performance assessment and system optimization
445
of a combined cycle power plant (CCPP) based on exergoeconomic and exergoenvironmental analyses.
446
Korean Journal of Chemical Engineering, 2017, 34(1), 6-19, DOI: 10.1007/s11814-016-0276-2
447
30. Hu, Y.; Ahn, H. Process integration of a Calcium-looping process with a natural gas combined cycle power
448
plant for CO2 capture and its improvement by exhaust gas recirculation. Applied Energy, 2017, 187, 480-488,
449
DOI: 10.1016/j.apenergy.2016.11.014
450
31. Amell, A.A.; Cadavid, F.J. Influence of the relative humidity on the air cooling thermal load in gas turbine
451
power plant. Applied Thermal Engineering, 2002, 22(13), 1529-1533.
452
32. De Sa, A.; Al Zubaidy, S. Gas turbine performance at varying ambient temperature. Applied Thermal
453
Engineering, 2011, 31(14-15), 2735-2739, DOI: 10.1016/j.applthermaleng.2011.04.045
454
33. Arrieta, F.R.P.; Lora, E.E.S. Influence of ambient temperature on combined-cycle power-plant
455
performance. Applied Energy, 2005, 80(3), 261-272, DOI: 10.1016/j.apenergy.2004.04.007
456