THE ECONOMICS OF
ADVERTISING: A Firm Level Study
DAVID JOHN BATON
UNIVERSITY COLLEGE LONDON
1997
ProQuest Number: 10045675
All rights reserved
INFORMATION TO ALL USERS
The quality of this reproduction is dependent upon the quality of the copy submitted.
In the unlikely event that the author did not send a complete manuscript and there are missing pages, these will be noted. Also, if material had to be removed,
a note will indicate the deletion.
uest.
ProQuest 10045675
Published by ProQuest LLC(2016). Copyright of the Dissertation is held by the Author.
All rights reserved.
This work is protected against unauthorized copying under Title 17, United States Code. Microform Edition © ProQuest LLC.
ProQuest LLC
789 East Eisenhower Parkway P.O. Box 1346
ABSTRACT
This thesis is concerned with the economic effects of advertising. Perhaps the most significant barrier to empirical work in the UK in this area is the lack of reliable, published data. Thus, at the heart of the thesis is a firm level questionnaire which provided advertising data on 325 large and medium-sized UK firms.
CONTENTS
List of tables 7
Acknowledgements 10
Declaration 11
C hapter 1 Introduction 12
1.1 Aims and methodology 12
1.2 Chapter outline 14
C hapter 2 Advertising and industrial organisation: an overview 17
2.1 Introduction 17
2.2 Persuasive advertising 18
2.3 Advertising and information 21
2.4 Welfare effects 26
2.4.1 Persuasive advertising and welfare 27
2.4.2 Informative advertising and welfare 30
2.4.3 Advertising as a complementary good 33
2.5 Empirical evidence 36
2.5.1 Barriers to entry and market concentration 36 2.5.2 Price sensitivity and absolute prices 39
2.5.3 Direct measurements of welfare 41
2.6 Conclusions 43
C hapter 3 Survey methodology and summ ary statistics 44
3.1 Introduction 44
3.2 The surveying process and response 46
3.2.1 Surveying process 46
3.2.2 Response by industry sector 47
3.2.3 Sample selection tests 49
3.3 Questionnaire responses 49
3.3.1 Which firms advertise and which do not? 50
3.3.2 Advertising levels 52
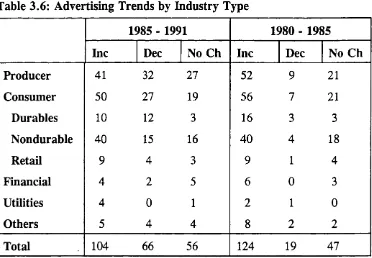
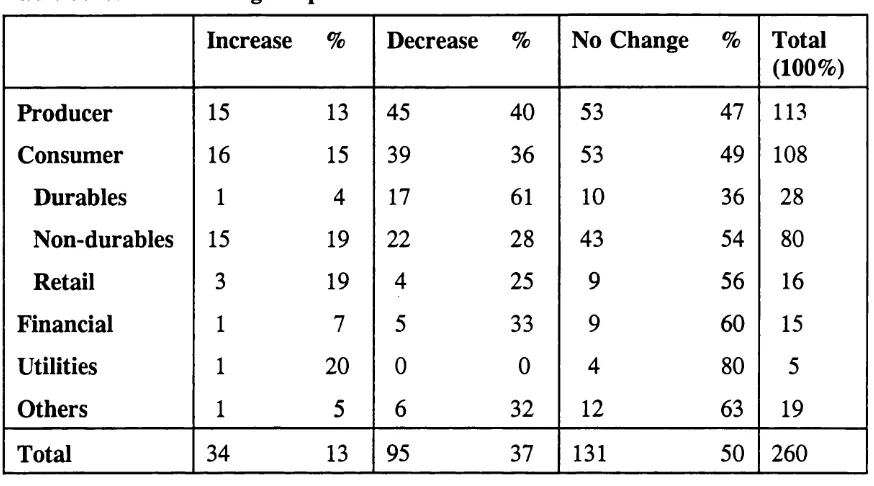
3.3.3 Trends in advertising 57
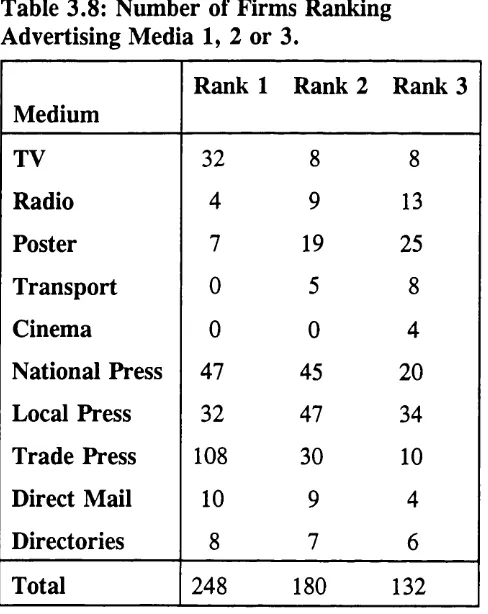
3.3.5 Different advertising media 59
3.3.6 Strategic advertising 59
3.4 Conclusions 64
Chapter 4 Explaining advertising intensities: an alternative approach
based on survey data 78
4.1 Introduction 78
4.2 Methodological issues 79
4.2.1 Treatment of non-advertisers 79
4.2.2 Cross-section versus panel data 80
4.2.3 Level of aggregation 80
4.2.4 Choice of dependent variable 81
4.3 Theoretical considerations: advertising and market structure 82
4.3.1 The inverse U-curve 85
4.3.2 Collusion over advertising 87
4.3.3 An alternative approach 88
4.4 Data and variables 89
4.4.1 Data 89
4.4.2 Variables 90
4.5. Results and interpretation 93
4.5.1 The advertising decision 93
4.5.2 Advertising intensity 96
4.5.3 Industry specific effects 98
4.5.4 Robustness experiments 100
4.5.5 Survey data versus published concentration data 101
4.6 Conclusion 103
Chapter 5 Advertising and profitability 114
5.1 Introduction 114
5.2 Data 117
5.3 Effect of advertising on profit margins 120
5.3.1 Basic model 120
5.3.2 Long run effects 123
5.3.3 Total advertising 124
5.3.4 Advertising as capital 125
5.3.5 Alternative measure of profit margins 128
5.4.1 Empirical model 129
5.4.2 Factors affecting exit 131
5.4.3 Empirical results 132
5.5 Conclusions 135
Chapter 6 Durability of advertising 150
6.1 Introduction 150
6.2 The sales and advertising relationship 153
6.3 Data and econometric specification 154
6.3.1 Data 154
6.3.2 Econometric specification 154
6.4 Estimation results 156
6.4.1 Basic model 156
6.4.2 Durability by industry 160
6.4.3 Durability by advertising media 161
6.4.4 Variation over time 162
6.4.5 Analysis of fixed effects 162
6.5 Conclusions 165
Chapter 7 Advertising, prices and information 176
7.1 Introduction 176
7.2 A model of price advertising 180
7.3 Testing the model 185
7.3.1 The data 185
7.3.2 Econometric specification 188
7.3.3 Estimates of the determinants of price advertising 191 7.3.4 Probability effects on price advertising 195
7.4 Conclusions 197
Chapter 8 Advertising strategies: rivals and cyclical behaviour 209
8.1 Introduction 209
8.2 Advertising and corporate behaviour 211
8.2.1 Advertising as a strategic variable 211 8.2.2 The cyclical behaviour of advertising strategies 214
8.4 Econometric models of advertising behaviour 219 8.4.1 The determinants of strategic advertising behaviour 219 8.4.2 Is advertising a strategic complement or substitute? 219 8.4.3 Asymmetries in the use of advertising as a strategic
variable 224
8.5 Econometric models of the determinants of cyclical advertising
behaviour 226
8.5.1 The determinants of cyclical advertising behaviour 226 8.5.2 Asymmetries in the cyclicality of advertising 228
8.6 Concluding remarks 230
C hapter 9 Conclusions 239
9.1 Summary of findings 239
9.2 Future work 243
Appendix 1 D ata description and sources 245
Appendix 2 Advertising and industry survey 266
Appendix 3 Respondents and non-respondents 269
C hapter 3
LIST OF TABLES
Table 3.1: Respondents by Industry Type 66
Table 3.2: Size Distribution of Respondents 67
Table 3.3: Comparison of Respondents and Non-respondents 68 Table 3.4: Advertising and Non-advertisers by Industry Type 69 Table 3.5a: Mean Level of Advertising: various measures 70
Table 3.5b: Correlation Between Advertising Measures 70
Table 3.6: Advertising Trends by Industry Type 71
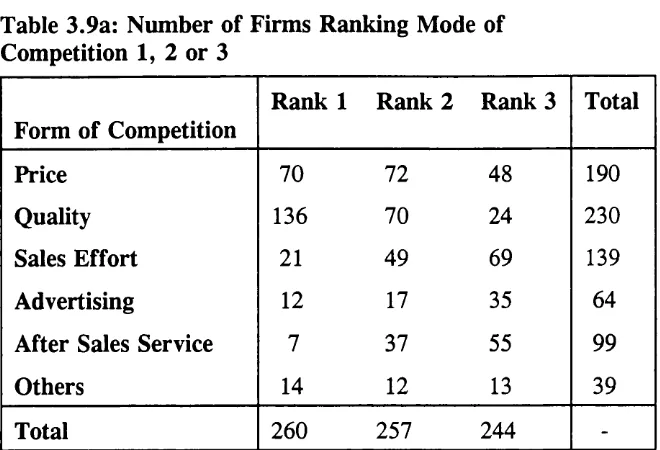
Table 3.7: Percentage of Advertisements Containing Price Information 72 Table 3.8: Number of Firms Ranking Advertising Media 1, 2 or 3. 73 Table 3.9a: Number of Firms Ranking Mode of Competition 1, 2 or 3 74 Table 3.9b: Advertising and Sales Effort as a Competitive Tool 74
Table 3.10a: Advertising Response to a Recession 75
Table 3.10b: Advertising Response to a Boom 75
Table 3.11a: Number of Competitors Faced by Firms 76
Table 3.11b: Number of Firms Dominating Advertising 76
Table 3.11c: Advertising Response if Competitors Decrease Advertising 77 Table 3 .lid : Advertising Response if Competitors Increase Advertising 77
C hapter 4
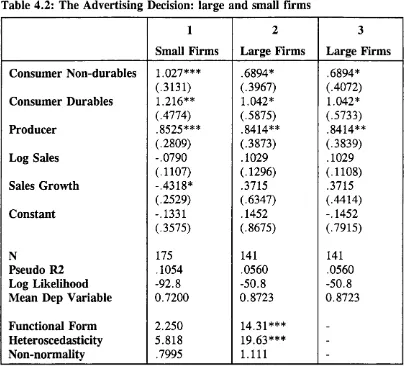
Table 4.1a: Determinants of the Advertising Decision (probit estimates) 105 Table 4.1b: Probability Effects (from Table 4.1 Col 3) 106 Table 4.2: The Advertising Decision: large and small firms 107
Table 4.3: OLS Estimates of Advertising Intensity 108
Table 4.4: OLS Estimates of Advertising Intensity (including industry
effects) 109
Table 4.5: Tobit Estimates of Advertising Intensity 110
Table 4.6: OLS Estimates of Advertising Intensity (excluding large/small
firms) 111
Table 4.7: OLS Estimates of Advertising Intensity (log specification) 112 Table 4.8: Explaining Advertising Intensity: concentration versus survey
data 113
C hapter 5 Table 5.1: Table 5.2 Table 5.3 Table 5.4
Raw Correlations between Advertising in 1992 and Profit Rates
in 1991-3 138
OLS Estimates of Determinants of Profit Rates in 1993 139 Determinants of Profit Rates: long run effects 140 Determinants of Profit Rates: advertising intensity versus total
Table 5.5a Table 5.5b Table 5.5c Table 5.6 Table 5.7 Table 5.8 Table 5.9 Table 5.10
Determinants of Profit Rates: X = 0.5 Determinants of Profit Rates: X = 0.7 Determinants of Profit Rates: X = 0.9 Determinants of Profit Rates (gross profits)
Raw Correlations between Firm Exit and Advertising Probit Estimates of Firm Exit I
Probit Estimates of Firm Exit II Increases in Probability of Exit
142 143 144 145 146 147 148 149
C hapter 6
Table 6.1 Mean Advertising and Sales by Year 167
Table 6.2 Long Run Effects of Advertising on Sales 168 Table 6.3 Long Run Effects of Advertising on Sales: IV estimation 169 Table 6.4 Long Run Effects of Advertising on Sales: robustness
experiments 170
Table 6.5 Long Run Effects by Industry 171
Table 6.6 Long Run Effects by Advertising Media 172
Table 6.7 Long Run Effects by Year 173
Table 6.8 OLS Analysis of Fixed Effects: basic model 174 Table 6.9 OLS Analysis of Fixed Effects: industry, media and year models 175
C hapter 7
Table 7.1 The Extent of Price Advertising 199
Table 7.2 Price Advertising by Type of Firm 200
Table 7.3 Price Advertising by Type of Product 201
Table 7.4 Ordered Probit Estimates of Price Information in Advertising (5
categories) 202
Table 7.5 Ordered Probit Estimates of Price Information in Advertising (4
categories) 204
Table 7.6 Probability Effects (basic model) 206
Table 7.7 Probability Effects (interaction terms) 207
Table 7.8 Probability Effect of More than Ten Competitors Across All
Regressions 208
C hapter 8 Table 8.1: Table 8.2: Table 8.3: Table 8.4: Table 8.5: Table 8.6:
Responses to Perceived Changes in Advertising by Competitors 233 Responses to Perceived Changes in Cyclical Conditions 233
Changes in Advertising Since 1985 234
Summary of Firm Responses 234
Probit Models of Perceived Responses to Rivals’ Changes in
Advertising 235
Behaviour 236 Table 8.7: Probit Models of Perceived Responses to Changes in Business
Cycle Conditions 237
Table 8.8: Testing for the Presence of Asymmetries in Advertising
Responses to Cyclical Conditions 238
Appendix 1 Table A l .l: Table A1.2: Table A1.3: Table A1.4: Table A1.5a: Table A1.5b: Table A1.6: Table A1.7:
Means of Variables Used in Chapter 4 258
Mean Advertising Intensity by Microexstat Industry Group 259 Mean Advertising Intensity by SIC 2-digit Industry (1980 UK
Definition) 260
Means of Variables Used in Chapter 5 261
Means of Variables Used in Chapter 6 (panel data analysis) 262 Means of Variables Used in Chapter 6 (analysis of fixed effects) 263
Means of Variables Used in Chapter 7 264
Means of Variables Used in Chapter 8 265
Appendix 3 Table A3.1: Table A3.2: Table A3.3:
Reasons Given for Not Responding 270
Breakdown of Respondents by Microexstat Industry Group 271 Breakdown of Respondents by SIC 2-digit Industry Group (1980
ACKNOWLEDGEMENTS
DECLARATION
1. A version o f Chapter 7 o f the thesis was presented at the 1996 Royal Economic Society Conference in Swansea.
2. Chapter 8 was undertaken as joint work with my supervisor, Stephen Machin. As such I contributed at least 50% to this chapter. A statement from Dr Machin
confirming this is given below.
I confirm the above declaration referring to joint work I have carried out with David Paton.
Chapter 1 INTRODUCTION
1.1 AIMS AND METHODOLOGY
This thesis is concerned with the economic effects of advertising. The dramatic increase in mass media advertising throughout this century has been accompanied by a growing body of research attempting to describe and analyze the impact which
advertising has both on individual firms and consumers and on the economy as a whole. Research in the latter area has typically focused on welfare effects of advertising (e.g. Galbraith 1958, Becker & Murphy 1993), together with some empirical work on the impact on aggregate consumption such as that of Peel (1975).
At the microeconomic level, thinking on advertising has moved on somewhat from the view which sees it as changing consumer tastes, acting as a barrier to entry and
consequently increasing the degree of monopoly power (e.g. Comanor & Wilson, 1967). Rather, the possibility that advertising may be a means of providing useful information has gained increasing acceptance. This may be direct information about a product or, as suggested by Nelson (1970, 1974), an indirect signal of the quality of the product. By providing consumers with information about a product’s existence, entry into a market can be eased. Information on prices and product characteristics may increase consumer sensitivity and reduce the degree of monopoly power.
the UK is the lack of reliable published data on advertising^ Thus, at the heart of the study is the use of a company level survey undertaken during the summer of 1992. This survey asked the Advertising Managers of a large number of medium and large sized UK firms a variety of questions on the level and nature of their company’s advertising. Useable data was obtained from a total of three hundred and twenty five firms.
The survey data is matched with a variety of accounting data available on the Microexstat and FAME databases^, covering variables such as profits, sales and assets. In addition industry level data is obtained from the Census of Production. The result is a totally unique database incorporating quantitative information on, for example, advertising levels, as well as information of a more qualitative nature, covering areas such as conjectural responses to the possible decisions of rival firms.
Clearly there are problems with using managers’ responses. Most obviously there is no guarantee that the questions were answered either carefully or accurately. On the other hand, they do provide very direct information which is unlikely to be available from published sources. In addition, the data allows for the empirical analysis of a variety of issues which would not otherwise be possible, in this country at least.
^The limited data which has been published in the UK is discussed in Chapter Three.
1.2 CHAPTER OUTLINE
The rest of the thesis is set out as follows.
Chapter Two sets the scene for the empirical part of the thesis by placing the work in the context of existing literature. A distinction is made between advertising used as persuasion and that which provides information. In particular, recent work showing how advertising can be used as a signal of quality is explained. Models which look at the implications of the nature of advertising for its effect on economic welfare are then discussed. The chapter concludes with a summary of empirical evidence on various questions related to advertising - its effect on barriers to entry, price, price sensitivity and direct measures of welfare.
The methodology of the survey is described in Chapter Three along with some summary statistics. Following a discussion of the problem of measuring advertising, responses are summarised across various sectors - producer goods, consumer non durables, consumer durables, retail, finance and utilities. Tests for sample selection bias are carried out and some initial conclusions are drawn from the descriptive data.
Chapter Four concentrates on two main issues. The first is an analysis of which firms advertise and which do not. As a result of data limitations, the advertising decision has been left virtually untouched by the existing empirical literature. Here, probit estimation is used to investigate what factors influence this decision.
rather more attention in the past. One long-running theme has been concerned with the link between advertising and market concentration, most notably the “inverse U- curve” relationship. In this chapter, it is demonstrated how survey data may be used to shed more light on this topic which has become something of a sterile debate in recent years. The survey data approach is shown to compare favourably with that relying on standard published data sources.
The core of the debate about the welfare effects of advertising has been the impact on firm performance and this is the focus of Chapter Five. If advertising has an anti competitive effect, then it should increase the monopoly profits of firms. The vast majority of studies have found just such a positive correlation at all levels of
aggregation (market, firm and product) in consumer industries. However, a positive correlation could also be explained both by a reverse direction of causation running from profitability to advertising and by a (possibly) false specification of advertising as a current expense rather than as an investment good. These issues are discussed in some detail and attempts are made to take account of them in an empirical analysis of firm profitability. Lastly, a novel way of surmounting the potential problem of two- way causation is suggested, using company failure as an absolute measure of
performance.
investment in intangible capital rather than as a current cost. In this case profit rates require an appropriate adjustment. The majority of the work on this question has involved the use of a Koyck transformation on the advertising sales relationship. Recently it has been suggested such results may be biased by unobservable firm specific effects, such as product quality. An approach taking account of these fixed effects is replicated here. However, it is shown that advertising may be a more important component of these fixed effects than quality.
Chapter Seven looks in some detail at the advertising of prices. Several recent studies have analyzed the effects of price advertising and, in particular, the possibility that such advertising may signal quality information. To date, however, there has been no work looking at the decision by firms of how much price advertising to undertake. In this chapter, a simple model of this decision is developed, taking account of consumer search behaviour. The model is then tested against data collected from the survey using ordered probit estimation.
Some of the more interesting recent empirical work has focused on the strategic use of advertising, and, in particular, the responses to changes in rivals’ strategies. Chapter Eight develops such work in two ways - firstly, by analysing the stated reaction of firms to changes in their rivals’ advertising and secondly by considering the stated response of firms to changes in business conditions.
Chapter 2
ADVERTISING AND INDUSTRIAL ORGANISATION: an overview
2.1 INTRODUCTION
The analysis of advertising is of crucial importance to industrial organisation for several reasons. In the first place, there is the increasing attention which has been paid over recent years to the role of information in the competitive process. The potential for advertising to assist consumers in making the choices they want, or, alternatively, to influence consumers to make the choices firms would like them to make, has provided one of the main focuses of debate in the advertising literature.
Secondly, many authors have investigated the scope for firms to use advertising to shape the economic environment which they face. Examples are the work on advertising and barriers to entry and also on the nature of strategic interactions between firms operating in oligopolistic markets.
Thirdly, the level of spending by firms on advertising is such that the advertising decision has appeared worthy of study in its own right. Such studies have
concentrated on the determinants of the level of advertising undertaken by firms and the reasons behind differences in advertising levels across industries and product groups.
presented in order to put into context the empirical study presented later in the
dissertation. In the next two sections, the potential for advertising to affect consumers preferences and its role in providing useful information will be discussed. The
implications for economic welfare will then be drawn out. In the final section of this chapter, an introduction to important empirical work in each area will be given.
2.2 PERSUASIVE ADVERTISING
Early work such as Kaldor (1949) and Bain (1968) emphasised the potential for
advertising to give a monopolistic advantage to firms. The main mechanisms whereby this might occur are through the manipulation of consumer tastes, in particular the creation of perceived differences between products and, also, through the erection of barriers to entry into the market.
If consumers’ preferences are altered by advertising, the price elasticity of the favoured good may be reduced. Cross-elasticity with close substitutes may also be lowered. In both cases, there is the potential of a higher markup of price over marginal cost and, consequently, increased allocative inefficiency.
sunk cost which is irrecoverable on exit will influence the effectiveness of the barrier to entry.
Another potential source of barriers to entry is in economies of scale in advertising itself. Schmalensee (1972) concludes that there is little evidence of economies of scale in terms of discounts for large advertisers, at least on television. There is rather more evidence of the existence of both a ‘threshold effect’ (Lambin, 1976; Albion & Farris, 1981), whereby advertising only begins to have an affect once a certain number of messages have been received, and technical economies (Peles, 1971; Brown, 1978). The latter arise from media such as television which require a very large outlay to advertise at all. Clearly both these factors disadvantage small entrants to a market.
Of course, there is no theoretical reason why a new firm cannot introduce new brands or spend money on building up customer loyalty, if necessary financed by credit. For advertising economies of scale to work as an effective barrier to entry requires other conditions such as capital market imperfections or a first-mover advantage.
perceived as a ‘fat-cat’ strategy (Lyons, 1989) in which the potential newcomer predicts an accommodating post-entry response and entry becomes more likely.
Bagwell and Ramey (1988) derive conditions under which advertising will be used by incumbent firms as a signal of absolute cost advantages to put off potential entrants from the market. In their model, the incumbent’s costs may be high (H) or low (L), but they are unknown to the potential entrant. The latter makes the entry decision on the basis of the incumbent’s observed price (P) and advertising (A) levels in the first period. In the first period, profits are denoted by 7Th(P,A) and 7Tl(P,A) for a high and low cost incumbent respectively. If entry occurs, the two firms share duopoly profits in the second period. Otherwise, the incumbent earns monopoly profits.
It is assumed that the duopoly profits accruing to the entrant would cover its fixed costs of entry (F) if the incumbent has high costs, but not if it has low costs:
^ > 0 > - f (2.1)
A low cost incumbent attempts to set price and advertising levels which would not be worthwhile to a high cost firm. For an equilibrium in which entry is impeded, there must be a price and advertising combination for a low-cost incumbent which would not be imitated by a high cost firm. In addition, the return from signalling that a firm is low-cost must be greater than that achieved by making monopoly profits in the first period and allowing entry.
~ ^ H A ^ ^'^ H D (2-2)
7r(-Pjrj, A ^ ) + àiTj^iPjj^, AjjJ) > t^i{Pjj4i A ^ + à'Kjj^ (2.3)
where 6 is the rate at which period 2 profits are discounted, subscript S represents signalling prices and advertising, subscript M represents monopoly prices and advertising, subscript D represents duopoly profits made in period 2.
If the profit maximising choices of price and advertising for a low-cost incumbent satisfy both (2.2) and (2.3), then profit maximisation will successfully deter entry. Otherwise, the firm may attempt to signal the fact that it has low costs. Bagwell and Ramey show that advertising will only be used as a signal if it also shifts the demand curve for the firm. In this case, the firm sacrifices profits in order to choose a (lower) price and (higher) advertising combination that suggests lower costs than it actually has.
2.3 ADVERTISING AND INFORMATION
Contrasting with this view of advertising as a persuasive mechanism is one which sees advertising as a way of providing consumers with useful information about the
existence and location of both products and firms.
goods are characterised by subjective or intangible qualities which can only be ascertained by purchasing and consuming that good.
In the case of the latter, advertising is one way in which useful information about seller location, product price and quality can be provided. In Stigler’s seminal article (Stigler, 1961) the equilibrium level of consumer search is determined by the marginal cost and benefit of that search. Advertising for goods which are characterised by a larger amount of consumer search is likely to be restricted to factual information. For experience goods where search is less useful, advertising is more likely to be
persuasive.
Nelson (1974) suggests that advertising may be informative even in the case of experience goods. Essentially, the argument is as follows. High quality goods are more likely to be advertised than goods of low quality as producers of the former expect first time purchasers to be satisfied and to make repeat purchases. Realising this, consumers may perceive heavy advertising as being a signal of the firm’s commitment to attracting repeat customers and thus as a signal of quality.
This idea has been formalised by, amongst others^, Milgrom and Roberts (1986) who consider a strict experience good. In other words, consumers only realise the quality of the good after purchase. The product quality is low with probability L and high with probability H, where 0 < L < 1 and L + H = 1. Consumers are prepared to
pay more for goods which they believe to be of high quality. The only role of advertising is to signal to consumers which goods are of high quality.
The firm’s pay off is determined by the price, the product quality and consumers beliefs about the product quality. In particular, ir(P,L,L) is the pre-advertising profit for a firm whose product is both low quality and believed by consumers to be low quality, 7t(P,L,H) is the profit for a firm whose product is low quality but believed by consumers to be of high quality and so on. In each case, there is a price that will maximise the payoff given by P^L, Plh so on.
Clearly there may be an incentive for a low quality firm to suggest to consumers that it is high quality. Consequently, true high quality firms have an incentive to choose a price and advertising combination that would be unprofitable for a low quality firm. If consumers have sufficient information to identify unprofitable combinations for low quality firms, then price and advertising combinations can signal product quality successfully.
Let expenditure on advertising be denoted by A. The payoff for a high quality firm who successfully uses advertising to persuade consumers that its product is of high quality is given by 7t(P,H,H) - A. If the firm does not advertise, the worst that can
happen is that consumers mistakenly believe that the good is of low quality and the payoff will be 7t(Phl,H,L). A necessary condition for advertising is that P and A can
■k(P,H ,H ) - A > t(P ^ ,H ,L ) (2.4)
Similarly, a low quality firm using advertising to persuade consumers (wrongly) that it is high quality receives a payoff of 7t(P,L,H) - A. Again, the worst scenario for this firm if it does not advertise is that consumers correctly believe that its product is of low quality. In this case the payoff will be 7t(Pll,L,L)- The firm will not be prepared to advertise if there is no choice of P and A for which:
7r(P^,L,L) > 7 t(P ,L ,^ - A (2.5)
(2.4) and (2.5) can be combined into one condition under which high quality firms will choose a price and advertising combination that low quality firms will not want to copy:
- Tr(Pj^,H,L) > A > tt(P ,L,H ) - tt(P ^,L ,L ) (2.6)
If this condition is met, a high quality firm maximises its profits subject to the constraint that it has revealed the quality of its product. That is:
tt(P,H ,H ) - A subject to t^P ,L ,H ) - A < Tr(P^,L,L) ^2J) P,A > 0
As long as A > 0, the equilibrium occurs where the first constraint is just satisfied. The reason is that, if the profits to the low quality firm are greater without
advertising, it is always worth the high quality firm reducing advertising slightly and gaining more profit. This implies:
A = tt{P,L,H) - 7r(P^,L,L) > 0 (2.8)
- t(P,L,H) subject to > 0
(
2.
9)
and P > 0
The isoprofit curve for the high quality firm at profit level m is given by ?r(P,H,H) - Ca-A = m. That for the low quality firm at profit level n is given by: tt (P,L,H) - Ca-A = n. The solution to the maximisation problem is at d7r(P,H,H)/3P =
Ô7t(P,L,H )/5P- That is, where the two isoprofit lines are at a point of tangency.
There may be a signalling equilibrium that involves no advertising or there may be a combined signal involving both price and advertising. Milgrom and Roberts show that this equilibrium can occur either at Phh > Plh or at Phh < Plh- In other words, the price may be lower or higher than the high quality firm would choose in the absence of any need for signalling. When there is a need, then signalling through price and advertising is cheaper than that via price alone. If advertising were to be banned, prices will rise for consumers, whilst profits will fall for H and be unchanged for L - a pareto-worsening effect (p.813).
Horstmann and MacDonald (1994) argue that Milgrom/Roberts type models are deficient in several ways. In particular, they focus on the implicit assumption that
“consumers’ experience plays no independent role in shaping subsequent consumption behaviour” (p.562). They argue that, under this assumption, there is no need for advertising after the initial period when the product is introduced. Further, the payoff to high quality firms who advertise must be equal in equilibrium to those of low- quality, non advertising firms (p.563). However both these conclusions are at odds with empirical evidence such as the well-established, positive correlation between advertising and firm profitability (see Chapter Five below). In Horstmann and MacDonald’s alternative model, advertising is not able to signal the quality of new products at all. It may provide some information about the quality of established goods but the signal will be imperfect leaving some consumer uncertainty.
2.4 WELFARE EFFECTS OF ADVERTISING
Work into the welfare effects of advertising can be differentiated firstly according to whether advertising is seen as informative or persuasive and secondly according to the theoretical setting for the advertising decision. Dixit and Norman (1978) look at persuasive advertising using a representative consumer approach. Grossman and Shapiro (1984) consider informative advertising using a product characteristics approach based on Lancaster (1966) and Salop (1979). In an interesting recent development, Becker and Murphy (1993) take the view that non-informative
welfare and are considered in more detail in turn.
2.4.1 Persuasive Advertising and Welfare
Dixit and Norman (1978) treat advertising as shifting the social welfare function which is denoted as:
U{m,q,A) = m + u{q,A) (2.10)
where q is the quantity produced of a good that is advertised by amount A. m is the quantity consumed of all other (non advertised) goods.
There are two constraints to maximising this utility function. The first is that the value of the inputs used to produce all goods, including advertising, is equal to the total resources in the economy. Formally, if the price of goods m are normalised, then:
m + F + c.q + c^.A = R (2.11)
where c^ is the unit advertising cost. F is the fixed costs of producing q. c is the constant marginal cost. R are total resources in the economy.
The second constraint is that expenditure by consumers just equals income. If the price of the advertised good is given by P, then,
m + P.q = R (2.12)
'K{q,A) = [P{q,A) - c].q - F - c^.A (2.13)
If advertising is fixed at a level A, the profit maximising output, q*(A), can be derived. The welfare of society, W, is given by the level of utility provided to society by the choices of A and q*:
W (q*(A),A) = U (m,q*(A),A) = m + u(q*(A),A)
= R - cq*(A) - F - Ca + u(q*(A),A) Substituting in the profit function, this becomes:
W = u[q'(A),A] - p l q ' ( A ) , A ] . q ' ( A ) + ■K{q'(A),A-\ * R (2.14)
The problem with using this welfare function to measure changes in A are that A itself changes the social welfare function we are measuring against. To get around this, Dixit and Norman fix the level of advertising in the utility function at a level Aj. The utility function is now treated as constant and the effect of small changes in advertising can be measured.
Differentiating with respect to A gives:
+ a '(A) ^ 6i![q'(A),A]
dA 6A
^ = - q ' . É Z (2.16)
&A ^ dA
The effect of advertising on welfare depends, therefore, on its effect on price. If advertising causes the price to go up, then a reduction in advertising would be welfare improving. In the case of a monopolist considered here, advertising can shift the demand curve out and increase price. This is Dixit and Norman’s key result: in the presence of market power, the equilibrium level of advertising is excessive from a social welfare point of view. They show this to be the case whether welfare is measured using pre- or post-advertising tastes.
The result has been subject to several attacks. Fisher and McGowan (1979) argue that Dixit and Norman do not take into account advertising that enters into the utility function. In their example, an advertisement for cognac may increase the enjoyment of the product by associating it with high status. Thus advertising can increase the utility gained from consumption of a good.
deal of debate and is discussed below"^.
2.4.2 Informative Advertising and Welfare
Butters (1977) was one of the first to consider the welfare effects of informative advertising, concluding that under monopolistic competition, advertising is at a socially optimal level. Several authors have drawn on the approach of Butters, for example, Stahl (1994) and Grossman and Shapiro (1984). Here I will concentrate on the latter who look at welfare effects in the context of a product differentiation model. There are n firms producing heterogeneous products. Different customers prefer different product characteristics and advertisements play a role in providing information on variations between products. Benefits can accrue to society from better matching of products to consumers.
In the Grossman and Shapiro model, there is a circle of product characteristics. Each consumer has a preferred point on this circle which gives them a value, v.
Consumers are distributed uniformly at a density of 6 per unit length. A product which is located a distance of z away from v provides a value of (v - tz) where t is the transport cost per unit distance, t can be thought of as the sensitivity of
consumers to product characteristics which are different to that desired.
Consumer surplus is given by (v - tz - P), where P is the price of the product. Consumers are assumed to select the product which yields the biggest surplus.
Consumers may be aware of which products exist, but they do not know where each product is on the product circle. Search is prohibitively expensive, leaving advertising as the only way of finding out product information.
Advertising is assumed to be truthful and its cost is defined as A = A(0,ô), where 0 is the distance the advertisement is sent (0 < </> < 1). </> can be thought of as the probability any consumer receives an advertisement.
The socially optimal level of advertising is that which maximises welfare (W), defined as the sum of consumer and producer surplus:
W = {P - c + V - tz - P)b[\ - (1 - (l))Y - n.F - n.bA{(^)
where c is the variable cost of production.
[1 - (1 - <^)"] is the proportion of customers reached by advertisements. n.F are the fixed costs of production.
n.ô.A(0) is the cost of advertising.
If total transport costs are denoted by T, equation (2.17) reduces to:
W = ( V - c).6.[l - (1 - <!>)"] - n.F - n.S.A{(j>) - T (2.18)
Thus monopolists will provide too little advertising.
When there is more than one firm, there are two additional and opposing considerations. Firstly there is an external benefit of improved matching which accrues to a consumer who receives an advert from a second firm^. Secondly, there is a counteracting tendency towards over provision which occurs as firms do not take account of lower profits in the rival firms from which they have attracted customers - the “customer capture effect” (Grossman and Shapiro, 1984, p .75).
By comparing the socially optimal level of advertising with the equilibrium level, Grossman and Shapiro find that, in an oligopoly situation, the matching effect is outweighed by the capture effect. In other words, advertising is excessive when there are a sufficiently large number of firms.
Clearly there can be a thin line between information and persuasion. For example, Nagler (1993) shows that in the absence of perfect information, firms may have an incentive to advertise deceptively. The beneficial Grossman-Shapiro type welfare effects will not follow if consumers display “cognitive dissonance” . That is, they convince themselves that purchasing the good in question was not a mistake in order to save face.
2.4.3 Advertising as a Complementary Good
Becker and Murphy (1993) draw out some problems with the signalling view of advertising presented by authors such as Milgrom & Roberts (1986). They argue that, taken literally, advertisements which signal information do not need to be seen - people simply need to know that they exist. Thus as long as firms’ advertising expenditure is broadcast (which it generally is not), consumers will be able to distinguish quality.
Further, consumers are willing to pay for some advertisements: directly in the case of some print advertisements (such as “Free Ad” papers) and indirectly where the
advertisement is sold jointly with other content of newspapers or magazines. However some advertisements (e.g. posters, television and radio) are quite clearly given away or ‘sold’ at a negative price. This suggests that such advertisements lower consumer’s utility which is difficult to reconcile with the information view. Becker and Murphy suggest that casual observation provides evidence of advertisements campaigns (such as those for chewing gum, cereal, beer and cola) which are not associated with the provision of any sort of information.
Formally they consider two goods, x and y. The former is subject to a quantity of advertising, A. Utility is given by:
U = U(x,y,A) (2 19)
where an increase in A is assumed to increase the marginal utility of x.
They do not make the usual assumption that producers give away a limited number of advertisements for free, arguing that in the case of newspapers, for example,
advertisements are “not rationed” and are subject to an implicit price which “is measured by the difference between the actual cost of newspapers to consumers and what it would be if papers did not have the ads.” (p.946). This implicit price may be negative, suggesting that advertising is a ‘bad’ for which consumers need
compensating. When there is a negative price, producers clearly do have an incentive to ration the number of advertisements that consumers ‘buy’.
Becker & Murphy measure total welfare (W) in the standard way as the sum of producer surplus ( t t ) and consumer surplus (S):
W = Tr(A,P^,R) + S(A,P^,R) (2.20)
where is the price of good x and R is the revenue from selling A.
Differentiating with respect to A gives:
TTp^ = x; ttr = 1; S r = -1; Sp, = -x.
Also:
ir^ = ( f , - -
mc^
(2.22)where mc^ is the marginal cost of good x and mc^ is the marginal cost of advertising.
Equation (2.21) now reduces to:
g = ( f , - m c ) . ^ - me, + S, (2.23)
Advertising is excessive (insufficient) if a small increase reduces (increases) welfare. As under profit maximisation, dvr/dA = 0, the condition for excessive advertising is:
S, - Z . 5 - ^ < 0 (2.24)
* dA dA
Advertising is insufficient if:
S, - ^ > 0 (2.25)
^ dA dA
such as those on television and radio, are more likely to reduce utility than print advertisements.
2.5 EMPIRICAL EVIDENCE
Empirical tests on the effects of advertising have tended to look at intermediate signals of welfare such as entry, price elasticity and prices rather than attempting direct estimates of welfare changes. A summary of work in each area now follows.
2.5.1 Barriers To Entry and Market Concentration
There is a wide range of studies providing evidence of advertising both as a barrier to, and facilitator of, entry. Rosenbaum and Lamort (1992) investigate entry in 4- digit US manufacturing industries over two separate time periods and find that “markets with advertising to sales ratios have significantly lower entry rates than markets with low advertising to sales ratios” (p.303), a conclusion backed up by Rizzo and Zeckhauser (1990) in the context of the medical profession.
On the other hand, Kessides (1986) finds that although advertising acts as a sunk cost and increases the risks of entering markets, there is an opposing tendency for potential entrants to perceive there to be a greater likelihood of success in markets where advertising is important. Overall he concludes that entry into most US manufacturing industries has been aided by advertising. Geroski and Murfin (1991) reveal a
In another approach, Cubbin and Domberger (1988) find evidence amongst consumer firms in the UK of a strong advertising response to entry by dominant firms. An advertising strategy to deter entry was most commonly found in static industries where other barriers to entry are already present. This is backed up by evidence from the US breakfast cereal market given by Thomas (1996) that managers credibly invest in advertising as a sunk cost with the intention of deterring entry.
Sutton (1991) presents a detailed investigation of entry conditions in twenty food and drinks industries. In industries in which advertising competition is important,
concentration is lower bounded as market size increases, whereas no such bound exists where advertising is not important. Advertising is seen as having an effect in restricting entry as an endogenous factor rather than as the exogenous barrier to entry of traditional structure-conduct-performance models.
Sutton’s results are largely backed up by Robinson and Chang’s (1996) study of a wider variety of both producer and consumer markets. They find that the lower bound for concentration is lowest in markets where advertising is not important and
“in relatively large markets, entry is effectively blockaded” (p.390).
provided by, amongst others, Cowling et. al. (1975) and Mueller and Rogers (1980)^.
There have been few negative associations found, suggesting a lack of evidence for the view that advertising aids entry into markets. A recent exception is the study by Sass and Saurman (1995) who find that small brewers in the USA are significantly disadvantaged by advertising restrictions compared to larger brewers.
The problem with such studies is that there are strong theoretical grounds for causality going the other way. That is, high market concentration may lead to high advertising intensity^. In turn this means single equation models may be subject to a bias. The use of simultaneous equation techniques may get around this problem and Comanor and Wilson (1974), Strickland and Weiss (1978), Geroski (1982), Uri (1987) and Rosenbaum (1993) are among those who employ such methods and still find a significant effect for advertising on market structure. Martin (1986), on the other hand, finds no significant effect.
An important issue in such studies is the question of identification. Schmalensee (1989, p .953-6) suggests that it is questionable whether any structure-conduct- performance equation systems are truly identified. To see this, consider a system k endogenous variables. For an equation within the system to be identified, there must be at least k exogenous variables that can be excluded from the equation on theoretical grounds and used as instrumental variables. In the long run, all structural variables
'’M ueller and Rogers find a positive effect only for television advertising.
(such as concentration) are affected in some way by conduct and/or performance variables (such as business strategy). Thus no variables are truly exogenous in the long run and there are no theoretically valid instruments.*
2.5.2 Price Sensitivity and Absolute Prices
There is somewhat more agreement on the impact on price sensitivity. Several authors (Comanor and Wilson, 1974; Lambin, 1976; Pagoulatis and Sorenson, 1986) have found that advertising significantly reduces price elasticity in manufacturing industries. In distribution industries, the effect seems to be reversed (Eskin, 1975; Wittink, 1977). This accords with casual observation. For example, print
advertisements by supermarkets in particular tend to be concerned with price comparisons. An exception is given by Shankar and Krishnamurthi (1996). They find that intensive advertising by those retailers who follow an “every day low
pricing” policy (p.250) is associated with lower price elasticity. A further distinction based on firms facing a strong or weak competitive reaction from rivals is made by Kim (1996). Only in the case of the former is there a positive effect of advertising on price sensitivity.
A line of research that is attractive both intuitively and theoretically is to look at the effect of advertising on price. The seminal study in this vein is that by Benham (1972) who found that spectacles were significantly cheaper in states in the USA where advertising was allowed compare to those states in which it was banned. This result has been confirmed by Kwoka (1984) in the USA, by The Office of Fair
Trading (1982) in the UK and, for the legal profession in the USA, by Cox, Deserpa and Canby (1982). Eckard (1987) looks at a range of US industries and finds that prices in those industries characterised by heavy television advertising fell between
1963 and 1977 relative to others.
Contrasting results are found by the Rizzo and Zeckhauser (1992) study of doctors in the USA. Their explanation is that doctors advertise in order to attract premium patients. The result is both higher quality and prices, but lower equilibrium output. There is both casual and hard evidence (see, for example, Connor and Peterson, 1992; Nickell and Metcalf, 1978) that heavily advertised brands attract a premium over rivals. However, this does not necessarily imply a simple effect on welfare as there may be a quality premium, whether real or perceived on advertised branded goods. For example, Wiggins and Raboy (1996) find that price premia for brand names in the market for bananas are largely due to real quality differences rather than subjective product differentiation. However, their study focuses on sales to large supermarkets rather than to final consumers and advertising is concentrated in the trade press. As argued below, it is in precisely such circumstances that advertising is likely to be informative rather than persuasive.
A useful summary of work in the area is provided in a survey article by Kaul and Wittink (1995). They conclude that price advertising leads to both lower prices and higher price sensitivity, whilst non-price advertising causes lower price sensitivity. To give one exam ple, Popkowski and Rao (1990) find that advertising at the local
elasticity, whilst that at the national level has the opposite effect. The specific issue of price advertising is explored in more detail in Chapter Seven.
Although plausible, a negative association between advertising and prices is not conclusive evidence in favour of advertising improving welfare. Lai and Matutes (1994) argue that supermarkets may advertise loss-leaders in order to entice
consumers into the store. Profit margins are then made up on more expensive goods that are not advertised. In a similar vein, the above evidence that advertising
increases price sensitivity in the short run in distribution is consistent with a longer run effect of decreased price sensitivity as consumers become loyal to one chain of shops. Indeed, the distinction between short and long run price effects would seem to be an avenue worthy of future research.
Clearly both barriers to entry and price effects will impact on firm profitability. A detailed discussion of the theoretical and empirical evidence in this area is left until Chapter Five. However, Schmalensee (1989) concludes that the majority of studies in this area have found a positive correlation between profitability and advertising (at industry level at least) in the consumer goods sector.
2.5.3 Direct Measurements of Welfare
fairly standard consumer welfare model they estimate the effect of advertising on consumer, producer and total surplus under the three different scenarios. They find that advertising has a strictly negative effect on total welfare if it is either purely persuasive or purely informative, with estimates ranging from a 1.6 to 4.3 cents decrease in welfare per adult per year arising from a 1% increase in advertising. In the case of image creation advertising, welfare increases by between 43 and 45 cents per adult per year. None of these estimates, however, are significantly different from zero. When the health effects of increased smoking are taken into account, the
negative effects of informative and persuasive advertising views are reinforced and the positive effects found on the image creation view are nearly all wiped out.
Mitra and Lynch (1995, 1996) employ experimental evidence to analyze advertising effects on welfare. Their method is to expose groups of marketing students to different levels of advertising and then to study their consumption behaviour. They find that price sensitivity is reduced and prices are higher when advertising manages to differentiate between brands and in purchasing situations in which it is not essential to recall brand names. On the other hand when brand name recall is important, advertising increases the set of choices available to consumers and prices are reduced. Even when it leads to higher prices, advertising can increase consumer welfare if it enables consumers to be matched more closely to their preferred brands.
Caves and Greene (1996) take a different approach, using rankings by consum er
organisations to rank brands according to quality, and then investigating the
context of easily verifiable quality attributes. There seems to be no evidence of advertising signalling quality in the way envisaged by Milgrom and Roberts (1986) and discussed above.
2.6 CONCLUSIONS
Researchers have taken a wide range of approaches in trying to judge the effects of advertising. Structural features such as market concentration and entry barriers have attracted a good deal of attention with contradictory conclusions. Perhaps the simplest and most appealing approach as far as policy makers are concerned is to focus directly on the effect of advertising on price. There is strong, but not conclusive, evidence both that advertising does reduce prices in the professions and that heavily advertised consumer goods are priced at a premium. On the other hand evidence of a correlation between advertising and quality has not yet been forthcoming.
Chapter 3
SURVEY METHODOLOGY AND SUMMARY STATISTICS
3.1 INTRODUCTION
This chapter provides a statistical overview of a firm level questionnaire survey, carried out in the summer of 1992. In addition to an introduction to the questionnaire and the survey process, it gives a broad summary of the data collected, concentrating on differences between industry groupings.
UK data on advertising is notoriously poor. The only regular source of information on advertising expenditure in the UK (published by MEAL - Media Expenditure Analysis Limited) is at brand level. Uniquely, the 1968 Census of Production reported advertising expenditure by Minimum List Heading three digit industry. UK industry studies have continued to use this 1968 data ever since (see for example, Geroski and Pomroy, 1990)^. The Campaign Report aggregates the MEAL data to the firm level for its annual list of the 100 top advertisers and it is also incorporated into Advertising Association Annual Statistics series. Unlike in the US^®, there is no comprehensive, primary source of firm level advertising data in the UK and, in essence, this is the prime motivation for this survey. The explosion of theoretical models of advertising in recent years has been ill-served by the amount of empirical
^Dowrick (1990) uses “other non-industrial costs” from the Census of Production Summary Volume as a proxy for advertising at the SIC 3-digit level for manufacturing industries.
work in this country at least.
Further, much of the recent theory has concentrated on the strategic use of
advertising:- interactions between firms, entry deterrence, competitive strategies etc. Whatever the standard of published statistics, surveys provide one of the few ways of getting hold of the fairly specific information which is needed to test such theories. Smiley (1988) and Singh, Utton and Waterson (1991) both describe surveys aimed at eliciting information on more general strategic actions by firms. To date, there has been no attempt to undertake a similar survey concentrating on advertising.
The validity of responses to questionnaires such as this is, of course, open to question. There is no guarantee that questions will be answered either accurately or truthfully. On the other hand, at best they do give an idea of managers’ own perceptions (as opposed to the interpretation of a researcher) of their advertising behaviour.
The rest of the chapter is set out as follows. Section 3.2 outlines the surveying process and gives information on response rates. In addition some tests for sample selection bias are reported. Section 3.3 places the survey questions in the context of basic advertising theory and reports descriptive statistics of the replies. Information gained from the questionnaire can be thought of as lying within two broad areas. Firstly, there are those answers which provide mainly descriptive data, for example advertising levels and media trends over time. These are discussed in sections 3.3.1 to 3.3.5. Secondly, there are answers which provide information on the strategic use
set of responses is covered in Section 3.3.6. Lastly, some concluding remarks are made in section 3.4.
3.2 THE SURVEYING PROCESS AND RESPONSE 3.2.1 Surveying Process
A pilot sample of 25 companies, taken from the Microexstat data base of companies, were sent a three page questionnaire in March 1992. Questions covered the nature and scale of the company’s advertising, the nature of competition as well as
conjectural questions asking about firms’ strategic responses to various scenarios. This produced 6 responses and resulted in minor changes to the questionnaire being made. A copy of the final questionnaire is provided in Appendix 2.
In the last two weeks of May 1992, a further 1307 companies were sent the revised questionnaire, making a total of 1332 in all.’’ Letters were addressed to “The Advertising Manager” and the firm was asked to send back the form if they “felt unable to take part in the survey” . In addition, firms were assured that responses would be kept strictly confidential. Questionnaires were marked with an exclusive code matching each firm and in virtually no cases did a responding firm make an attempt to erase this code^^.
Useful replies were received from a further 178 companies. One hundred and six
'^These companies comprised all those on the Microexstat database for which current addresses were held.
companies either returned uncompleted questionnaires, or sent a letter explaining why they had not taken part in the survey. In addition, 20 questionnaires were returned with an indication that the company was no longer operating. Excluding these 20 companies, the useful response rate was 13.8%.
In the first two weeks of July, a follow up letter, together with another copy of the questionnaire, was sent to the 1024 firms who had not yet responded.
This second mailing produced 141 valid responses, together with 84 uncompleted forms or letters of explanation. A further 14 forms were returned due to the company no longer operating. Excluding these 14, the useful response rate was 14%.
Excluding the 34 companies known no longer to be operating, 325 useful replies were received out of a total of 1298 companies surveyed. The overall response rate then is 25%.
Including those not wishing to take part in the survey, there were 515 responses of any sort - 39.7% of the firms surveyed. A summary of the reasons which firms gave for not taking part is presented in Appendix 3.
3.2.2 Response By Industry Sector
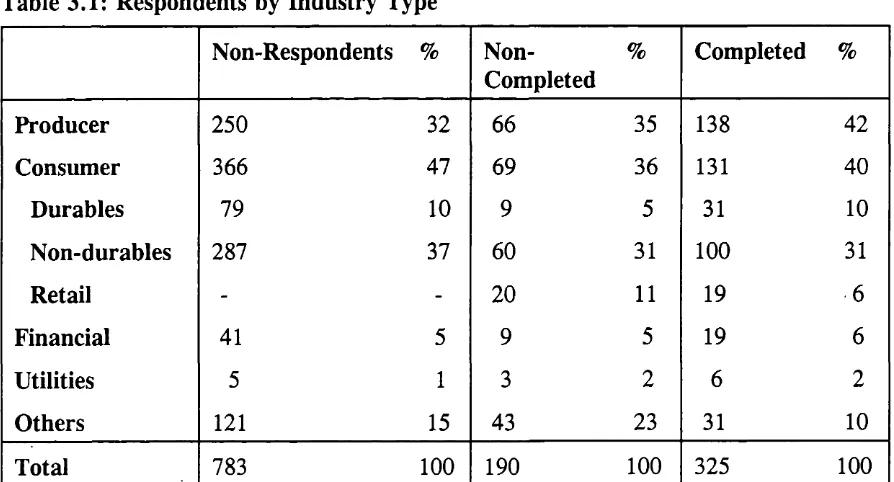
Questionnaire response by industry group is given in Table 3 .1 . Com panies are
divided into those whose main areas o f production are found within the follow ing
and Others. In this the Microexstat classifications are generally used. However some companies (classified under the Microexstat “Other Groups”) were re-allocated into another group when their questionnaire response clearly indicated that it was
appropriate. In addition water companies listed under Microexstat Group 9 are classified as Utilities. Consumer Goods industries are further divided into Durables and Non-durables. Lastly Retailers are distinguished as another consumer sub-group.
Consumer and producer goods industries are fairly equally represented, with about 40% of the sample in each category. The consumer section is dominated by firms producing non-durables, of which there are 100, as compared to 25 durable goods firms. Completed forms were received from 19 firms classified as retailers, all from within the non-durables group.
A more detailed breakdown of the sample by industry, across both the Microexstat industry groupings and the SIC two-digit industry classifications is given in Appendix 3.
3.2.3 Sample Selection Tests
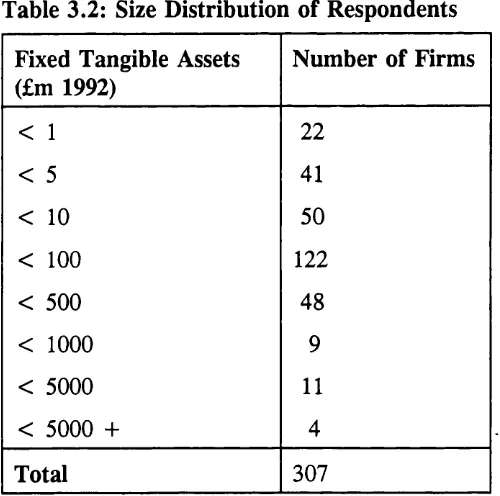
In order to investigate the possible problems of sample selection bias, several tests are carried out. The industry sector classification for non-respondents is given in Table 3.1. A chi-square test is used on the null hypothesis that the distribution of firms across producer, consumer and finance sectors is same for both respondents and non respondents (including those returning uncompleted forms). The %^(2) statistic works out as 6.85 which is significant at the 5% (but not 1%) level. When the consumer sector firms are split into durables and non-durables, the %^(3) is 7.60 which is significant only at the 10% level. Thus there is weak evidence of selection bias. Namely, slightly more producer firms and slightly fewer consumer firms responded than would be expected from the whole sample.
The second set of tests compare the mean sales, fixed tangible assets and pre-tax profits in 1992 of the respondents and non-respondents. Of the latter, data is held for all three variables for 890 firms, whilst data is available for 303 of the responding firms. The means and standard deviations are reported in Table 3.3. A simple t-test of the difference in means cannot reject the null hypothesis that there is no difference at even the 10% level of significance in any of the three cases.
3.3 QUESTIONNAIRE RESPONSES
3.3.1 Which Firms Advertise and Which Do Not?
Basic advertising theory suggests several broad generalisations about which sort of firms are likely to advertise more. One is that producer goods will tend to be
advertised less than consumer goods. Companies are seen as having more information about products they buy than consumers. Also they may have more of an incentive to check up on a good’s attributes rather than relying on advertising. Nick Kamen may be perfectly capable of persuading a teenager to buy a pair of I.^vi Jeans. It may take more than a thirty second advertisement to persuade the production manager at Levi to buy a £100,000 piece of sewing machinery.
In the terminology of Search Theory (Stigler, 1961), the marginal benefit of searching amongst different manufacturers is greater for the producer than for the consumer. Assuming similar costs of search for both, producer goods will have a higher optimal level of search. When purchasers undertake more search, the role for advertising is diminished.
The argument can also be worked in terms of the Dorfman-Steiner elasticities
approach. In their most basic result, the optimal advertising to sales ratio is equal to the ratio of advertising elasticity of demand to price elasticity of d e m a n d I f consumer goods are more responsive to advertising (or less responsive to price changes), then a higher optimal level of advertising results.
The same logic applies in the case of non-durable versus durable goods. By definition the latter are not subject to so many repeat purchases. They are also likely to be more expensive, causing the consumer to take care that the most suitable and economic product is being purchased. Thus the marginal benefit of search for consumers is greater when considering buying a new bathroom suite than for a Mars Bar. Consequently advertising is more worthwhile in the latter case.
The first question on the survey asked simply:
“Does your firm advertise?”
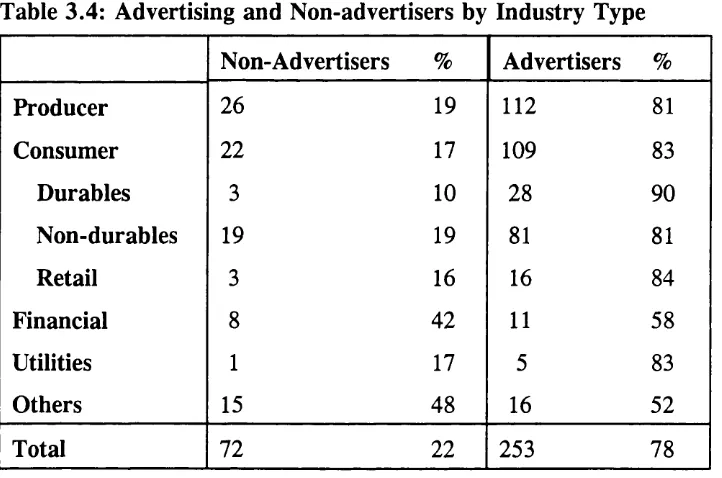
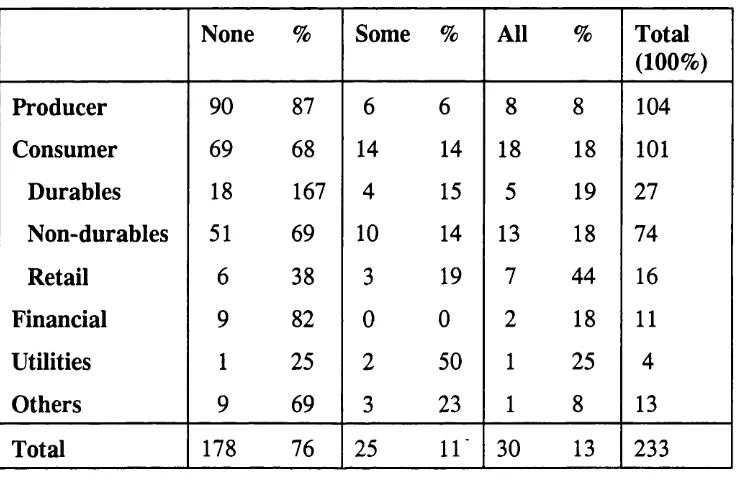
No definition of advertising was given, leaving it open to managers to decide what constitutes advertising for their firms. Seventy eight (24%) said they did not advertise at all. This figure corresponds very closely to the 22% non-advertisers reported by Robinson and Chang (1996) in the US. The breakdown by industry type is shown in Table 3.4 along with the 244 firms who stated that they did advertise.
Perhaps surprisingly, in the light of advertising theory, about the same proportion of companies (20%) in each of the producer, durables and non-durables categories do not advertise. The solution may be that whilst advertising as persuasion is more