382
Binding Affinity Prediction Of SCA Using PLD
And PMLD With Functional DNN And Its Variants
P. R. Asha, M. S. Vijaya
Abstract— Binding affinity prediction of hereditary anarchy like spinocerebellar ataxia (SCA) is imperative in medical field. Existing affinity prediction models built through machine learning demonstrates less prediction rate due to issues like selection of features, architecture of learning algorithm, hyper parameters used in learning. Hence a new affinity prediction model is proposed to meet the above challenges and to increase t he performance of prediction. In this work, binding affinity prediction is implemented with customized layers in deep neural network by training weights and sharing features. Pre-trained weights with customized layers in DNN is experimented with two approaches namely protein-ligand docking (PLD) and protein-mutated-ligand docking (PMLD) to facilitate accurate prediction. Two datasets are created using two docking approaches. The first dataset is created by docking 17 molecular structures of six types of spinocerebellar ataxia with 18 ligands. Features like energy calculations are extracted from the docked complex to predict binding affinity and the dataset is termed as PLD. The second dataset is shaped by mutating the protein of spinocerebellar ataxia by repeat mutation and docked with ligand to produce the complexes. Features like scoring functions, energy calculations and descriptors are extracted from the complex to model the affinity binding and it is phrased as PMLD. Customized layers in deep neural network are defined with three optimizers namely adam, rmsprop and nadam optimizer and the experiments have been carried out using two datasets. The results are compared with performance results of the model through functional deep neural network. Results demonstrates that the model built with customized layers in deep neural network for PLD dataset attains the highest prediction rate where the self learnt features from the hand crafted features found to be more precise in prediction.
Index Terms— Binding affinity; Deep Neural Network; Docking; Functional Deep Neural Network; Layer Creation; Optimizers; Prediction; PLD Dataset; PMLD Dataset; Protein Structure; Repeat Mutation.
—————————— ——————————
1
INTRODUCTION
Binding affinity prediction of inherited disorder like spinocerebellar ataxia is indispensable in medical field. Spinocerebellar ataxia (SCA) is distinguished by decline in the component of brain and spinal cord. Each type of spinocerebellar ataxia has its own indications and it has 36 types. People affected with spinocerebellar ataxia have difficulty in walking, eye movement, speech, co-ordination in movement. Genetic disorders occur by change in a gene called mutation. Mutations are of different kinds namely repeat mutation, insertion mutation, deletion mutation, nonsense mutation and missense mutation. Spinocerebellar ataxia mainly occurs due to repeat mutation and six types that occur due to repeat mutation are sca 1, sca 2, sca 3, sca 6, sca 8 and sca 10. Polyglutamine repeats are the expansion of amino acid glutamine, which is the combination of three amino acids namely cytosine, adenine and guanine. Spinocerebellar ataxia is an autosomal dominant disorder, which is passed from one parent. For example, if either father or mother posses faulty gene or repeats there is a chance of passing the disease to the offspring. In the case of repeat mutation if the parent has more than 38 repeats of glutamine then the offspring will have 40 repeats. Currently DNN architectures are not only used for classification but also for prediction. Recently author George E. Dahl [1] developed a model to predict the biomolecular target where multi-task deep learning networks were used for prediction. In deep learning architectures, convolutional neural network is used for gene sequencing and active site identification. Deep neural network has turned its current trend towards biomedical field and achieving great heights in treating many disorders and disease. Drug identification and
the accuracy obtained through deep neural network are higher than machine learning techniques. Deep learning yields the highest accuracy through its representations, learning the signalling between features etc. The basic DNN uses a stack of layers called sequential deep neural network where the process is implemented serially and building complex models are tricky since the layers cannot be connected in sequential neural network. The alternative technique in DNN architecture called functional deep neural network which connects the layers in pairwise where the complex models are built. In this technique the output of one layer is passed as input to other layer where as the changes through one layer have an effect on all the layers. The changes affect the performance of the model and the accuracy is lower since pre-trained weights are not obtained. The variant of functional deep neural network in DNN architecture is customizing the layers where the weights are trained and updated. The layers are customized to have pre-trained weights, reduction of error rate and cost function minimization. Various hyper parameters like epoch, dropouts, learning rate, beta 1, beta 2, optimizers, loss function etc., are used for fine tuning the performance of the models.
2 LITERATURE REVIEW
Liking expectation helps in tranquilize distinguishing proof for any sort of hereditary issue and it is basic to create precise models for forecast in biomedical investigation. In spite of the fact that there were a few approachs created, restricting partiality forecast through protein-protein association in AI is extremely constrained. A portion of the significant research works did for sedate objective cooperation and restricting fondness forecast is introduced here. Hakime ozturk al., [2] proposed a novel methodology for medicate target utilizing convolutional neural system. In this work the protein groupings were displayed and compound 1d portrayal were utilized. Two datasets were utilized to be specific Davis dataset and KIBA dataset, in which the Davis dataset comprises of particular examines of kinase protein family and significant inhibitors with their separate separation steady qualities. Davis dataset comprise cooperations of 442 proteins and 68 ligands. The KIBA dataset initially originated from a methodology called ________________________
P. R. Asha, Ph. D Research Scholar, PSGR Krishnammal College for Women, Coimbatore, India. E-mail: [email protected] M. S. Vijaya, Head and Associate Professor, Department of
383 KIBA, where kinase inhibitor bioactivities from various
sources, for example, Ki, Kd and IC50 were consolidated. Dataset were investigated kronRLS, simboost and DeepDTA. Among these methodologies the procedure that was utilized with profound learning produces preferred outcomes over the other factual centrality. Results were dissected with the utilization of predefined highlights with the DeepDTA. Profound learning gives the preferred outcomes rather over utilizing different strategies by utilizing crude arrangement of protein and medication data. Standard deviation of kronRLS, simboost and DeepDTA was 0.67, 0.70 and 0.71 individually.
Dong-Sheng Cao et al., [3] introduced a method for computational forecast of medication target collaborations utilizing compound, natural, and system highlights. The creators were utilized four classes of medication target connection arranges in people including chemicals, particle channels, G-protein-coupled receptors (GPCRs) and atomic receptors for foreseeing prescient models. These free models were executed with irregular woodland calculation. Pharmaceutically valuable datasets were considered for anticipating drug-target cooperations. The highlights they considered were substance, natural and system highlights. The procedure was executed utilizing five-crease cross approval and it was rehashed multiple times. The exhibition assessments utilized for this strategy were genuine positive, genuine negative, bogus positive, bogus negative, affectability, explicitness, exactness and ROC bend. To check the legitimacy of the model, highlights were consolidated in two sorts like concoction and natural, synthetic, organize and organic highlights. Irregular backwoods predicts the model superior to different methodologies. The exactness delivered by the irregular woods for four datasets were 93.52%, 94.84%, 89.68% and 84.72% separately.
Dong-sheng cao et al., [4] executed a method for medicate target cooperation utilizing protein arrangements and topological structures. Structure-movement relationship was utilized for building prescient models. Communication pair can be spoken to dependent on auxiliary and physiochemical properties. Four classes of medication target connection systems were utilized in particular catalysts, particle channels, G-protein-coupled receptors (GPCRs) and atomic receptors. Bolster vector machine was executed for foreseeing enormous scope tranquilize target cooperation. Highlights like sub-atomic fingerprints and CTD descriptors were separated from the medications and particles. The help vector machine delivers the exactness of four datasets was 90.31%, 88.91%, 84.68% and 83.74%. The process ability is high in utilizing structure-action relationship as opposed to different strategies. Bolster vector machine accomplishes preferable exactness over different calculations in anticipating drug-target connections. The background reveals that the models built for affinity prediction are constructed with known datasets. Molecular interactions like protein-ligand, protein-protein etc., plays an important role in the application of drug designing and also in the biological process of affinity prediction, molecular function identification etc., The results of our previous work [5] and [6] based on protein-protein interaction implemented with sequential and functional deep neural network yields the result lower than the customized layers in deep neural network. In this work, datasets related to ligand and protein-mutated ligand is used to validate the efficiency of DNN with customized layers in binding affinity prediction.
3 M
ETHODOLOGYBinding affinity prediction of spinocerebellar ataxia is modelled using deep neural network architecture with customized layers. Two approaches of binding affinity determination such as protein-ligand docking and protein-mutated ligand docking are used for building the datasets. The difference between two approaches is that the protein structures are mutated in second approach where the motivation is to observe the structural and sequence changes due to mutation. The binding affinity gets vary for the normal protein structure and mutated protein structure. The work is split into three segments namely corpus design, feature engineering, model building and performance evaluation.
3. 1 Corpus Design
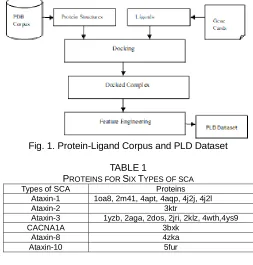
In the corpus design phase two datasets are created where the corpus is prepared by gathering the protein structures from PDB for six types of SCA that frequently occur owing to repeat mutations are given in Table 1 and the ligands that are chosen from genecards to dock with proteins are amantadine, benztropine, biperiden, bromocriptine, carbidopa, donepezil, entacapone, galantamine, levodopa, pergolide, pramipexole, procyclidine, rivastigmine, ropinirole, selegiline and tacrine. Flexible docking is preferred for this type of dataset where ligand rotates the protein and optimum pose is selected to get docked complex. Protein-ligand docking is made in autodock and totally seventeen protein structures and eighteen ligands are considered for docking. Each protein is docked with ligand in order to produce the docked complex. Significant features such as energy calculations and physical properties of protein and ligand are extracted by means of autodock, autodock vina and pymol where the dataset is named as PLD dataset. Corpus design for first approach is shown in Fig 1.
Fig. 1. Protein-Ligand Corpus and PLD Dataset
TABLE1
PROTEINS FOR SIX TYPES OF SCA
Types of SCA Proteins
Ataxin-1 1oa8, 2m41, 4apt, 4aqp, 4j2j, 4j2l
Ataxin-2 3ktr
Ataxin-3 1yzb, 2aga, 2dos, 2jri, 2klz, 4wth,4ys9
CACNA1A 3bxk
Ataxin-8 4zka
Ataxin-10 5fur
384 where the ligand amantadine is docked with the protein
structure 1oa8 to glutamine aminoacid in the position 644, 648 and 652 and the validation of the complex is performed using ramachandran plot which is shown in Fig 3.
Fig. 2. Docked Complex of 1oa8 with Amantadine
Fig. 3. Validation of the Complex 1oa8 with Amantadine
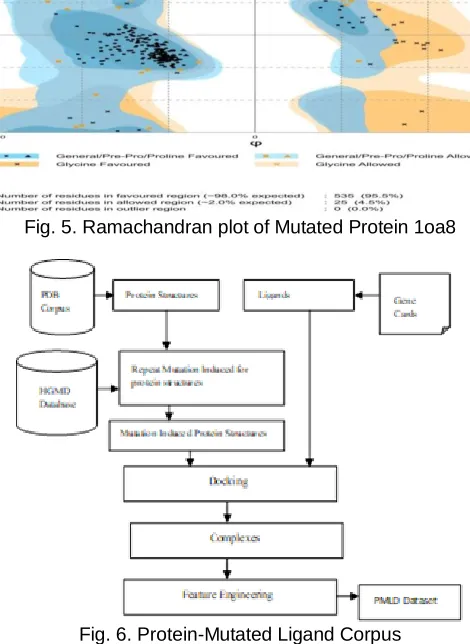
The second corpus is equipped with the protein structures for six types of spinocerebellar ataxia, gathered from PDB as listed Table 1. The protein structures are mutated with the repeat mutation information available from the HGMD database which is given in Table 2. Protein-ligand docking is done with autodock and totally seventeen protein structures and eighteen are considered for docking. Each protein is mutated and docked with ligands listed previously. The normal and mutated structure of 1oa8 is shown in Fig 4. The validity of the mutated protein is verified with the ramachandran plot and it is given in Fig 5.
TABLE2
MUTATIONAL INFORMATION OF SIX SCATYPES
Protein Structures Number of Repeats
Ataxin-1 40-100
Ataxin-2 32-500
Ataxin-3 68-79
Ataxin-6 21-28
Ataxin-7 40-200
Ataxin-8 116
Ataxin-10 1611
Features like energy calculations, rf score, cyscore, sequence descriptors and autodock vina scores are squeezed from docked complex where the dataset is named as PMLD
dataset. Corpus design for second approach is shown in Fig 6.
Fig. 4. Normal Structure of 1oa8 and mutated structure of 1oa8
Fig. 5. Ramachandran plot of Mutated Protein 1oa8
Fig. 6. Protein-Mutated Ligand Corpus
In the second phase the predictive models are built with DNN and its variant with adam optimizer for each technique namely sequential DNN, functional DNN and customized layers in DNN. The performance of the models are evaluated with various metrics like explained variance score, R2 score, mean squared error, mean absolute error, median absolute error, root mean squared error etc.,
3.2 Feature Engineering
From the corpus protein-ligand, features such as energy calculations and physical properties are extracted and the dataset PLD is created. In the same manner, from the second corpus protein-mutated-ligand, features like scoring functions, sequence descriptors and energy calculations are squeezed and the dataset PMLD is shaped.
3.2.1 PLD Dataset
385 calculations like vanderwaals energy, desolvation energy,
torsional energy, electrostatic energy, inhibition constant, ligand efficiency etc., and physical properties like molecular weight of both protein, ligand, complex; surface area of solvent for protein, ligand and complex.
Energy calculations are important in predicting binding affinity where the vanderwaals energy plays role in attraction and repulsion of atoms, molecules and surfaces. Vanderwaals is the weakest attraction, along with this bond covalent and ionic bonds helps in proper function of protein. Solvation energy is important because the complex is fed to a solvent where the chemical reaction occurs between the bonds and the energy is measured. Torsional energy is measured as the dihedral angles in the protein structure where the energy changes due to rotation and the best value of energy is calculated. Electrostatic energy is the energy that occurs due to reaction of charged atoms and it is measured to calculate the changes in the energy. Inhibition constant measures the potency of inhibitor. These energy values are very significant to calculate binding affinity. Binding affinity is the measure, how well the structure binds with the ligand. Binding energy is the energy of docked complex that is bound together with the ligand. Physical properties are measured for ligand, complex and protein structure where the changes occur in molecular weight, atom count, charge and surface area of all the solvents are changed due to docking where they are collected from pymol. These features are derived from the 307 docked complexes and the feature values are normalized using min-max normalization. Binding affinity values are derived from autodock and augmented with feature vectors of dimension 28 and the PLD dataset is created.
3.2.2 PMLD Dataset
Significant features like energy profiles, rf score, cyscore, sequence descriptors and autodock vina scores are extricated from the docked complex attained from the mutated protein-ligand docking. Energy profiles like binding energy, inhibition constant, intermolecular energy, desolvation energy, electrostatic energy, total internal energy and torsional energy. Sequence descriptors consist of amino acid composition, autocorrelation, CTD, Quasi-sequence-order descriptors, Pseudo amino acid composition and profile-based descriptors. Cyscore posses hydrophobic free energy, cyscore, van der waals interaction energy, hydrogen-bond interaction and ligand’s conformational entropy. Rfscore consists of thirty six values and each feature will denote the number of occurrences of a particular protein-ligand atom type pair interacting within a certain distance range. Autodock vina scores have ∆Ggauss, ∆Grepulsion, ∆Ghydrophobic and ∆GHbond.
Energy calculations are important to predict binding affinity. The same energy calculations are considered like PLD dataset. Sequence descriptors are measured where the changes occur in sequence of amino acid, structure, protein folding and binding gets changed due to mutation. Cyscore is extracted for interaction energy profiles like hydrogen-bond, vanderwaals and cyscore. Scores from autodock vina are squeezed for free energy profiles of repulsion, hydrogen bond and hydrophobic. Rf score contains 36 features where the commonly occurred atoms in both the ligand and structure are computed where the energy calculations are extracted using autodock. Cyscore, rfscore and autodock vina scores are squeezed through unix where the sequence descriptors are extracted using R script. These features are derived from the
306 docked complexes and feature values are normalized using min-max normalization. Binding affinity values are derived from autodock and amplified with feature vectors of dimension 509 and PMLD dataset is created. The profile of the datasets is given in Table 3.
TABLE3
PROFILE OF DATASETS Datas
ets
Concep t
Summar y of Protein
Structures and Ligand
Summa ry of Features
No. of Instances
PLD Protein-Ligand Docking
17 structrues
and 18 Ligands
28 307
PMLD Protein
Mutated-Ligand
17 structures
and 18 Ligands
509 306
3.3 Model Building and Performance Evaluation
Binding affinity predictive models are built using DNN with customized layer architecture and implemented with three optimizers namely Adam, RMSprop and Nadam. Various hyper parameters like learning rate, epochs, dropouts, loss function, activation function, optimizers etc., are used here to build the models. The system design is shown in Fig 7.
Fig.7. Framework of Binding Affinity Prediction Model
386 variance score, mean squared error, root mean squared error,
R2 score, median absolute error, mean absolute error etc. Performance metrics like explained variance score and mean squared error are considered as significant metrics in regression task where explained variance score should be higher and the error rate should be low. The other error metrics like root mean squared error, median absolute error and mean absolute error should be minimal.is created for training weights. The initial weight given is 56 and the weight is updated for each iteration to get the better result. The hyper parameters specified are learning rate, activation function, loss function, dropouts, beta 1, beta 2, epsilon and optimizer. Tuning of hyper parameters aids in achieving the better prediction rate and the performances of the models are evaluated using various metrics such as explained variance score, mean squared error, root mean squared error, R2 score, median absolute error, mean absolute error etc.
Performance metrics like explained variance score and mean squared error are considered as significant metrics in regression task where explained variance score should be higher and the error rate should be low. The other error metrics like root mean squared error, median absolute error and mean absolute error should be minimal.
4. EXPERIMENTS AND RESULTS
Deep neural network is implemented in keras as front end and tensorflow as back end in jupyter environment. Two experiments have been carried out in which the binding affinity predictive models are trained independently using both datasets PLD and PMLD. The various hyper parameters like optimizer, epoch, dropouts, learning rate, beta 1, beta 2, epsilon etc., are defined to build the models.
The parameter settings used to build the models are optimizer = adam, rmsprop and Nadam, activation function = relu, dropouts = 0.2-0.5, learning rate = 0.01, loss function = sparse_categorical_crossentropy, activation function = softmax, beta 1 = 0.99, beta 2 = 0.999, epsilon = 1e-08. The input dimension is 56 and the initial weight specified is 56 where the hidden layer =30 with single output layer. The standard k-fold cross validation technique is worn to assess the results of the binding affinity prediction models.
In the first experiment, binding affinity prediction is modelled with PLD dataset through three different optimizers and customized layers in deep neural network. Adam optimizer outperforms other two optimizers and the performance evaluation result for various metrics is exposed in Table 4. The results of various dropouts are depicted in Fig 8.
TABLE4
RESULTS OF DNN WITH CUSTOMIZED LAYER AND ADAM OPTIMIZER FOR PLD DATASET
Drop out Epo chs Expl aine d varia nce scor e R2 scor e Mea n squa red error Root mean square d error Mean absolut e error Median absolute error
0.2 50 0.65 0.65 0.41 0.64 0.47 0.31 100 0.69 0.69 0.29 0.56 0.30 0.20 200 0.70 0.70 0.30 0.50 0.30 0.20 400 0.69 0.69 0.29 0.56 0.30 0.20 500 0.85 0.85 0.20 0.44 0.25 0.15
0.3 50 0.65 0.65 0.41 0.64 0.47 0.31
100 0.72 0.72 0.29 0.56 0.36 0.25 200 0.75 0.75 0.30 0.35 0.20 0.15 400 0.82 0.82 0.23 0.40 0.23 0.13 500 0.95 0.95 0.11 0.30 0.12 0.4
0.4 50 0.79 0.79 0.29 0.48 0.20 0.15 100 0.80 0.80 0.20 0.42 0.22 0.13 200 0.83 0.83 0.22 0.46 0.20 0.17 400 0.87 0.87 0.13 0.28 0.22 0.12 500 0.90 0.90 0.10 0.20 0.14 0.4
0.5 50 0.75 0.75 0.30 0.59 0.39 0.27 100 0.82 0.82 0.20 0.44 0.22 0.15 200 0.90 0.90 0.12 0.34 0.15 0.6 400 0.85 0.85 0.20 0.44 0.25 0.15 500 0.89 0.89 0.18 0.35 0.16 0.8
Table 4 shows that the predictive model built with adam optimizer achieves the better score where the features of energy calculations in PLD dataset aids in predicting binding affinity accurately and prediction rate of binding affinity with dropout 0.3 and epoch 500 attains the better score of 0.95 as explained variance score and 0.11 as mean squared error. The other metrics like root mean squared error, mean absolute error and median absolute error are 0.30, 0.12 and 0.4 respectively.
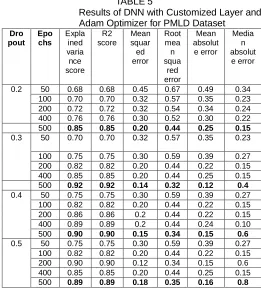
In the second experiment, DNN with customized layers is trained through three optimizers under the same parameter settings using the PMLD dataset and the evaluation results are given in Table 5. In this experiment with PMLD dataset also adam optimizer outperforms the other two optimizers. The results of various dropout rates are depicted in Fig 9.
TABLE5
Results of DNN with Customized Layer and Adam Optimizer for PMLD Dataset
Dro pout Epo chs Expla ined varia nce score R2 score Mean squar ed error Root mea n squa red error Mean absolut e error Media n absolut e error
0.2 50 0.68 0.68 0.45 0.67 0.49 0.34 100 0.70 0.70 0.32 0.57 0.35 0.23 200 0.72 0.72 0.32 0.54 0.34 0.24 400 0.76 0.76 0.30 0.52 0.30 0.22 500 0.85 0.85 0.20 0.44 0.25 0.15
0.3 50 0.70 0.70 0.32 0.57 0.35 0.23
100 0.75 0.75 0.30 0.59 0.39 0.27 200 0.82 0.82 0.20 0.44 0.22 0.15 400 0.85 0.85 0.20 0.44 0.25 0.15 500 0.92 0.92 0.14 0.32 0.12 0.4
0.4 50 0.75 0.75 0.30 0.59 0.39 0.27 100 0.82 0.82 0.20 0.44 0.22 0.15 200 0.86 0.86 0.2 0.44 0.22 0.15 400 0.89 0.89 0.2 0.44 0.24 0.10 500 0.90 0.90 0.15 0.34 0.15 0.6
0.5 50 0.75 0.75 0.30 0.59 0.39 0.27 100 0.82 0.82 0.20 0.44 0.22 0.15 200 0.90 0.90 0.12 0.34 0.15 0.6 400 0.85 0.85 0.20 0.44 0.25 0.15 500 0.89 0.89 0.18 0.35 0.16 0.8
387 mean squared error as 0.14. The other error metrics is also
minimal when compared with the other dropout rates. The values obtained for root mean squared error, mean absolute error and median absolute error are 0.32, 0.12 and 0.4 respectively.
Fig.8. Results of DNN with Customized Layers and Adam Optimizer for PLD Dataset at Various Dropouts
Fig.9. Results of DNN with Customized Layer and Adam Optimizer for PMLD Dataset at Various Dropouts
The above results of binding affinity predictive models have been compared with results of our previous binding affinity prediction model based on functional deep neural network. In case of functional deep neural network also, the binding affinity predictive model built with adam optimizer outperforms the models built with other two optimizers [6]. The comparative analyses has been done on two important metrics such as explained variance score and mean squared error, the results are tabulated in Table 6 and illustrated in Fig 10.
TABLE6
COMPARATIVE RESULTS OF PLD AND PMLD WITH FUNCTIONAL
DNN AND CUSTOMIZED LAYER IN DEEP NEURAL NETWORK
Datasets Functional DNN Customized Layers with DNN
Explaine d variance score
Mean squared error
Explained variance score
Mean squared error
Protein-Ligand
0.93 0.12 0.95 0.11
Protein- Mutated-Ligand
0.90 0.15 0.92 0.14
Fig.10. Comparative Results of PLD & PMLD with Functional DNN and Customized Layer in DNN
It is obvious, from comparative results that the binding affinity prediction models based on DNN with customized layers attains higher results for both the datasets PLD and PMLD than the affinity prediction models based on functional DNN with respect to prediction rate. In case of binding affinity based on protein-ligand dataset, the representation learning and self learnt high level features in deep architecture contributed more than the user defined features in PMLD dataset in predicting the binding affinity.
5.
F
INDINGSThe binding affinity predictive models built with customized layers in deep neural network yields the better results for both protein-ligand and protein-mutated-ligand than the models built with functional deep neural network. It is obvious that the models built with customized layers in deep neural network is well suited for predicting binding affinity with any type of interactions. Network with user defined layers achieves the higher performance since it has pre-trained weights that are shared among the layers which helps in error minimization and improves the prediction rate. The feature selection in deep learning architectures, by means of representation learning helps in achieving the highest prediction rate for protein-ligand dataset. Hyper parameters tuning of learning rate, epochs, dropouts etc., facilitates in optimizing the models. The network weight and learning rate updation by adam optimizer illustrates the higher prediction rate than the models with rmsprop and nadam optimizers. The self learnt features from the user defined features of PLD dataset found to be more effective in building binding affinity prediction model than the supplemented user defined features of PMLD dataset. This proves the power of representation learning in deep architectures.
6. CONCLUSION
388 deep learning technique through customized layers and
compared with results of functional deep neural network. The performance of the prediction rate was assessed based on various metrics and the results prove that DNN with user defined layer is best suited for the prediction of binding affinity than functional DNN.
REFERENCES
[1] George E. Dahl, “Multi-task Neural Networks for QSAR
Predictions‖, datascience association, 2014
[2] Hakime Öztürk, Arzucan Özgür, Elif Ozkirimli, ―DeepDTA:
deep drug–target binding affinity prediction‖,
Bioinformatics, vol 34, issue 17, Sep 2018
[3] Dong-Sheng Cao, Liu-Xia Zhang, Gui-Shan Tan, Zheng Xiang, Wen-Bin Zeng, Qing-Song Xu and Alex F Chen, ―Computational Prediction of Drug-Target Interactions Using Chemical, Biological, and Network Features‖, Molecular Informatics, vol 33, issue 10, Oct 2014
[4] Dong-Sheng Cao, ShaoLiu, Qing-songXu, Hong-MeiLu, Jian-HuaHuang, Qian-NanHu, Yi-ZengLiang ―Large-scale prediction of drug–target interactions using protein sequences and drug topological structures‖, Analytica chimica acta, vol 752, issue 8, Nov 2012
[5] Asha P R, Vijaya MS, ―Deep Neural Networks for Affinity Prediction of Spinocerebellar Ataxia using Protein Structures‖ Journal of Advanced Research and Control Dynamical Systems, Vol 11, no 4.
[6] Asha P R, Vijaya M S, ―Affinity Prediction of Spinocerebellar Ataxia Using Ligand and Protein-Protein Interactions with Functional Deep Learning‖, International journal of Engineering and Advanced Technology, vol 8, no 5, July 2017
[7] Alexander Aliper, Sergey Plis, Artem Artemov, Alvaro Ulloa, Polina Mamoshina, and Alex Zhavoronkov, Deep learning applications for predicting pharmacological properties of drugs and drug repurposing using transcriptomic data, Molecular Pharmaceutics, 2016 13(7), 2524-2530
[8] Thomas Unterthiner , Andreas Mayr , Gunter KlambauerJesse, Marvin Steijaert, Jorg K. Wegner, Hugo Ceulemans, Sepp Hochreiter, Deep Learning for Drug Target Prediction, Semantic scholar
[9] Rhys Heffernan, Kuldip Paliwal, James Lyons, Abdollah Dehzangi, Alok Sharma, Jihua Wang, Abdul Sattar, YuedongYang & Yaoqi Zhou, Improving prediction of secondary structure, local backbone angles, and solvent accessible surface area of proteins by iterative deep learning, Scientific Reports, june 22, 2015
[10] Preamsudha V, Vijaya MS, ―Identification of Autism Spectrum Disorder using a Multi-Label Approach‖, Journal of Advanced Research in Dynamical and Control Systems, Vol 11, no 4, pp 134-141, June 2019
[11] Sathyavikasini K, Vijaya MS, ―Muscular Dystrophy Disease Classification Using Relative Synonymous Codon Usage‖, International Journal of Machine Learning and Computing, Vol 6, pp 139-144, 2016