HUMAN SALIVA
Thesis submitted for the degree of
DOCTOR OF PHILOSOPHY
In the
FACULTY OF MEDICINE
of the University of London
by
STUART RICHARD SMITH
November 1994
Department of Pharmaceutics,
The School of Pharmacy,
University of London,
29/39 Brunswick Square,
London, WC1N 1 AX
and
Department of Periodontology,
The London Hospital Medical College,
All rights reserved
INFO RM A TIO N TO ALL U SER S
The quality of this reproduction is dependent upon the quality of the copy submitted.
In the unlikely event that the author did not send a complete manuscript
and there are missing pages, these will be noted. Also, if material had to be removed, a note will indicate the deletion.
uest.
ProQuest 10105139
Published by ProQuest LLC(2016). Copyright of the Dissertation is held by the Author.
All rights reserved.
This work is protected against unauthorized copying under Title 17, United States Code. Microform Edition © ProQuest LLC.
ProQuest LLC
789 East Eisenhower Parkway P.O. Box 1346
Saliva has a number of functions which are important in maintaining a
healthy oral environment. Its composition and rheoiogical properties are
complex making the formulation of a saliva substitute^ with identical
properties difficult. Recently it has become apparent that saliva also forms a
tough viscoelastic film at the air-saliva interface. The significance of this
property is currently unknown but it may have implications for the
development of better saliva substitutes and in the pathogenesis of some
oral diseases. The aims of the current study were to;
1. Investigate the surface film forming properties of saliva.
2. Compare these properties with those of commercially available saliva
substitutes.
3. Undertake preliminary characterisation of the composition of the surface
fiim.
Surface elasticity and surface viscosity were assessed using an Oscillating
Ring Surface Shear Rheometer (ORSSR) at approximately 6Hz. Whole
resting saliva and stimulated parotid saliva were collected using standard
techniques from one healthy male subject. The surface rheoiogical
properties of human saliva were compared with those of commercially
available saliva substitutes. Results indicated that whilst human saliva had
pronounced surface film forming properties none of the commercially
available saliva substitutes demonstrated any measurable surface elasticity
approx. 1.75Ns/m). Dilution of saliva with normal saline produced a further
reduction in rheoiogical parameters but these were not directly related to the
concentration of saliva.
Isolation of the surface film of stimulated parotid saliva enabled its protein
composition to be investigated with SDS page electrophoresis. Results
indicated that two protein fractions were concentrated within the surface film,
one with a large molecular weight (>205KDa) and one with a lower
molecular weight (approx. 10-12KDa).
Conclusion - Human saliva forms a strong viscoelastic fiim at its interface
with air. The formation of the film is adversely affected by freezing and
appears to involve concentration of two distinct protein fractions in the
research project and would particularly like to thank the following:
My supervisors Dr. B. Warburton and Prof. S. Challacombe who have given
me great encouragement, advice and support throughout the research.
Prof. M. Newton and staff at The School of Pharmacy for allowing me to work in The Dept. Pharmaceutics and for making me feel welcome.
Dr. 8 . Joyston-Bechal who helped to initiate the project and who has taught
me a great deal about research during the time that we have worked
together in the Dept. Periodontology, LHMC.
Prof. F. C. Smales who has made the time available for me to undertake my
PhD.
Prof. W. Gibbons and Mr. W. Baldeo - for undertaking the analyses of
stimulated parotid samples (see section 6.3.4) at the Dept. Analytical Chemistry, School of Pharmacy, Brunswick Square, London.
Dr. M. Hector for providing the Carlson-Crittenden cups and for his advice
and encouragement throughout the project.
Dr. G. Proctor and Dr. D. Shori in The Soft Tissue and Secretory Research
Unit at Kings College School of Medicine and Dentistry who undertook the
experiments in section 6.3.3 and taught me the techniques involved in
analysing the surface film at the same time. Their enthusiasm has been
instrumental in opening up areas of future research.
Mrs C. Moules for allowing me access to the Kruss tensiometer in the
laboratories of Kruss Instruments, Royston, Herts.
Abstract 2
Acknowledgements 4
Contents 5
List of figures and tables 11
Chapter 1 Introduction and review of the literature 17
1.1 Introduction 18
1.2 Saliva 19
1.2.1 Functions of saliva 19 1.2.2 Mechanism of salivary secretion 21
1.2.3 Methods of collecting saliva 22
1.2.4 Which is the most appropriate
secretion to collect? 25
1.2.5 Saliva film thickness 25
1.3 Salivary macromolecules 26
1.3.1 General features of glycoproteins 26
1.3.2 Mucus glycoproteins 28
1.3.3 Salivary mucins 30
1.3.4 Mucus coat 33
1.4 Rheology 34
1.4.1 Newtonian liquids 35
1.4.2 Non-Newtonian liquids 36
1.4.3 Viscoelastic liquids 39 1.4.4 Rheoiogical methods 41 1.5 Bulk rheology of saliva 42 1.6 Surface film formation 49
1.7 Lubrication 51
1.8 Saliva substitutes 55
1.9 The relation between the physical properties of saliva
2.1 Introduction 68
2.2 ORSSR theory 69
2.3 Determination of viscosity and elasticity
by comparison with distilled water 71
2.3.1 Measurement of viscosity 71
2.3.2 Measurement of elasticity 71
2.4 Other variables 72
2.4.1 Scaling and attenuation factors 72
2.4.2 Calculation of the moment of inertia 73
2.4.3 The geometry factor 74
2.5 Position of the ORSSR ring in the
sample 77
2.6 Use of the ORSSR with the ring
positioned in the bulk of the test fluid 78
2.7 Conclusions 79
Chapter 3 Polyethvlene oxide and sodium
carboxymethylcellulose 80
3.1 Introduction 81
3.2 Aims 82
3.3 Polyethylene oxide solutions prepared from tablets 83
3.3.1 Materials and methods 83
3.3.1.1 Cleaning the ORSSR ring and dish 83
3.3.1.2 Preparation of solutions from
polyethylene oxide tablets 83
3.3.1.3 Surface rheoiogical measurements 84
3.3.2 Results 85
3.3.2.1 Surface and bulk measurements (using
the ORSSR) of 1-3% polyethylene oxide
solutions 85
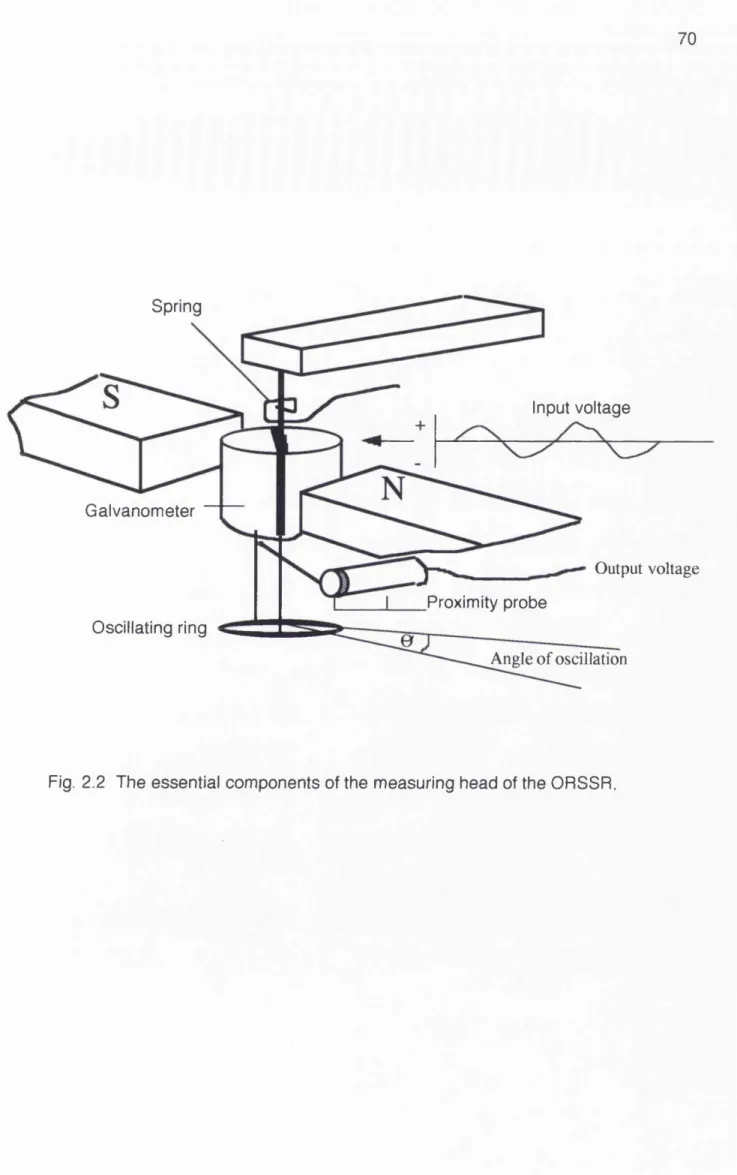
3.3.2 2 Effect of the volume of a sample on the
surface elasticity of a 2% polyethylene
oxide solution 90
3.4.1 Introduction 98
3.4.2 Aims 98
3.4.3 Materials and methods 98
3.4.4 Results 99
3.4.5 Discussion 99
3.5 Sodium carboxymethylcellulose 103
3.5.1 Introduction 103
3.5.2 Aims 104
3.5.3 Materials and methods 104
3.5.4 Results 105
3.5.5 Discussion 110
3.6 Conclusions 113
Chapter 4 Surface rheology of saliva substitutes
and human whole resting saliva 114
4.1 Introduction 115
4.2 Difficulties associated with measuring the
high film strength of saliva with the ORSSR 115 4.3 Modifications made to the ORSSR 117
4.3.1 Modifications to the ORSSR electronics 117
4.3.2 Modifications to the ORSSR
ring and dish 117
4.4 Investigation of the rheoiogical properties
of whole resting saliva and saliva substitutes 119
4.4.1 Aims 119
4.4.2 Materials and methods 119
4.4.2.1 Saliva substitutes 119
4.4.2.2 Collection of human whole saliva 120
4.4.2.3 Rheoiogical measurement 121
Page
4.4.4 Discussion 129
4.5 Whole resting saliva from one individual 134
4.5.1 Introduction 134
4.5.2 Aims 134
4.5.3 Materials and methods 135
4.5.3.1 Collection of saliva samples 135
4.5.3.2 Rheoiogical measurements 135
4.5.4 Results 135
4.5.5 Discussion 141
4.6 Conclusions 144
Chapter 5 The surface rheology of human
parotid saliva 145
5.1 Introduction 146
5.2 Aims 147
5.3 Materials and methods 148
5.3.1 Collection of parotid saliva 148
5.3.2 Rheoiogical measurement 150
5.3.3 Statistics 151
5.4 Results 151
5.4.1 Stimulated parotid saliva tested
immediately after collection 151
5.4.2 Surface elasticity and surface viscosity of
stimulated parotid saliva with the ORSSR
ring positioned in the surface and in the bulk 153
5.4.3 Surface elasticity and surface viscosity
of stimulated parotid saliva which had
been stored at room temperature for 1 hr 160
5.4.4 Effect of freezing on the surface
rheology of stimulated parotid saliva 160
5.4.4.1 Surface elasticity 160
5.4.4.2 Surface viscosity 164
5.4.5 Correlation between the length of time
that the saliva sample had been stored
5.5
5.6
which had been stored frozen and diluted with
normal saline
5.4.6.1 Surface elasticity
5.4.6.2 Surface viscosity
Discussion Conclusions 168 168 170 173 176
Chapter 6
6.1 6.2 6.3 6.4 6.5 6.6
Prelim inary characterisation of the
surface film of human parotid saliva 177
Introduction 178
Aim s 179
Materials and methods 179
6.3.1 Collection of stimulated parotid saliva 179
6.3.2 Assessment of rheoiogical properties
and storage of samples 179
6.3.3 Investigation of the composition of the surface film 181
6.3.3.1 Estimation of protein concentration 181
6.3.3 2 SDS page electrophoresis 182 6.3.4 Additional analyses of the composition of the saliva
samples 183
Results 184
D iscussion 194
Conclusions 198
Chapter 7
7.1
7.2
7.3
7.4
General discussion and future w ork
Introduction
Determination of the function of the
surface film of saliva
Development of a diagnostic test
7.3.1 Effect of storage
7.3.2 Effect of dilution
Choice of subject fo r saliva samples
7.5 7.6 7.7
Relevance of surface rheology to saliva substitutes
Conclusions Future work
Page
208
211
212
Appendix 1 Constituents of saliva substitutes Appendix 2 Lowry protein assay
Appendix 3 Publications in support of thesis
213
215 216
List of Figures and Tables Page
Chapter 1
Fig. 1.1
1.2 1.3 1.4 1.5 1.6 1.7 1.8 Fig Fig Fig Fig Fig Fig Fig Fig, 1.9
Schematic representation of saliva secretion
Patterns of giycosylation of glycoproteins
Representation of Newtonian flow
Newtonian flow curves
Shear stress against shear rate rheograms
Hysteresis loop
Maxwell model of viscoelastic behaviour
Components of a cone and plate rheometer
Components of a cup and bob viscometer
21 27 36 37 37 38 41 43 43
Table 1.1 Principle functions of saliva 20
Table 1. 2 Factors which should be taken into consideration
when collecting saliva 23
Table 1.3 Size of mucin glycoproteins 30
Table 1.4 Structure and function of salivary mucins 31
Table 1.5 Studies investigating the bulk rheology of saliva 44
Table 1. 6 Differences between the composition of pig gastric mucin
and bovine submandibular mucin 58
Table 1.7 Changes in viscosity of saliva associated with pathology 63
Table 1. 8 Changes in composition of saliva associated with pathology 64
Chapter 2 The Oscillating Rina Surface Shear Rheometer (ORSSR)
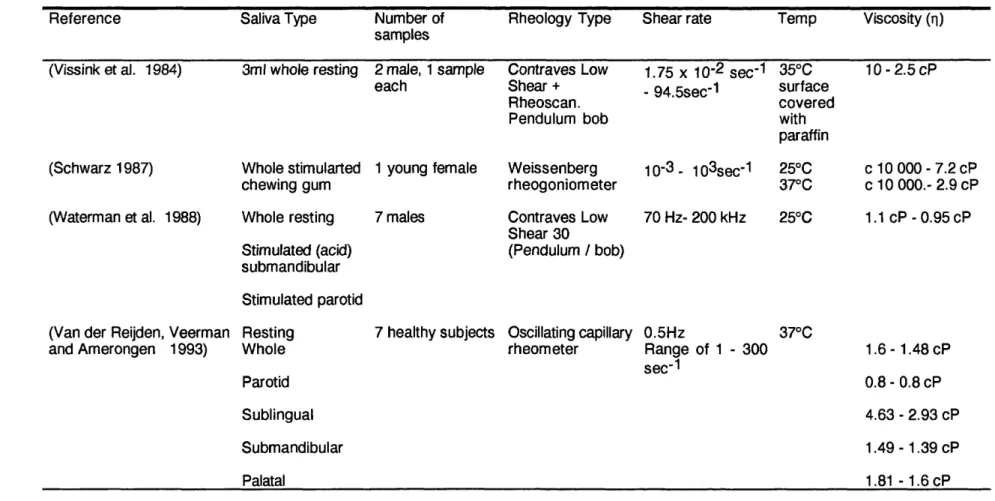
Fig. 2.1 The Dunouy ring positioned in the surface of
the liquid at the air-liquid interface Fig. 2.2 The essential components of the
measuring head of the ORSSR
Fig. 2.3 Positioning of rod on ORSSR ring to enable
the calculation of the moment if inertia
Fig. 2.4 Calculation of the moment of inertia
Table 2.1 Resonant frequency of ORSSR during calculation of
the moment of inertia
69
70
73
76
Page
Chapter 3 Polyethylene oxide and sodium carboxymethylcellulose
Fig. 3.1 Mean surface elasticity against time for 1-3%
polyethylene oxide solutions prepared from tablets 8 6
Fig. 3.2 Reciprocal plot of mean surface elasticity against
time for polyethylene oxide solutions 87
Fig. 3.3 Mean elasticity against time for 2%
polyethylene oxide solutions with the ring
positioned in the surface and in the bulk 8 8
Fig. 3.4 Mean elasticity against time for 3%
polyethylene oxide solutions with the ring
positioned in the surface and in the bulk 89
Fig. 3.5 Mean viscosity against time for 2%
polyethylene oxide solutions with the ring
positioned in the surface and in the bulk 91 Fig. 3.6 Mean viscosity against time for 3%
polyethylene oxide solutions with the ring
positioned in the surface and in the bulk 92
Fig. 3.7 Double plot of surface elasticity and surface
viscosity against time for a 2% polyethylene
oxide solution 93
Fig. 3.8 Effect of the sample volume on the surface
elasticity of a 2% polyethylene oxide solution 94
Fig. 3.9 Effect of the sample volume on the relationship
between the ORSSR ring and the base of the
ORSSR dish 96
Fig. 3.10 Surface elasticity against time for 1 -3%
polyethylene oxide solutions made from
polyethylene oxide powder 1 0 1
Fig. 3.11 Surface viscosity against time for 1 -3%
polyethylene oxide solutions made from
polyethylene oxide powder 1 0 2
Fig. 3.12 Effect of concentration on surface rheoiogical
properties of polyethylene oxide solutions 103
Fig. 3.13 Surface elasticity against time for 1% sodium carboxymethylcellulose with 1M NaCI
Fig. 3.14 Surface tension against time for 1% sodium
carboxymethylcellulose with 1M NaCI
and 0.1% sodium lauryl sulphate
Fig. 3.15 Mean elasticity against time for 1 % sodium
carboxymethylcellulose solutions with the ring
positioned in the surface and in the bulk
Fig. 3.16 Mean viscosity against time for 1 % sodium
carboxymethylcellulose solutions with the ring
positioned in the surface and in the bulk
Page
108
109
111
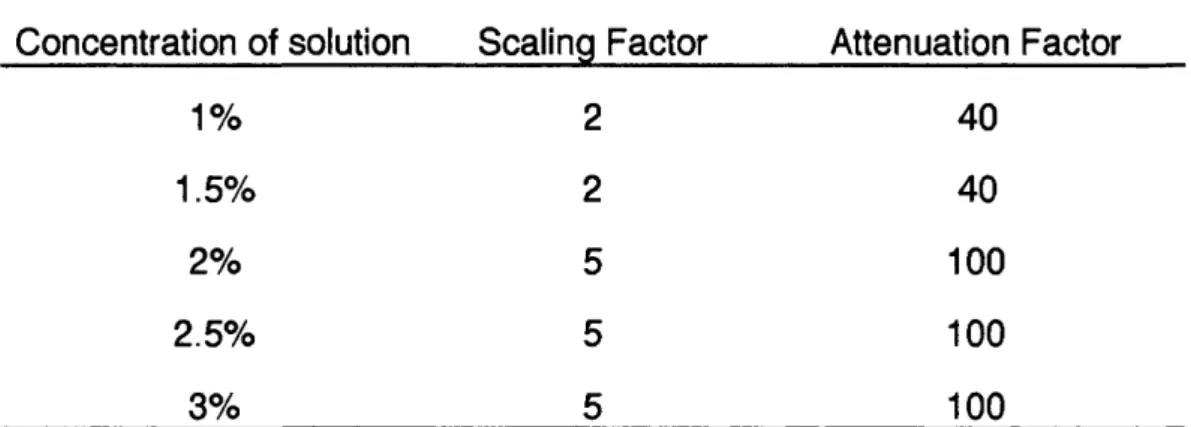
Table 3.1 Scaling and attenuation factors for solutions
of polyethylene oxide
Table 3.2 Surface tension and surface elasticity of
Na CMC solutions
99
106
Chapter 4 Surface rheology of saliva substitutes and human whole resting saliva
Fig. 4.1 Dimensions of modified ORSSR ring
Fig. 4.2 Individual patterns of growth of surface
elasticity for whole saliva
Fig. 4.3 Surface elasticity against time for saliva
substitutes, 1% sodium carboxymethylcellulose
and whole resting saliva
Fig. 4.4 Surface viscosity against time for saliva
substitutes, 1 % sodium carboxymethylcellulose
and whole resting saliva
Fig. 4.5 Correlation between flow rate and surface
elasticity of whole resting saliva after 2 0min
Fig. 4.6 Correlation between flow rate and surface
viscosity of whole resting saliva after 2 0min
Fig. 4.7 Surface elasticity against time for whole
saliva from male and female subjects
Fig. 4.8 Surface viscosity against time for whole
saliva from male and female subjects
Fig. 4.9 Elasticity against time for whole saliva with
ORSSR ring positioned in the surface and
in the bulk
Fig. 4.10 Viscosity against time for whole saliva with
ORSSR ring positioned in the surface and
in the bulk
Fig. 4.11 Surface elasticity against time for whole
resting saliva from one individual and
from 1 0 different individuals
Fig. 4.12 Surface viscosity against time for whole
resting saliva from one individual and
from 1 0 different individuals
Page
137
138
139
140
Table 4.1 Scaling and attenuation factors for whole saliva
and saliva substitutes
Table 4.2 Descriptive statistics of whole resting saliva samples
Table 4.3 Coefficients of variation for rheoiogical values of whole resting saliva and 1% Na CMC
121
122
142
Chapter 5 The surface rheology of human parotid saliva
Fig. 5.1 Diagrammatic representation of the structure
of a Carlson-Crittenden cup 149
Fig. 5.2 Surface elasticity against time for stimulated
parotid saliva 152
Fig. 5.3 Surface viscosity against time for stimulated
parotid saliva 154
Fig. 5.4 Photograph of the surface film of parotid saliva 155
Fig. 5.5 Surface elasticity against time for whole resting and
stimulated parotid saliva from one individual 156
Fig. 5.6 Surface viscosity of whole resting and stimulated parotid
saliva from one individual 157
Fig. 5.7 Surface elasticity against time for stimulated parotid saliva
Page Fig. 5.8 Surface viscosity against time for stimulated parotid saliva
with ORSSR ring positioned in the surface and
in the bulk 159
Fig. 5.9 Surface elasticity against time for parotid
saliva from one individual tested immediately
after collection and after storage for 1 hr 161
Fig. 5.10 Surface viscosity against time for parotid
saliva from one individual tested immediately
after collection and after storage for 1 hr 162
Fig. 5.11 Surface elasticity against time for parotid
saliva tested immediately after collection
and after freezing and storage at -20°C and -70°C 163
Fig. 5.12 Growth of surface elasticity over 1 BOmin for
parotid saliva after freezing and storage at -20°C and -70°C 165
Fig. 5.13 Surface viscosity against time for parotid saliva tested immediately after collection
and after freezing and storage at -20°C and -70°C 166
Fig. 5.14 Growth of surface viscosity over 1 BOmin for
parotid saliva after collection and after
freezing and storage at -20°C and -70°C 167
Fig. 5.15 Surface elasticity against time for stimulated
parotid saliva frozen at -20°C and diluted in
normal saline 169
Fig. 5.16 Surface elasticity of parotid saliva diluted in
saline at 1 hr, 2hr and 3hr 171
Fig. 5.17 Surface viscosity against time for stimulated parotid saliva frozen at -20°C and diluted in
normal saline 172
Table 5.1 Scaling and attenuation factors used in the
Chapter 6 Prelim inary characterisation of the
surface film of human parotid saliva Fig. 6.1 Isolation of the surface film
Fig. 6.2 Comparison of surface elasticity of parotid
samples taken some months apart
Fig. 6.3 Comparison of surface viscosity of parotid
samples taken some months apart
Fig. 6.4 Comparison of surface elasticity of frozen
diluted parotid samples taken some months apart
Fig. 6.5 Comparison of surface viscosity of frozen
diluted parotid samples taken some months apart
Fig. 6 . 6 Correlation between surface elasticity of parotid saliva
and the temperature on the day of sample collection
Fig. 6.7 Correlation between surface viscosity of parotid saliva
and the temperature on the day of sample collection
Fig. 6 . 8 Photographs comparing the SDS gel profiles
of parotid saliva and the surface film
Page
180
185
186
187
188
190
191
192
Table 6 . 1 Constituents of the heavy and light acrylamide solutions for
preparation of gradient gels 182
Chapter 7 General discussion and future w ork
Fig. 7.1 How surface film formation may influence
rheoiogical values obtained from cone and
CHAPTER ONE
INTRODUCTION
1.1 Introduction
Saliva is a complex fluid having numerous functions which make it essential
for oral health. There Is a tendency to take saliva for granted and it is only
following a diminution in flow that the full spectrum of its properties becomes
apparent to patients as a wide range of symptoms become manifest (Fox et
al. 1985). Many of these symptoms can be attributed to a loss of oral
lubrication and yet little is known about the physical properties of saliva
which perform this function.
Currently available saliva substitutes may offer symptomatic relief for some
patients but they are not perfect and their rheoiogical properties are very
different from those of saliva.
It has become apparent that saliva is not a homogeneous fluid which simply
washes over the tissues but one which exists in thin films (Collins and
Dawes 1987) moving slowly over the tissues (Dawes et al. 1989) and which
may also form a tough surface film at the air-saliva interface (Waterman et
al. 1988).
Investigation of the physical properties of saliva requires collaboration
between scientists from different disciplines since the mathematics
associated with the rheology is extremely complex and beyond the training
of most clinicians.
In this review of the literature the general features of saliva, its rheoiogical
properties and their implications for the development of saliva substitutes
1.2 Saliva
Whole saliva is a complex fluid derived from four different types of salivary
glands but which also contains gingival crevicular fluid, bacteria and both
cellular and food debris (Dawes 1974). The composition of saliva varies
according to its level of stimulation and throughout the animal kingdom
different species produce saliva specifically suited to their requirements. In
man the daily production of saliva is approximately 500-600ml (Jenkins
1978) but ruminants may produce 200 litres of a watery saliva secreted
mainly from the parotid glands, whereas ant eaters and armadillos produce a
very sticky secretion from enlarged submandibular glands.
In man the parotid glands contribute approximately 25% of resting saliva
volume (approx. 0.5ml/min) and 45% of whole stimulated saliva flow (approx.
2.5ml/min) (Dawes and Ong 1973). The submandibular and sublingual
glands contribute approximately 70% of unstimulated flow and 50% of
stimulated flow. The remainder is supplied by numerous minor salivary
glands (Dawes 1974).
1.2.1 Functions of Saliva
The functions of saliva are summarised in Table 1.1 and are reviewed in
detail by Mandel (1987). Their importance is clear from the variety of
symptoms which may be associated with inadequate salivary flow (Fox et al.
1985) including mucositis, bad taste, halitosis, difficulty with eating, speech,
swallowing and managing dentures. Hyposalivation is also associated with
Principle Functions of Saliva
1. General i) General flushing and lavage action
2. Digestion i) Lubrication / bolus formation ii) Taste - solubilisation of food
iii) Breakdown of carbohydrate in stagnation areas
3. Protective i) Decreased permeability of the oral mucosa ii) Prevention of proteolytic enzyme damage
iii) Provision of ions for enamel maturation iv) Possible enhancement of wound healing
V) Acceleration of blood coagulation Vi) Pellicle formation
4. Anti-microbial i) Secretory IgA ii) Lysosyme
iii) Lactoferrin iv) Lactoperoxidase
5. Maintenance of pH Related largely to the concentration of bicarbonate.
The pH may be as low as 5.3 at low flow rates,
rising to 7.8 at high flow rates.
6. Maintenance of water balance - via sensation of thirst
1.2.2 Mechanism of salivary secretion
Saliva Is secreted by the salivary glands in a two part process. During the
first stage most of the protein, electrolytes and all of the water are added
within the acinae (Fig. 1.1) and this results in the formation of a secretion
which is isotonic to plasma. The second stage occurs as the saliva travels
down the salivary ducts before being secreted into the mouth. The
composition of the electrolytes is altered with reabsorption of most of the
Na+ and Cl" whilst some K+ and HCO3" enters the saliva so that by the time
the saliva enters the mouth it is hypotonic to plasma. The secretion of saliva
is controlled via the autonomic nervous system (Baum 1987; Garrett 1987)
with stimulation by the sympathetic pathway causing a secretion which is
richer in protein than that produced by parasympathetic stimulation.
electrolytes
protein water
H co;
Na
isotonic
Acinus Ducts
hypotonic secretion
Fig. 1.1 Schematic representation of saliva secretion.
As the flow rate increases the composition of saliva alters with the most
marked fall in the concentration of Mg2+ and PO4 3". The effect on protein
concentration is more complex with an initial fall in concentration but this is
rapidly followed by a marked rise with parotid saliva demonstrating a rising
protein content associated with increasing flow rate (Dawes 1969).
Examination of the graphs for the 10 subjects used in the above study
indicates that the protein concentration of the saliva was decreasing during
the lOmin collection of saliva prior to the commencement of stimulation. This
may indicate that the collection cups (see section 5.3.1) were causing a
degree of stimulation so that resting values were never achieved. The initial
fall in protein concentration observed may therefore be more pronounced
than is really the case.
1.2.3 Methods of collecting saliva
There are many factors which can affect the salivary flow rate (Table 1.2)
and these must be controlled as carefully as possible when collecting saliva
for diagnostic or research purposes.
Saliva may be collected either as whole saliva or as the secretion from
individual glands under resting or stimulated conditions. The advantages of
collecting whole saliva are that:
i. It can be easily collected by dribbling into a container (Navazesh and
Christenson 1982).
ii. It is thought to be the secretion which is most representative of the oral
environment since for most of the day the mouth is bathed in resting whole
saliva. This gives it an important role in protecting the oral tissues
Factors which influence salivary flow rate
Important factors
Level of hydration/dehydration
Previous stimulation /relationship to food and drink
Time of day (circadian variation)
Drugs
Pathological conditions
Adequate light
Body posture
Less important or unproven factors
Gender
Age
Circannual variation
Table 1.2 Factors which should be taken into consideration when collecting
saliva.
Saliva from the parotid glands can be relatively conveniently collected using
suction retained devices (Carlson and Crittenden 1910; Lashley 1916) which
The secretion from the submandibular and sublingual glands are generally
collected as a combined secretion (since the gland orifices are anatomically
close together) using devices which are individually constructed for each
subject (Schneyer 1955). It seems inevitable that such an appliance covering
the floor of the mouth will cause a degree of stimulation from these glands
making true resting flow almost impossible to collect.
An alternative and elegant approach to the problem of making acrylic
collection devices for each patient has been described and involves adapting
dental elastomeric impression materials closely to the sublingual area and
passing a fine plastic tube through the material to exit close to the gland
orifices (Oliveby et al. 1989). These workers report that such a device can
be worn for 140min without discomfort. A further development has been the
description of a similar method involving a small prefabricated collecting unit
which is placed over the duct and held in place with dental impression
material in a modified tray (Nederfors and Dahlof 1993).
Minor salivary glands are widely distributed throughout the oral cavity except
for the anterior part of the hard palate and gingivae. Their secretions can be
coiiected in very small volumes by isolating an area of mucosa, usually the
labial mucosa, and collecting secretions from glands using either
micropipettes or filter paper (Spiers 1984).
Stimulation of saiivary flow can be achieved by using citric acid, citrus fruit
flavoured sweets or by asking subjects to chew a bland gum such as
polyvinyl acetate. Chewing rate can be standardised with a metronome if
1.2.4 Which Is the most appropriate secretion to collect?
Whole saliva may not be as representative as previously thought (Navazesh,
Christensen, and Brightman 1992) since there is now evidence that saliva
does not flow evenly over the oral tissues. Two studies have shown that
saliva remains relatively well localised both under resting conditions using
fluoride as the marker (Weatherell et al. 1984) and also under stimulated
conditions using chewing gum Impregnated with the food dye erythrosine
(Hector and Sullivan 1992). It was found that there was little migration of
stimulated saliva from one side of the mouth to the other with even the
midline of the tongue not being crossed in 40% of the subjects.
If different types of saliva remain comparatively well localised It may be that
parotid saliva is more important for protection of the buccal mucosa whilst
submandibular/sublingual saliva is Important for protecting the tongue and
floor of the mouth and unilateral oral lesions might be related to deficient flow
or content of saliva from the glands on that side of the mouth.
Until there is a better understanding of the mechanisms by which the
protective functions of saliva are performed the type of saliva to be collected
must be determined according to the requirements of each individual study.
In some cases this may be whole saliva and in others the collection of saliva
from individual glands under resting and stimulated conditions.
1.2.5 Saliva film thickness
It is now apparent that saliva exists in the mouth in thin films (Collins and
from the difference between the volume of saliva in the mouth before
(approx. 1ml) and after swallowing (approx. 0.75ml) (Lagerlof and Dawes
1984) and determining the thickness of the film if this volume was spread
evenly over the oral structures. The surface area of the oral structures
(approx. 215cm2) having been calculated from the weight of foil required to
cover a model of the mouth (Collins and Dawes 1987). This is an interesting
approach to a difficult problem although there is an assumption that the
residual volume of saliva left in the mouth was removed by rinsing the mouth
with 5mI of distilled water. Using the estimated values above the rate of
movement of the salivary film across the tissues was calculated to be in the
order of 0.8 - 8mm/min and was thought to increased 2 - 40 times during
peak flow rates (Dawes et al. 1989).
In addition to the thin film of saliva there is also a thicker more adherent layer
attached to the oral hard and soft tissues, the oral mucous coat (Slomlany et
al. 1989; Slomlany et al. 1986) (see section 1.3.4) which is composed
largely of salivary macromolecules.
1.3 Salivary macromolecules
1.3.1 General features of glycoproteins
Glycoproteins are complex molecules composed of a polypeptide central
core to which short irregular branched or unbranched heterosaccharide side
chains are covalently bound. The protein core is not uniformly glycosylated
but contains areas which are devoid of polysaccharide side chains, termed
"naked" areas, which are more susceptible to proteolytic action. These
residues and hydrophobic amino acids contrasting with the highly hydrophilic
glycosylated areas. The glycosylation of glycoproteins maybe either random
or biased (Fig. 1.2) which may impose a functional heterogenicity between
different areas of the same molecule which in turn may have implications for
the function of different glycoproteins.
Naked area Carbohydrate sidechains
COOH
a. Random glycosylation of a glycoprotein
NHj — ' COOH
b. Biased glycosylation of a glycoprotein
Fig. 1.2 Patterns of glycosylation of glycoproteins.
The heterosaccharide side chains of glycoproteins are relatively short (2-20
units). The most characteristic carbohydrate constituent is N-acetylneuramic
acid (sialic acid) which is both a sugar and an amino acid. It has a strongly
acidic carboxyl group (pk = 2.6) which confers acidic properties and a net
negative charge on the whole glycoprotein molecule at a physiological pH
stretching out the side chains in an aqueous environment and its shape has
been likened to that of a bottle brush. The glycoproteins in saliva and other
body fluids such as synovial fluid and the secretions of the respiratory,
gastrointestinal and reproductive systems are responsible for many of the
physical properties since the molecules tend to be bulky and interact with
each other via a number of different types of bonds (Tabak et al. 1982):
a. Calcium bridges between negatively charged groups.
b. Disulphide bridges (intra and inter chain).
c. Ionic interactions between carboxyl groups and amino acid residues.
d. Hydrophobic - hydrophobic interactions.
e. Repulsion by negatively charged heterosaccharide side chains.
1.3.2 Mucus glycoproteins
Glycoproteins have an important role to play in the interaction of cells with
their environment. The cell membrane is composed of a lipid bilayer which
contains integral glycoproteins (Singer and Nicolson 1972) and these may
extend beyond the cell for up to SOnm into the intercellular space (Strous
and Dekker 1992). In situations where greater protection is necessary such
as in the alimentary tract additional protection and regulation of diffusion is
provided by epithelial cell secretions rich in mucus glycoproteins (Mol. Wt in
the region of 1 0® or greater).
Whilst those working in the field of salivary research are concerned about
the volume of secretion that can be obtained from individual glands and of
contamination of whole saliva these difficulties seem minor compared with
gastric mucus is so difficult to obtain most research has been carried out on
animals and particularly pig gastric mucus. The mucus may be obtained by
one of three different techniques (Allen and Snary 1972);
1. Isolation from gastric washouts.
2. Isolation from gastric scrapings.
3. Isolation from enzymatic digestion of the gastric mucosa.
Caution is required when extrapolating the properties of one type of
secretion to another situation and species, as has frequently been done,
since the function of each secretion is different. A comparison of the
molecular weights of the components of various glycoproteins from different
body systems are given in Table 1.3.
Soluble glycoproteins are responsible for creating a viscous gel that contains
large amounts of water and such gels cover the epithelium of the alimentary,
respiratory and reproductive tracts. Many oligometric units occur, in these
situations, following the formation of di-sulphide bridges. These bonds
appear to be vital for Increasing viscous properties since their reduction
produces a lowering in viscosity of gastrointestinal secretions of about 75%
(Allen and Snary 1972).
The protective and physical properties of a mucus layer will be influenced by:
1. The concentration of glycoproteins.
2. The structure of the glycoproteins.
3. The presence of other molecules such as non mucin, noncovalently bound
proteins.
4. Lipids.
5. Ionic conditions.
Mucin Backbone Monomer Oligomer
Cervix 0.18 2.0-2.5 10-15
Rat Gastric 0.27 0.9 1.8-3.6
Human Gastric 0.9 2 . 0 4.0-6.0
Submandibular 0.06-0.1 0.5-2.5 2.0-5.0
Trachea 0 . 1 0.5-0.6 9.0-16.0
Table 1.3 Size (10® KDa) of mucin glycoproteins (Adapted from (Strous and
Dekker 1992)).
1.3.3 Salivary mucins
The study of salivary mucins and their function has been dominated by a
group of researchers from New York (Tabak et al. 1982). They have
identified two salivary mucins which they have designated MG1 (Mol. Wt.
> 1Q6) for the higher molecular weight mucin and MG2 (Mol. W t.- 2x10^) for
the lower molecular weight molecule. Since both mucins can be identified in
the minor salivary gland secretion they suggest that these mucins are the
products of mucous acinae. A summary of the salient points concerning the
Comparison of structure and proposed functions of salivary mucins
MG1 Structure
Molecuiar weight > 10®
Larger oligosaccharide subunits
Contains naked domains, hydrophobic
More sulphate, less sialic acid than MG2
Covalently bound fatty acids
S-S bonds
“ Early” tissue pellicie formation
a. permeability barrier
i) protection against desiccation
ii) protection against environmental insult
b. viscoelasticity c. lubrication
d. concentration of protective molecules at
the tissue environmental interface
i) lysozyme
ii) s IgA
iii) phosphoproteins
MG2 Structure
Molecular weight = approx. 2x10®
Smaller oligosaccharide subunits
Uniform iy glycosylated
Bacterial pellicle formation
a. microbial clearance
b. co-aggregation
Table 1.4 Proposed structure and functions of salivary mucins from
The above authors have sought to investigate the link between structure and
function of salivary mucins and many of the reports produced have been
extremely good review articles but the evidence for the link between the
structural properties of these molecules and their function appears
somewhat circumstantial. The evidence for the structure of the
oligosaccharide structures of MG2 appear to be based on the results of one
individual and the paper does not state how many samples were taken
(Reddy, Levine and Prakobphol 1985). The basis of assigning the property
of concentrating protective molecules at the hard tissue surface to MG1 is
based on in vitro studies which have demonstrated that MG1 has a higher affinity for synthetic hydroxyapatite than MG2 (Tabak et al. 1985). These
authors suggested on the basis of the above findings that MG1 functions at
the hard and soft tissue interface to provide a permeability barrier for
protection against environmental insult and desiccation (Tabak et al. 1982).
Whilst this may indeed be the case the above study does not prove it.
It appears that at present there is relatively little firm scientific evidence to
support the proposed functions of MG1 and MG2. It should also be
remembered that saliva is not a homogeneous fluid and that isolating two
glycoproteins and investigating their functions ignores the possibility of
synergistic interactions which are likely to occur between the wide variety of
molecules and ions present in saliva.
In addition to contributing to the lubricating properties of saliva glycoproteins
in saliva also serve to reduce the permeability of the mucosa and have
important functions in restricting access of potential irritants and carcinogens
Adams (1974) demonstrated that fluorescent dyes failed to significantly
penetrate the oral epithelium in rats and rabbits unless salivary flow was
inhibited by hyoscine hydrobromide. The fluorescent dye (N-acetyl cysteine)
penetrated non-keratinised mucosa to a greater extent than keratinised
mucosa and removal of the mucopolysaccharide layer covering the
superficial cells of the oral mucosa, using mucolytic agents, also increased
the permeability of the mucosa.
It seems likely that salivary components are also important in the formation
of a barrier which protects the oral mucosa against the effects of proteases
which are present in the mouth. Proteolytic enzymes are produced from both
plaque bacteria and polymorphonuclear leukocytes which are released into
the mouth via the gingival crevice or periodontal pocket and might be
expected to cause considerable tissue damage. Glycoproteins are ideally
suited to this protective function since the protein core of the mucins and
glycoproteins is protected from the action of proteases by the carbohydrate
side chains. Cysteine-containing phosphoproteins (Shomers et al. 1982)
and Cathepsin G (Ohisson et al. 1984) also have antiproteolytic activity and
are both present in saliva.
1.3.4 Mucus Coat
Salivary components become adsorbed to both the hard and soft tissues of
the oral cavity. In the case of the teeth this film is known as the acquired
dental pellicle and is rich in saliva derived proteins, glycoproteins and lipids,
in the case of the soft tissues it forms the mucus coat. (Mandel 1977;
The proteins and glycoproteins present are thought to be responsible for the
susceptibility of the enamel surface to bacterial colonisation and the lipids for
its hydrophobic properties (Slomiany et al. 1986). These films are
considered to have important roles in the defence of both the hard and soft
tissues (Slomiany et al. 1989; Tabak et al. 1985).
The rheological properties of saliva will determine its ability to coat the oral
surfaces and provide lubrication during speaking and eating. It would seem
appropriate for such rheological properties to be taken into account when
designing synthetic saliva substitutes.
1.4 Rheology
Rheology is the science which is associated with the study of flow and
deformation of materials and has huge practical applications in many fields
including the food, paint, petrochemical and pharmaceutical industries as
well as medicine and biology.
The relationship between the stress applied to a material and the
consequent movement obeys highly complex mathematical equations. This
has correctly led to the opinion that rheology is a subject which is "viewed as
being of prohibitive complexity by scientists without a strong mathematical
background" (Barnes, Hutton, and Walters 1989).
One consequence of this situation is that the rheology of saliva has not been
studied as extensively as would seem appropriate since the functions of
Liquids maybe broadly divided into two types, Newtonian and non-
Newtonian depending on their properties.
1.4.1 Newtonian Liquids (e.g. glycerine and water)
Newtonian liquids are relatively simple with the rate of flow being
proportional to the applied stress. If two parallel plates are separated by a
Newtonian fluid (Fig. 1.3) and the upper plate is made top move a velocity
gradient is established within the liquid. The velocity of the layer of liquid
immediately above the stationary plate is slowest and the layer immediately
beneath the moving plate most rapid.
The force required to produce the movement (force/unit area = shear stress
= a) is proportional to the velocity gradient (or shear rate = y ). This means
that if you double the stress you double the rate of movement. Clearly for a
given stress different liquids will move at different rates and this is due to
variation in the internal friction or viscosity (t]). The relationship between
these factors can be expressed as;
a = T]y
There is therefore a direct proportionality between the shear stress (a) and
shear rate (7 ) with the viscosity (ti ) being the constant which can be
expressed graphically (Fig. 1.4). The graph of shear stress against shear
rate for Newtonian liquids is a straight line which passes through the origin.
This means that the viscosity of a Newtonian fluid can be determined from
the shear rate obtained at one shear stress. This is an essential difference
between Newtonian and non-Newtonian fluids since for non-Newtonian fluids
Velocity
Force
B
Fig. 1.3 Representation of Newtonian flow. A velocity gradient is established
in the liquid with the layers of liquid nearest plate A moving most rapidly.
1.4.2 Non-Newtonian liquids
Non-Newtonian fluids are more complex and do not obey the same law as
Newtonian fluids because their shear rate is not directly proportional to the
shear stress. Saliva is a typical example of a Non-Newtonian fluid since the
large macromolecules which it contains must slide past each other for the
saliva to flow. The following properties are considered to be important in
determining the Non-Newtonian properties of a solution (Glicksman 1969):
1. Particle shape.
2. Particle size.
3. Particle concentration.
4. Particle flexibility and ease of deformation.
5. Solvation of the particles by the continuous phase.
Shear
stress Viscosity
Shear rate
Shear rate
Fig. 1.4 Newtonian flow curves.
These criteria can readily be applied to solutions containing
macromolecules. There are a number of different general patterns of flow for
non-Newtonian fluids and these are illustrated in Fig. 1.5.
Shear stress
Plastic
Pseudoplastic
Newtonian
Dilatant
Shear rate
Fig. 1.5 Shear stress against shear rate rheograms for Newtonian and Non-
1. Plastic fluids have an initial resistance (yield stress) which must be
overcome before flow starts and the fluid thereafter behaves as a Newtonian
fiuid.
2. Pseudoplastic (shear thinning) fluids (such as saliva) flow more easily as
the shear rate increases. Thixotrophy is a property closely allied to
pseudoplastic behaviour whereby the viscosity increases again following a
period of rest and removal of the shear stress (e.g. non drip paint). The
viscosity of a thixotropic fluid will therefore be dependent not only on the
shear rate but also on the amount of shearing that has taken place
previously. This results in the appearance of a hysteresis loop on a
rheogram (Fig. 1.6) which is a very informative method of presenting
rheological data for non-Newtonian fluids such as saliva (Roberts 1981).
Shear stress
Shear rate
3. Dilatant (shear thickening) fluids behave in the opposite way to
pseudoplastic fluids with the apparent viscosity increasing with higher shear
rates.
In addition to differences in viscosity, or the friction within different fluids,
Non-Newtonian fluids may also have elastic properties which instil a degree
of elastic recoil to the fluid. This property is the equivalent of Young’s elastic
modulus for a solid. If a force is applied to an elastic (Hookean) solid it will
undergo a deformation such that.
Force = Elastic modulus x Displacement (y). (a = G.y)
Materials which obey Hookes Law can be described as ideal elastic or
Hookean solids and the coefficient of proportionality is the shear modulus of
the elasticity.
1.4.3 Viscoelastic liquids
There is a large group of materials including many biological fluids which
exhibit both viscous and elastic properties. The situation is further
complicated by the fact that at low stresses the material may behave
essentially as an elastic solid whilst under higher loads it may behave as a
fluid. This is because such materials have a structure composed of a solvent
and various large macromolecules which may be joined chemically or be
physically tangled. The interactions of the macromolecules will significantly
Viscoelastic fluids also exhibit the unusual properties of:
i. Expanding when shot out of a smali opening as a jet instead of contracting
as most fiuids do.
ii. The Weisenberg effect, the viscoelastic fluid climbing up a rotating stirrer
rather than being thrown out by the centrifugal forces .
It can be difficult to compare studies of non-Newtonian visco-elastic fluids,
such as saliva if different shear stresses have been used. This is because
uniike Newtonian fluids the rheoiogical properties at one shear stress do not
predict the rheological properties at another. Bulk rheological studies of
biological materials should therefore be undertaken at a variety of shear
stresses inciuding those that maybe encountered physiologically. This is a
problem when studying saliva since the physioiogical forces encountered
have not been clearly established. This situation wiil be complicated even
further by the fact that when the shear stress is altered such as during
mastication the composition and volume of saliva also changes. These
changes in volume and composition will not be purely related to improving
lubrication but also to other functions such as buffering capacity.
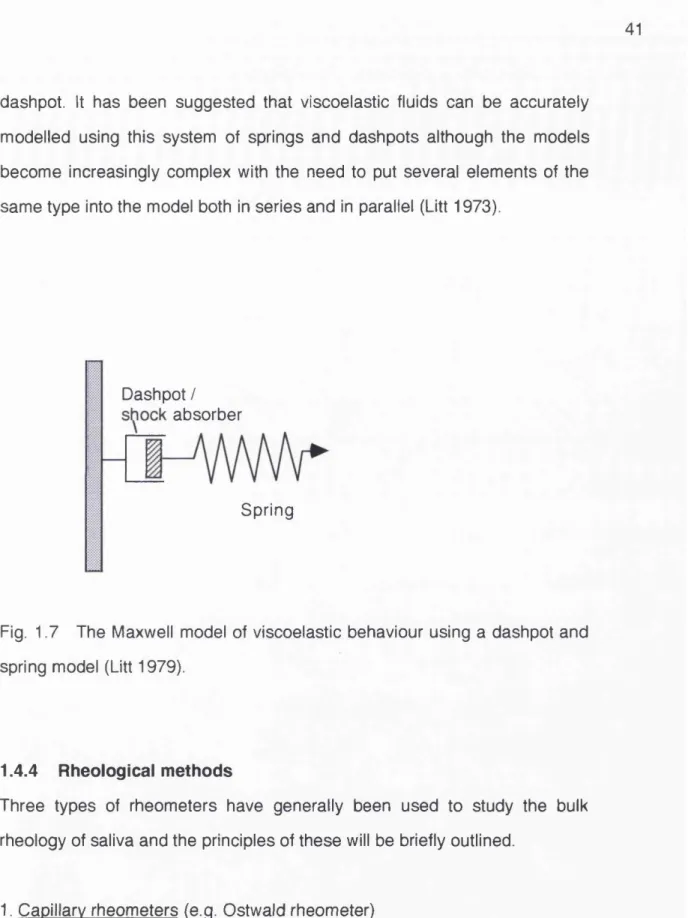
The behaviour of a viscoelastic fiuid can be described in terms of a spring
which represents the eiasticity and a hydraulic damper which represents the
viscous element (Fig. 1.7).
It can be seen from this simplified model that the behaviour of the fluid will
depend upon the speed at which it is made to flow. If the flow is very slow it
will be limited by the viscous aspect of the fluid (the dashpot). However at
greater loads the spring will be extended and flow will continue after the
dashpot. It has been suggested that viscoelastic fluids can be accurately
modelled using this system of springs and dash pots although the models
become increasingly complex with the need to put several elements of the
same type into the model both in series and in parallel (Litt 1973).
Dashpot / absorber
Spring
Fig. 1.7 The Maxwell model of viscoelastic behaviour using a dashpot and
spring model (Litt 1979).
1.4.4 Rheological methods
Three types of rheometers have generally been used to study the bulk
rheology of saliva and the principles of these will be briefly outlined.
1. Capillary rheometers (e.g. Ostwald rheometer)
Capillary rheometers can be used to determine the viscosity of Newtonian
fluids either by measuring the time it takes for a liquid to run through a
capillary tube or by timing how long it takes a ball to sink a known distance
not enable different shear rates to be used and as already discussed there is
little value In assessing the viscosity of a non-Newtonian fluid at one shear
rate (Davis 1971).
2. Rotational rheometers
The advantages of rotational rheometers are chiefly that fluids can be
studied at different shear rates and that time dependent changes can also be
investigated.
a. Cone and plate (Fig. 1.8) (e.g. Weisenberg rheometer)
Cone and plate rheometers work by having one part that rotates separated
from a measuring device by the test fluid. The plate is made to rotate either
continuously or in oscillation and the character of the movement of the cone
is used to determine the rheological properties of the test fluid. The angle
between the cone and the plate is approximately 1-2°.
b. Pendulum-bob (Fig. 1.9) (e.g. Brookfield rheometer)
The cup and bob rheometer, which may require up to 150ml of a sample
fluid, enables the rheological properties of a fluid to be determined by
measuring the amount of distortion that occurs to a spring when the bob is
immersed in the test fluid and forced to rotate or oscillate .
1.5 Bulk rheology of saliva
The bulk rheology of saliva has been studied by numerous workers and
some of these studies are summarised in Table 1.5. However despite the
number of studies many of them suffer from severe limitations particularly
the early studies in which the capillary tube viscometers were used (Mizuma
Cone
Test flui
Fig. 1 . 8 Components of a cone and plate rheometer
Test fiuid
Motor and measuring spring
Fig. 1.9 The cup and bob viscometer consists of a bob which immersed in
(Willsmore 1937)
(Mizuma 1937)
(Schneyer 1955)
(Schroeder 1964)
(Makila and Vaaja 1966)
(Makila1969)
Whole resting 1904, mostly
school children
viscosimeter
Ostwald viscosimeter
N/A
Whole stimulated 1
1% acetic acid
Parotid stimulated 1 1% acetic acid
Submaxillary stim 1
1% acetic acid
Modified Ostwald. N/A
no details of method given
Sublingual stim 1% acetic acid
1
Whole resting 10 subjects on 3 Modified Hess
18.5°C
N/K
30°C
occasions
Whole stimulated 109
Whole stimulated 35
(wax) (capillary viscometer) Epprecht rotational viscometer Epprecht rotational viscometer
N/A 20°C
water pressure of 100cm
200 rpm
200 rpm
N/K
N/K
approx. 3 (units not given)
Relative value =
a p p r o x . 1. 31
(units not given)
2.9 cP
1.5 cP
3.4 cP
13.4 cP
2.07+/- 0.55 but units not given
1.38-1.67 cP
Marken 1970) whole saliva
(Davis 1971 ) saliva type not
given
(Marriott and Irons 1974)
(Roberts 1977)
Whole saliva from anaesthetised cats
Volume N/K. Whole resting
(Balmer and Hirsch 1978) Whole stimulated
(plastic disc)
(Marks and Roberts 1983) N/K
2. Stressman
healthy male, Ferranti-Shlrley
number of cone and plate
samples not given viscometer
65
20 dentate subjects
20 adults
N/K
Weisenberg
Cone and plate viscometer
Wells Brookfield rotational viscometer Weissenberg Capillary viscometer Brookfield rotational viscometer
352 rpm
1500 sec"1
2 . 5 - 1 0 - 3 Hz
0.27 dyn cm'2 (shear sress)
1- lOOOsec"^
1.15 - 5.75 sec'"*
25°C
37°C.
100% humidity
1 1 . 5 - 2 3 0 sec-1 37=C
Room temp
37°C 80% humidity
Torsion pendulum o.l- 2.5 Hz
0 . 9 5 - 4 . 1 3 cP
5 c P
40 000 cP
C. 100 cP
1 4 - 3 c P
45 - 2 cP
95 cP
150-50 cP
55 - 0.4 cP
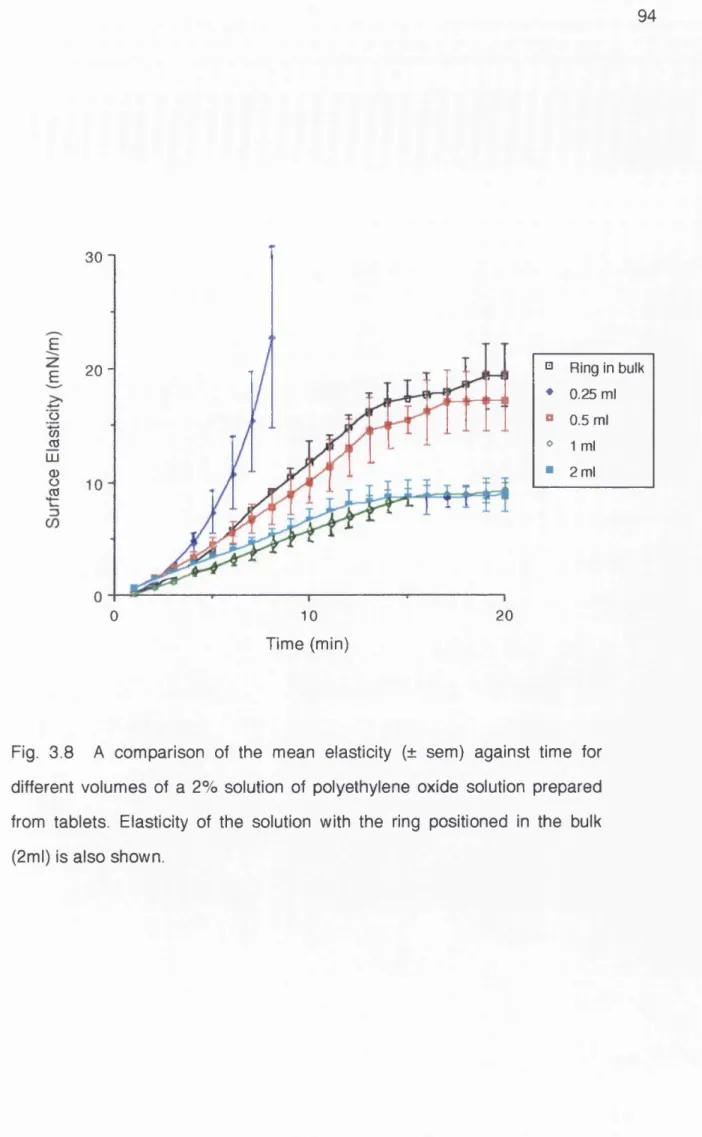
(Vissink et al. 1984) 3m 1 whole resting each
Contraves Low Shear + Rheoscan. Pendulum bob
1.75 X 10’2 sec'"* - 94.5sec'*
35°C surface covered with paraffin
1 0 - 2 . 5 C P
(Schwarz 1987) Whole stimulated
chewing gum
1 young female Weissenberg
rheogoniometer
10"3. 1 o^sec^ 25°C
37°C
c 10 0 0 0 - 7 . 2 cP c 10 000.- 2.9 cP
(Waterman et al. 1988) Whole resting
Stimulated (acid) submandibular
Stimulated parotid
7 males Contraves Low
Shear 30
(Pendulum / bob)
70 Hz- 200 kHz 25°C 1.1 c P - 0 . 9 5 c P
(Van der Reijden, Veerman and Amerongen 1993)
Resting Whole Parotid Sublingual Submandibular Palatal
7 healthy subjects Oscillating capillary
rheometer
0.5H z
Range of 1 - 300 s e e l
37°C
1 . 6 - 1 . 4 8 cP
0 . 8 - 0 . 8 cP
4.63 - 2.93 cP
1.49 - 1 . 3 9 cP
1.81 - 1 . 6cP
Table 1.5 Summary of studies investigating the bulk rheological properties of saliva.
considered inappropriate for the study of non-Newtonian fluids (Davis 1971).
Later studies using rotational rheometers have produced more useful data
but many still give inadequate data on saliva collection techniques and
perhaps the most widely quoted and influential reference on the rheology of
saliva (Davis 1971) does not state the type of saliva studied.
There has also been a wide range of shear rate used in these studies which
reflects the uncertainty surrounding the shear rates which occur in vivo. One
attempt to calculate the shear rates in vivo concluded that during talking and
swallowing shear rates may reach 160 - 120 sec"*^ respectively (Balmer and
Hirsch 1978). This means that a number of studies have used shear rates
much higher than would occur in vivo (Hedegard, Liedgren and Marken
1970; Makila 1969; Makila and Vaaja 1966).
Clearly it is advantageous to study saliva at a range of shear rates which
includes those experienced physiologically (Schwarz 1987). The situation is
further complicated by the fact that whilst the shear rate alters according to
function so does the composition of the saliva in relation to the degree of
stimulation. Interestingly early studies tended to use admirably large
numbers of subjects (up to 1904 in one study (Mizuma 1937)) whilst later
studies have used fewer samples, in one case only two (Vissink et al. 1984).
Accepting the limitations of some studies there are conclusions which can be
drawn from the combined data. These include:
1. Saliva exhibits shear thinning properties (the higher the shear rate the
lower the viscosity). The shear thinning nature of saliva is considered to
surfaces, in the same manner as non drip paint, and under greater loads
saliva has a lower viscosity which may be beneficial when swallowing and
talking (Schwarz 1987).
2. At low shear rates the viscosity is very high (40 000 cP at lO '^H z in one
study (Davis 1971)).
3. At high shear rates the viscosity of saliva may fall as low as IcP which is
the viscosity of water.
There is nonetheless the need for a definitive study with adequate numbers
of subjects in which the saliva has been collected under standard conditions
and is tested immediately after collection under a range of shear rates. Many
of the limitations in the studies in Table 1.5 are likely to have arisen for two
reasons;
i. Clinicians with an interest in salivary physiology often lack the access to
rheometers and generally do not have the knowledge necessary to fully
interpret the data.
ii. Those interested in the physics do not have ready access to clinical
samples and due to health and safety legislation may not be able to handle
them.
In addition to contributing to bulk rheological properties macromolecules may
also contribute to the formation of a surface film at the air liquid interface and
1.6 Surface film formation
It has been established for many years that large macromolecules in
solutions become concentrated at the air liquid interface (Joly 1939). A
surface film formed at a solvent-oil interface has been visually demonstrated
(Shotton and White 1963) using solutions of acacia. By taking
photomicrographs of a drop of ageing acacia solution they were able to
demonstrate folding of the surface layer when a little of the acacia solution
was withdrawn from the drop, decreasing the volume and therefore causing
the surface film to crease.
At the surface such molecules form a surface film that may have viscoelastic
properties which can be measured using specialist rheological techniques
(Warburton 1993). Surface films may be either:
i) Stationary - formed immediately on standing and not increasing with time.
ii) Non-stationary - increasing in strength in a time dependant manner. The
rate of growth of such a surface film may be dependent on a wide range of
variables such as the type of solute, its concentration, ionic concentration of
the solvent, pH and temperature.
Within a solution the solute molecules will migrate to the surface where the
molecules thermodynamically have a lower free energy than those in the
bulk and therefore tend to remain there. Because the molecules at the
surface have a conformation with a lower energy they tend to lose their
association with the solvent molecules which serves to further lower the free
becomes further stabilised with unfolding of the surface molecules and
becomes more viscous than the bulk (Warburton 1972).
If the molecules have a high charge density they will tend to repel each other
and the film will be predominately viscous with the properties determined by
the size of the molecule involved, its shape and its concentration.
If the molecules do not have a high charge density they will be able to form a
tightly intertwined network possibly with chemical bonding between the
molecules and the formation of a "solid" viscoelastic film (Kerr and
Warburton 1985).
Clearly for saliva the situation will be highly complex given the wide range of
macromolecules and ions present. It would seem likely that most of the
glycoproteins will have a high negative charge due to the large amount of
sialic acid present which one might expect to prevent a close association
between the molecules. However divalent Ions such as calcium may play a
role in film formation as they have been shown to increase the viscosity of
tracheal mucus (Marriott, Shih and Litt 1979).
The formation of a surface film at the air-saliva interface has only been
reported in the literature by two groups of workers (Barnes 1988; Waterman
et al. 1988 ). Waterman et al. (1988) in an excellent study investigated the
surface film formation of mixed resting saliva, stimulated submandibular and
stimulated parotid saliva from seven adults. The results presented were from
individual subjects that were "representative" of the results as a whole. They
employed a variety of techniques: i) Contraves Low Shear 30 Viscometer, at