Examining The Effect Of Change In CEO
Gender, Functional And Educational
Background On Firm Performance And Risk
Eahab Elsaid, University of Windsor, CanadaABSTRACT
The purpose of this paper is to examine, within a succession framework, the impact of the change in CEO gender from female to male on firm performance and probability of bankruptcy. We also examine the impact of change in CEO functional and educational background on firm performance and probability of bankruptcy. We use paired sample t-tests and ordinary least squares regression analysis on 46 CEO successions where the outgoing CEO is a female and the incoming CEO is a male. The results show that a change in CEO gender from female to male is associated with an increase in firm performance and a decrease in the firm probability of bankruptcy. Furthermore, the percentage change in firm performance is negatively related to the change in CEO functional and educational background. The percentage change in firm probability of bankruptcy is positively related to the change in CEO functional and educational background. Firm management and board of directors should be aware that there is such a thing as too much change around a succession event and that it has an adverse effect on firm performance and probability of bankruptcy
Keywords: CEO Gender; CEO Background; Performance; Probability of Bankruptcy
INTRODUCTION
here has been considerable research on CEO succession in the finance and management literature. Previous research has examined many aspects of CEO successions, such as, the choice of outside vs. inside successions and forced vs. voluntary successions. In this study we examine successions where the outgoing CEO is female and the incoming CEO is male (Elsaid, 2014). An implicit assumption underlying our paper is that there are significant differences between male and female CEOs. CEO succession events include considerable changes for firms. Our sample includes successions with more changes than usual due to the change in CEO gender. We also examine how adding a change in CEO functional and/or educational background affects firm performance and firm probability of bankruptcy. Firm management and board of directors should be aware that there is such a thing as too much change around a succession event and that it might have an adverse effect on firm performance and firm probability of bankruptcy.
To the best of our knowledge, our study is one of the first of its kind to examine the effect of the change in CEO gender, functional and educational background on firm performance and firm probability of bankruptcy in a CEO succession framework. We believe that female CEOs will continue to be an understudied group unless researchers make an effort to examine them and how they affect the firms they lead (Elsaid, 2014). It is not enough to study the barriers to women climbing the corporate ladder to the CEO position, we as researchers need to widen the scope of our studies in order to get a better understanding of the role and impact of female CEOs.
CEO Gender
Brady et al., 2011; Hansen et al., 2010; Orser and Leck, 2010). According to Catalyst1, in 2013, 27% of the Fortune 500 companies had no female executive officers (Catalyst, 2013). In 2013, females accounted for about 4% of CEOs and 14.6% of executive officers in Fortune 500 companies (Catalyst, 2013). In 2005, females accounted for only 1.6% of CEOs of Fortune 500 companies (Catalyst, 2006).
There are several explanations for the low numbers of female CEOs. One of the reasons is the exit of highly capable females from the male-dominated corporate world in order to start their own businesses (Oakley, 2000). In 1992, there were 6.5 million female-owned businesses that employed more individuals than all the Fortune 500 firms combined (Rosener, 1995). From 1975 to 1990, female entrepreneurs in the U.S. started businesses at a rate that was more than twice as much as their male counterparts (Moore and Buttner, 1997).
Female CEOs face what is referred to as a femininity/competency bind (Jamieson, 1995). The femininity/competency bind is an example of a behavioral double bind where a person cannot win no matter what he/she does (Oakley, 2000). That is to say, if the female CEO acts “feminine” she will be perceived as incompetent. However, if she is aggressive and authoritative like men, she will be perceived as “overbearing.”
CEO Functional Background
CEO functional background is important because the career experiences CEOs bring to their jobs have a direct influence on how they process information (Walsh, 1988) and how they make strategic choices (Hitt and Ireland, 1985). In turn, these factors will likely affect organizational performance (Gupta and Govindarajan, 1984). The CEO’s functional background reflects the firm’s culture and potential strategic direction (Koyuncu et al., 2010). Oakley (2000) finds that corporate policies and practices, especially when it comes to training and career development, are a major factor in preventing females from reaching the CEO position. Young female managers usually do not get any line experience in operations, manufacturing and/or marketing (Elsaid et al., 2014). This line experience is an essential component in the ascent of any manager to the CEO position (Elsaid et al., 2014).
CEO Educational Background
There is considerable prior literature on CEO educational background and its effects on the firm (Elsaid et al., 2014). Barker and Mueller (2002) find that the kind of degree that the CEO holds has an impact on the firm’s research and development funding. Graham et al., (2005) find that CEOs with MBA degrees are more likely to use techniques such as the net present value for capital budgeting and capital asset pricing model in cost of capital calculations .
Frey and Ditterman (2004) suggest that CEOs from schools with high mean entrance exam scores are more intelligent and can better run the firm as they can process more information. Perez-Gonzalez (2006) finds that firms with CEOs that lack an Ivy League degree may have worse performance than their counterparts with an Ivy League education. Adams et al., (2007) examines the educational background of female CEOs and find that female CEOs are highly educated with degrees in science, engineering and business from prestigious colleges and universities.
CEO Succession Framework
CEO successions provide an opportunity to identify the impact of gender, functional and educational background on firm performance and firm probability of bankruptcy by examining corporate outcomes when the gender, functional and educational background of the CEO changes through succession (Elsaid, 2014; Elsaid and Ursel, 2011).
HYPOTHESES DEVELOPMENT
The previous research on the link between the CEO gender and firm performance is, at best, mixed in nature. Vieito (2012) and Davis et al., (2010) find that in small, medium and large sized firms, female CEO led firms outperform male CEO led firms. On the other hand, previous meta-analytic research finds that the gender of the
leader has no effect on firm performance (DeRue et al., 2011; Eagly et al., 1995). Along the same lines, Gondhalekar and Dalmia (2007), find no difference in performance between male led and female led firms. However, Adams et al., (2007) find that female CEOs provide a smaller percentage return to their shareholders as compared to their male counterparts. Thus, we hypothesize that:
Hypothesis 1a: There is an increase in firm performance (as measured by Tobin’s Q) following a change in CEO gender from female to male.
We consider that the firm probability of bankruptcy as one of the measures of risk. As a result, a higher probability of bankruptcy is an indication of higher firm risk. CEO successions offer a unique opportunity to study the impact of CEO gender on risk-taking, because most of the firm’s risk characteristics, such as the riskiness of the firm’s operations and competitive situation remain somewhat fixed around the CEO succession and the only major change is in who is filling the CEO position (Elsaid, 2014; Elsaid and Ursel, 2011). Martin et al., (2009) find that female CEOs are more likely to be selected for high risk firms. Thus, we hypothesize that:
Hypothesis 1b: There is a decrease in firm probability of bankruptcy (as measured by Z Score) following a change in CEO gender from female to male.
We hypothesize that there will be performance and risk consequences for making a change in CEO functional and educational background. We argue that since we are examining CEO successions that contain a change in CEO gender, over and above all the usual changes that accompany a succession event, that additional changes in CEO functional and educational backgrounds will prove to have an adverse effect on firm performance (decrease it) and firm probability of bankruptcy (increase it). Thus we hypothesize that:
Hypothesis 2a: The percentage change in firm performance (as measured by Tobin’s Q) following the succession is a negative function of the change in CEO functional and educational background.
Hypothesis 2b: The percentage change in firm probability of bankruptcy (as measured by Z Score) following the succession is a positive function of the change in CEO functional and educational background.
SAMPLE SELECTION AND VARIABLE DEFINITIONS
Sample Selection
Our sample consists of a hand-collected dataset of CEO successions between 1996 and 2013. We form our sample by searching Standard and Poor’s Execucomp database for CEO successions where the outgoing CEO is female and the incoming CEO is male (Elsaid, 2014). Execucomp contains data about top executives and their compensation for large and midcap North American firms. The final sample consists of 46 CEO successions where the outgoing CEO is female and the incoming CEO is male (Elsaid, 2014).
Similar to Elsaid et al., (2014) we use firm proxy statements, Marquis Who’s Who database and Bloomberg to collect data for each CEO’s prior job titles and employment history (i.e., founder, output, throughput or peripheral); CEO educational background (i.e., undergraduate, masters or doctorate degree) and CEO Ivy League affiliation (i.e., a degree from an Ivy League institution). We obtain financial statement information from Compustat. We use the firms’ proxy statements to determine whether the incoming CEO joined the company from the outside and whether the succession was voluntary or forced.
Variable Definition
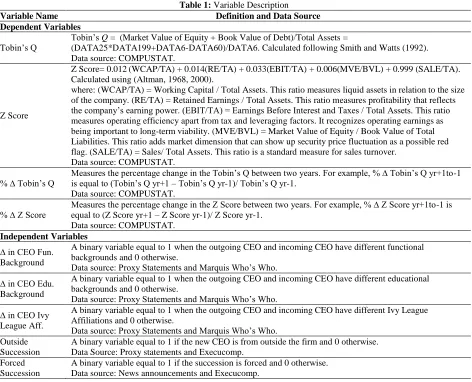
Table 1: VariableDescription
Variable Name Definition and Data Source
Dependent Variables
Tobin’s Q
Tobin’s Q = (Market Value of Equity + Book Value of Debt)/Total Assets =
(DATA25*DATA199+DATA6-DATA60)/DATA6. Calculated following Smith and Watts (1992). Data source: COMPUSTAT.
Z Score
Z Score= 0.012(WCAP/TA) + 0.014(RE/TA) + 0.033(EBIT/TA) + 0.006(MVE/BVL) + 0.999 (SALE/TA). Calculated using (Altman, 1968, 2000).
where: (WCAP/TA) = Working Capital / Total Assets. This ratio measures liquid assets in relation to the size of the company. (RE/TA) = Retained Earnings / Total Assets. This ratio measures profitability that reflects the company’s earning power. (EBIT/TA) = Earnings Before Interest and Taxes / Total Assets. This ratio measures operating efficiency apart from tax and leveraging factors. It recognizes operating earnings as being important to long-term viability. (MVE/BVL) = Market Value of Equity / Book Value of Total Liabilities. This ratio adds market dimension that can show up security price fluctuation as a possible red flag. (SALE/TA) = Sales/ Total Assets. This ratio is a standard measure for sales turnover.
Data source: COMPUSTAT.
% ∆ Tobin’s Q Measures the percentage change in the Tobin’s Q between two years. For example, % ∆ Tobin’s Q yr+1to-1 is equal to (Tobin’s Q yr+1 – Tobin’s Q yr-1)/ Tobin’s Q yr-1. Data source: COMPUSTAT.
% ∆ Z Score
Measures the percentage change in the Z Score between two years. For example, % ∆ Z Score yr+1to-1 is equal to (Z Score yr+1 – Z Score yr-1)/ Z Score yr-1.
Data source: COMPUSTAT.
Independent Variables
∆ in CEO Fun. Background
A binary variable equal to 1 when the outgoing CEO and incoming CEO have different functional backgrounds and 0 otherwise.
Data source: Proxy Statements and Marquis Who’s Who. ∆ in CEO Edu.
Background
A binary variable equal to 1 when the outgoing CEO and incoming CEO have different educational backgrounds and 0 otherwise.
Data source: Proxy Statements and Marquis Who’s Who. ∆ in CEO Ivy
League Aff.
A binary variable equal to 1 when the outgoing CEO and incoming CEO have different Ivy League Affiliations and 0 otherwise.
Data source: Proxy Statements and Marquis Who’s Who. Outside
Succession
A binary variable equal to 1 if the new CEO is from outside the firm and 0 otherwise. Data Source: Proxy statements and Execucomp.
Forced Succession
A binary variable equal to 1 if the succession is forced and 0 otherwise. Data source: News announcements and Execucomp.
CEO Functional Background
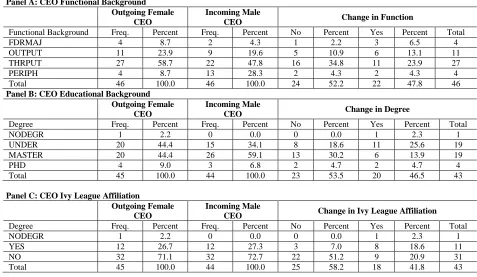
We follow prior research by Murray (1989), Michel and Hambrick (1992), Westphal and Zajac (1995) and Elsaid et al., (2014) in determining the CEO functional backgrounds by examining the prior job titles and employment history. Output functional backgrounds (OUTPUT) include positions in sales and marketing. Throughput functional backgrounds (THRPUT) include positions in engineering, operations and R&D. Peripheral functional backgrounds (PERIPH) include positions in accounting, finance, and law. We use firm proxy statements and the Marquis Who’s Who database to collect data for CEO prior job titles and employment history. The vast majority of CEOs have had experience in two or more areas as they were advancing through the ranks of a company or companies. In these cases, we use the functional area where the CEO spent the most time to determine the CEO functional background.
CEO Educational Background
degrees were obtained from an Ivy League school, and zero otherwise. We use firm proxy statements, the Marquis Who’s Who database and Bloomberg to collect data for each CEO’s prior education.
Control Variables
We use firm proxy statements to determine whether the successor CEO joined the company from the outside (Outside Succession). We examine the column “REASON” in the Execucomp database, which explains why the named CEO left the company. It provides four different reasons: resigned, retired, deceased, or unknown. We verify the reason listed in Execucomp by searching the Wall Street Journal Index (WSJI) and the Wall Street Journal (WSJ) for the reasons for the succession. From the news stories, we classify voluntary successions as all CEO successions arising from retirement (CEOs over age 60)2, death, illness, or those involving the CEO’s departure for a better and more prestigious position in another firm. We set a dummy variable equal to one in cases where the CEO was forced to leave, and zero in cases where the CEO departure was voluntary (Forced Succession).
Table 2: Descriptive Statistics
Panel A: CEO Functional Background Outgoing Female
CEO
Incoming Male
CEO Change in Function
Functional Background Freq. Percent Freq. Percent No Percent Yes Percent Total FDRMAJ 4 8.7 2 4.3 1 2.2 3 6.5 4 OUTPUT 11 23.9 9 19.6 5 10.9 6 13.1 11 THRPUT 27 58.7 22 47.8 16 34.8 11 23.9 27 PERIPH 4 8.7 13 28.3 2 4.3 2 4.3 4 Total 46 100.0 46 100.0 24 52.2 22 47.8 46
Panel B: CEO Educational Background Outgoing Female
CEO
Incoming Male
CEO Change in Degree
Degree Freq. Percent Freq. Percent No Percent Yes Percent Total NODEGR 1 2.2 0 0.0 0 0.0 1 2.3 1 UNDER 20 44.4 15 34.1 8 18.6 11 25.6 19 MASTER 20 44.4 26 59.1 13 30.2 6 13.9 19 PHD 4 9.0 3 6.8 2 4.7 2 4.7 4 Total 45 100.0 44 100.0 23 53.5 20 46.5 43
Panel C: CEO Ivy League Affiliation
Outgoing Female CEO
Incoming Male
CEO Change in Ivy League Affiliation
Degree Freq. Percent Freq. Percent No Percent Yes Percent Total NODEGR 1 2.2 0 0.0 0 0.0 1 2.3 1 YES 12 26.7 12 27.3 3 7.0 8 18.6 11 NO 32 71.1 32 72.7 22 51.2 9 20.9 31 Total 45 100.0 44 100.0 25 58.2 18 41.8 43
Panel D: Successions by Fama and French (1997) 17 Industry Classification
Fama-French (17) Industry Freq. Percent
Food 1 2.2 Mining and Minerals 1 2.2 Oil and Petroleum Products 0 0.0 Textiles, Apparel & Footware 2 4.3 Consumer Durables 1 2.2 Chemicals 0 0.0 Drugs, Soap, Perfumes, Tobacco 4 8.7 Construction and Construction Materials 1 2.2 Steel Works Etc 2 4.3 Fabricated Products 1 2.2 Machinery and Business Equipment 4 8.7 Automobiles 0 0.0 Transportation 0 0.0 Utilities 2 4.3 Retail Stores 7 15.2 Banks, Insurance Companies, & Other Fin. 4 8.7 Other 16 34.8 Total 46 100.0
RESULTS
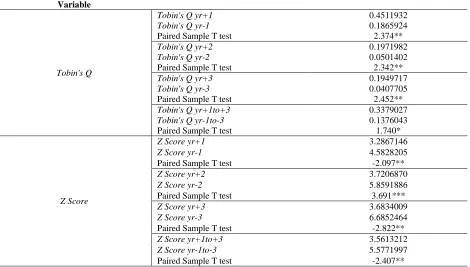
Table 3 contains the results for the paired sample t-tests comparing the firm performance (Hypothesis 1a) and the firm’s probability of bankruptcy (Hypothesis 1b) for years +1 to -1, +2 to -2, +3 to -3 and the average for years +1→+3 to -1→-3. Consistent with Hypothesis 1a, firm performance increases post-succession as compared to pre-succession. Consistent with Hypothesis 1b, firm probability of bankruptcy decreases post-succession as compared to pre-succession.
Table 3: Paired Sample t-tests For Hypothesis 1a
There is an increase in firm performance (as measured by Tobin’s Q) following a change in CEO gender from female to male & Hypothesis 1b: There is a decrease in firm probability of bankruptcy (as measured by Z Score) following a change in CEO gender from female to male.
Variable
Tobin's Q
Tobin's Q yr+1 0.4511932
Tobin's Q yr-1 0.1865924
Paired Sample T test 2.374**
Tobin's Q yr+2 0.1971982
Tobin's Q yr-2 0.0501402
Paired Sample T test 2.342**
Tobin's Q yr+3 0.1949717
Tobin's Q yr-3 0.0407705
Paired Sample T test 2.452**
Tobin's Q yr+1to+3 0.3379027
Tobin's Q yr-1to-3 0.1376043
Paired Sample T test 1.740*
Z Score
Z Score yr+1 3.2867146
Z Score yr-1 4.5828205
Paired Sample T test -2.097**
Z Score yr+2 3.7206870
Z Score yr-2 5.8591886
Paired Sample T test 3.691***
Z Score yr+3 3.6834009
Z Score yr-3 6.6852464
Paired Sample T test -2.822**
Z Score yr+1to+3 3.5613212
Z Score yr-1to-3 5.5771997
Paired Sample T test -2.407**
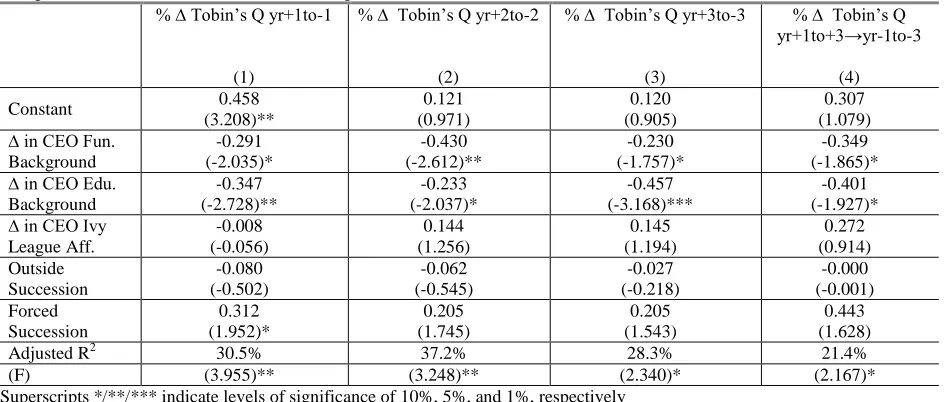
Table 4: Ordinary Least Squares Regression Estimates for Hypothesis 2a
The percentage change in firm performance (as measured by Tobin’s Q) following the succession is a negative function of the change in CEO functional and educational background.
% ∆ Tobin’s Q yr+1to-1
(1)
% ∆ Tobin’s Q yr+2to-2
(2)
% ∆ Tobin’s Q yr+3to-3
(3)
% ∆ Tobin’s Q yr+1to+3→yr-1to-3
(4)
Constant 0.458
(3.208)** 0.121 (0.971) 0.120 (0.905) 0.307 (1.079) ∆ in CEO Fun.
Background -0.291 (-2.035)* -0.430 (-2.612)** -0.230 (-1.757)* -0.349 (-1.865)* ∆ in CEO Edu.
Background -0.347 (-2.728)** -0.233 (-2.037)* -0.457 (-3.168)*** -0.401 (-1.927)* ∆ in CEO Ivy
League Aff. -0.008 (-0.056) 0.144 (1.256) 0.145 (1.194) 0.272 (0.914) Outside Succession -0.080 (-0.502) -0.062 (-0.545) -0.027 (-0.218) -0.000 (-0.001) Forced Succession 0.312 (1.952)* 0.205 (1.745) 0.205 (1.543) 0.443 (1.628)
Adjusted R2 30.5% 37.2% 28.3% 21.4%
(F) (3.955)** (3.248)** (2.340)* (2.167)*
Superscripts */**/*** indicate levels of significance of 10%, 5%, and 1%, respectively
Table 4 contains the ordinary least squares regression estimates for the relation between the percentage change in the firm performance (as measured by Tobin’s Q) for years +1 to -1, +2 to -2, +3 to -3 and the average for years +1→+3 to -1→-3 and the change in CEO functional and educational background. Consistent with Hypothesis 2a, the change in CEO functional and educational background is significantly negatively related to the percentage change in firm performance. That is to say, firm performance post-succession decreases as opposed to pre-succession when there is a change in the CEO functional and/or educational background in pre-successions where the outgoing CEO is female and the incoming CEO is male.
Table 5: Ordinary Least Squares Regression Estimates for Hypothesis 2b
The percentage change in firm probability of bankruptcy (as measured by Z Score) following the succession is a positive function of the change in CEO functional and educational background.
% ∆ Z Score yr+1to-1
(1)
% ∆ Z Score yr+2to-2
(2)
% ∆ Z Score yr+3to-3
(3)e
% ∆ Z Score yr+1to+3→yr-1to-3
(4)
Constant -0.884
(-0.981) -0.185 (-0.118) -2.873 (-1.112) -0.667 (-0.737) ∆ in CEO Fun.
Background 1.584 (1.917)* 3.358 (1.954)* 5.285 (2.588)** 2.433 (2.931)** ∆ in CEO Edu.
Background 2.328 (2.122)* 3.139 (2.281)* 6.282 (2.832)** 3.892 (3.529)*** ∆ in CEO Ivy
League Aff. -1.292 (-1.358) -0.272 (-0.247) -2.470 (-0.897) -1.827 (-1.911)* Outside Succession 0.897 (1.040) 2.185 (1.717) 1.379 (0.656) 0.575 (0.662) Forced Succession -0.688 (-0.689) 0.240 (0.166) 1.157 (0.390) -0.239 (-0.238)
Adjusted R2 78.5% 53.6% 61.5% 88.3%
(F) (6.847)*** (3.051)* (3.215)* (13.091)***
Superscripts */**/*** indicate levels of significance of 10%, 5%, and 1%, respectively
Hypothesis 2b, the change in CEO functional and educational background is significantly positively related to the percentage change in firm probability of bankruptcy. That is to say, firm probability of bankruptcy post-succession increases as opposed to pre-succession when there is a change in the CEO functional and educational background in successions where the outgoing CEO is female and the incoming CEO is male.
DISCUSSION, IMPLICATIONS AND CONCLUSIONS
In our sample, which specifically consists of successions where the outgoing CEO is female and the incoming CEO is male, the paired sample t-tests show that the firm performance (as measured by Tobin’s Q) increases post-succession as opposed to pre-succession (Hypothesis 1a) and the firm probability of bankruptcy decreases post-succession as opposed to pre-succession (Hypothesis 1b). Thus, we can conclude that firm performance increases and firm risk decreases following the successions.
On the other hand, the regression analysis shows that the percentage change in firm performance is negatively related to the change in CEO functional and educational background (Hypothesis 2a). In addition, the percentage change in firm probability of bankruptcy is positively related to the change in CEO functional and educational background (Hypothesis 2b). Thus, our argument in this case is that a change in the CEO functional and educational characteristics in successions that already include a change in CEO gender will have a negative effect on firm performance and a positive effect on firm probability of bankruptcy.
The paper makes a contribution to the management and corporate finance literature since it is one of the few papers (with the exception of Elsaid et al., (2014)) that address both the CEO functional and educational background. Most of the past literature addresses one but not the other. The paper also has practical implications, firm management and board of directors should be aware that there is such a thing as too much change around a succession event and that it has an adverse effect on firm performance (decreases it) and firm probability of bankruptcy (increases it). CEO succession events already include considerable changes for firms. Adding a change in CEO functional and educational background in successions that have more than the usual amount of change (i.e., change in CEO gender from female to male) will come with a price in the form of declining performance and increasing probability of bankruptcy.
Future Research
Future research should attempt to examine successions where the outgoing CEO is male and the incoming CEO is female. It would be interesting to see how our results change in this case. An interesting area for future research is to examine industry differences in promoting females to the CEO position. That is to say, why are female CEOs more prevalent in certain industries?
Limitations
The study covers medium and large publicly traded North American firms. As a result, it does not include small and privately held firms. Any classification scheme that codes CEO successions as forced or voluntary is inherently subjective in nature. It is sometimes difficult to state with absolute certainty whether a CEO succession is forced or voluntary. Our sample is relatively small due to the rarity of female CEOs. The sample also suffers from a selection bias (Heckman, 1979) since we are focusing on successions were the outgoing CEO is female and the incoming CEO is male.
AUTHOR INFORMATION
REFERENCES
1. Adams, S., Gupta, A., Haughton, D., & Leeth, J. (2007). Gender differences in CEO compensation: evidence fromthe USA. Women in Management Review, 22, 208-224.
2. Altman, E. (1968). Financial ratios, discriminant analysis and the prediction of corporate bankruptcy. The Journal of Finance,23, 589-609.
3. Altman, E. (2000). Predicting financial distress of companies. Retrieved from http://pages.stern.nyu.edu/~ealtman/Zscores.pdf
4. Barker, V., & Mueller, G. (2002). CEO characteristics and firm R&D spending. Management Science,48, 782-801.
5. Brady, D., Isaacs, K., Reeves, M., Burroway, R., & Reynolds, M. (2011). Sector, size, stability, and scandal: explaining the presence of female executives in Fortune 500 firms. Gender in Management: An International Journal,26, 84-104.
6. Catalyst (2013). 2013 Catalyst census: Fortune 500 women executive officers and top earners. New York, NY: Catalyst.
7. Catalyst (2006). 2005 Census of women board directors of the Fortune 500. New York, NY: Catalyst. 8. Davis, P., Babakus, E., Englis, P., & Pett, T. (2010). The influence of CEO gender on market orientation
andperformance in serve small and medium-sized service businesses. Journal of Small Business Management,48, 475-496.
9. De Rue, D., Nahrgang, J., Wellman, N., & Humphrey, S. (2011). Trait and behavioral theories on
leadership: anintegration and meta-analytic test for their relative validity. Personnel Psychology, 64, 7-52. 10. Eagly, A., Karau, E., & Makhijani, M. (1995). Gender and the effectiveness of leaders: a meta-analysis.
Psychological Bulletin, 117, 125-145.
11. Elsaid, E. (2014). Comparing outgoing female CEOs with prior CEO experience to outgoing female CEOs with no prior CEO experience. Working Paper.
12. Elsaid E., Benson, B., & Worrell, D. (2014). Successor CEO functional and educational backgrounds: influence of predecessor characteristics and performance antecedents. Working Paper.
13. Elsaid, E., & Ursel, N. (2011). CEO succession, gender, and risk-taking. Gender in Management: An International Journal,26, 499-512.
14. Fama, E., & French, K. (1997). Industry costs of equity. Journal of Financial Economics, 43, 153-193. 15. Frey, M., & Detterman, D. (2004). Scholastic assessment or G? The relationship between the scholastic
assessment test and general cognitive ability. Psychological Science, 15, 373-378.
16. Gondhalekar, V., & Dalmia, S. (2007). Examining the stock market response: a comparison of male and female CEOs. International Advances in Economic Research, 13, 395-396.
17. Graham, J., Harvey, C., & Rajgopal, S. (2005). The economic implications of corporate financial reporting. Journal of Accounting & Economics,40, 3-73.
18. Gupta, A., & Govindarajan, V. (1984). Business unit strategy, managerial characteristics, and business unit effectiveness at strategy implementation. Academy of Management Journal, 27, 25-41.
19. Hansen, M., Ibarra, H., & Peyer, U. (2010). The best-performing CEOs in the world. Harvard Business Review, 88, 104-113.
20. Heckman, J. (1979). Sample selection bias as a specification error. Econometrica, 47, 153-161.
21. Hitt, M., & Ireland, R. (1985). Corporate distinctive competence, strategy, industry and performance. Strategic Management Journal, 6, 273-294.
22. Jamieson, K. (1995). Beyond the double bind: women and leadership. NewYork, NY: Oxford University Press.
23. Koyuncu, B., Firfiray, S., Claes, B., & Hamori, M. (2010). CEOs with a functional background in
operations: reviewing their performance and prevalence in the top post. Human Resource Management,49, 869-882.
24. Martin, A., Nishikawa, T., & Williams, M. (2009). CEO gender: effects on valuation and risk. Quarterly Journal of Finance and Accounting, 48, 23-40.
25. Michel, J., & Hambrick, D. (1992). Diversification posture and top management team characteristics. Academy of Management Journal, 35, 9-37.
27. Murray, A. (1989). Top management heterogeneity and firm performance. Strategic Management Journal, 10, 125-141.
28. Oakley, J. (2000). Gender-based barriers to senior management positions: understanding the scarcity of femaleCEOs. Journal of Business Ethics, 27, 321-334.
29. Orser, B., & Leck, J., (2010). Gender influences on career success outcomes. Gender in Management: An International Journal,25, 386-407.
30. Parrino, R. 1997. CEO turnover and outside succession: a cross-sectional analysis. Journal of Financial Economics,46, 165-197.
31. Perez-Gonzalez, F. (2006). Inherited control and firm performance. American Economic Review, 96, 1559-1588.
32. Rosener, J. (1995). America's competitive secret: utilizing women as a management strategy. New York, NY: Oxford University Press.
33. Smith, C., & Watts, R. (1992). The investment opportunity set and corporate financing, dividend and compensation policies. Journal of Financial Economics,32, 263-292.
34. Vieito, J. (2012). Gender, top management compensation gap, and company performance: tournament versusbehavioral theory. Corporate Governance: An International Review, 20, 46-63.
35. Walsh, J. (1988). Selectivity and selective perceptions: an investigation of managers’ belief structures and information processing. Academy of Management Journal, 31, 873–896.
36. Westphal, J., & Zajac, E. (1995). Who shall govern? CEO/board power, demographic similarity, and new director selection. Administrative Science Quarterly, 40, 60-83.