R E S E A R C H
Open Access
Who pays for healthcare in Bangladesh? An
analysis of progressivity in health systems
financing
Azaher Ali Molla
1,2*and Chunhuei Chi
3,4,5,6Abstract
Background:The relationship between payments towards healthcare and ability to pay is a measure of financial fairness. Analysis of progressivity is important from an equity perspective as well as for macroeconomic and political analysis of healthcare systems. Bangladesh health systems financing is characterized by high out-of-pocket
payments (63.3%), which is increasing. Hence, we aimed to see who pays what part of this high out-of-pocket expenditure. To our knowledge, this was the first progressivity analysis of health systems financing in Bangladesh. Methods:We used data from Bangladesh Household Income and Expenditure Survey, 2010. This was a cross sectional and nationally representative sample of 12,240 households consisting of 55,580 individuals. For quantification of progressivity, we adopted the‘ability-to-pay’principle developed by O’Donnell, van Doorslaer, Wagstaff, and Lindelow (2008). We used the Kakwani index to measure the magnitude of progressivity.
Results:Health systems financing in Bangladesh is regressive. Inequality increases due to healthcare payments. The differences between the Gini coefficient and the Kakwani index for all sources of finance are negative, which indicates regressivity, and that financing is more concentrated among the poor. Income inequality increases due to high out-of-pocket payments. The increase in income inequality caused by out-of-pocket payments is 89% due to negative vertical effect and 11% due to horizontal inequity.
Conclusions:Our findings add substantial evidence of health systems financing impact on inequitable financial burden of healthcare and income. The heavy reliance on out-of-pocket payments may affect household living standards. If the government and people of Bangladesh are concerned about equitable financing burden, our study suggests that Bangladesh needs to reform the health systems financing scheme.
Keywords:Progressivity, Ability-to-pay, Household healthcare expenditure, Health equity, Out-of-pocket payments
Background
The relationship between payments toward healthcare and ability to pay (ATP) is a common measure of equity [1]. Who pays how much share for healthcare is a question of financial fairness. The measurement of pro-gressivity or repro-gressivity is important not only for a wide range of equity perspective, but also for macroeconomic and political analysis of healthcare systems [2]. Inequal-ities exist in almost all sectors but inequalInequal-ities in the
health sector have more negative impacts than in other sectors [3, 4].
The issue of equity is widely acknowledged by health economists and health policy researchers to be an important policy objective in the healthcare field [5–8]. Its importance is recognized not only in low and middle-income countries (LMICs), but also in high-income countries (HICs). In Organization of Economic Cooperation and Development (OECD) countries, equity appears to be a prominent issue in the continuing debate on healthcare financing and delivery [9, 10]. In the same way, there is a strong agreement among the policy makers in low-income countries that equity should fea-ture prominently in health policy decisions [11–13]. The * Correspondence:amolla@murraystate.edu;maazaher@gmail.com
1
Institute of Health Economics, University of Dhaka, Dhaka, Bangladesh
2Department of Applied Health Sciences, Public and Community Health,
School of Nursing and Health Professions, Murray State University, Murray, KY, USA
Full list of author information is available at the end of the article
WHO has placed health equity as the second of its thirty-eight targets within the new “Policy for Health for All”. The policy says that by the year 2020 the health gap be-tween socioeconomic groups within countries should be reduced by at least one fourth in all member states [14].
Without a well-functioning healthcare financing system, timely access to health services cannot be achieved for the majority of the population. The system itself determines whether people can afford to use health services without any financial hardships when they need them. Thus, recog-nizing the importance of equitable health systems financing (HSF), the World Health Organization (WHO) committed and recommended that countries develop a financing sys-tem so that all people have access to services and do not suffer financial hardship paying for them [14]. The sixty-fourth World Health Assembly [15] urged member states to avoid significant direct payments at the point of delivery, and to include a method for prepayment of financial contri-butions for healthcare and services. It also urged members to devise a mechanism to pool risks among the population to avoid catastrophic healthcare expenditure and impover-ishment of individuals and households.
With an area of 56,977 miles and a population of 161.03 million [16], Bangladesh is going through a demographic and epidemiologic transition [17]. The country is the eighth most populous country of the world while it is the 94th largest by area. 28.27% of the populations are below 14 years of age and 6.04% are above 65 years with a de-pendency ration 52.5%. The population growth rate is 1.05% (2016 est.) with a life expectancy at birth of 73.2 years. Yet food and waterborne diseases (bacterial and protozoal diarrhea, hepatitis A and E, and typhoid fever) and vector-borne diseases (dengue, malaria) are highly prevalent. The economy has grown roughly 6% per year since1996 [18].
Bangladesh HSF is characterized by increasingly high out-of-pocket (OOP) payments, and, at the same time, the absence of an active prepayment system [18]. In Bangladesh, OOP payments as percent of private expend-iture on health (92.9%) is higher than India (89.2%) and Nepal (79.9%) [19]. The Bangladesh National Health Ac-counts [18] reports that household OOP expenditure re-mains the main source of HSF, increasing from 56.9% in 1997 to 63.3% in 2012 of total health expenditure (THE). The second largest financing agent is government, making up 26.0% of THE. The private firms’share has remained at around 1.0% over the years. The share of non-government organizations (NGOs) from their own sources has ranged between 1% and 2.0% of the THE over the 1997–2012 period. Development partners contribute through NGOs or government. The rest of the expenditure through NGOs varied from 5% to 9% during the period. House-hold expenditure as a percentage of GDP increased from 1.6% to around 20.0% in 2010.
The health spending in Bangladesh accounted for 3.4% of gross domestic product (GDP), which is lower than the average (3.8%) in South East Asia (SEA) region, below the average of low-income countries (5.4%), lower-middle income countries (4.3%), and far below the world (8.5%) [19]. A breakdown of OOP expenditure shows that drugs and medicine constitute 65.0% of OOP spending. Other components of OOP are services of curative care (22.0%), ancillary services (9.0%), out-patient and home-based services (4.0%), and general government administration of health (less than 1.0%).
The consequences of excess OOP expending are enor-mous with different scenarios. Some households may not utilize formal healthcare at all due to excess OOP payments, or they may receive partial care and thus aggravate the disease condition, causing the disease to become a chronic condition. Households may sell their movable and immovable properties to manage the treat-ment costs, which in turn make them poorer. Due to ex-cess health expenditures, households may need to ration their food items, and thus may become malnourished. OOP health expenditure may affect education, causing children to drop out of school. Moreover, OOP pay-ments may mislead planners and policy makers to mis-calculate poverty status.
Policy makers and planners are not fully aware of the situation due to the acute shortage of health policy re-search in Bangladesh. We aim to analyze progressivity to examine if inequities in health systems financing (HSF) exist. This will provide an evidence base for health plan-ners and policy makers who want to promote equity in HSF. In addition to numerical differences, this study will employ statistical and macro-economic analysis and techniques to examine equity using Bangladesh House-hold Income and Expenditure Surveys [20]. This research seems to be the first of its kind to analyze of progressivity of HSF in Bangladesh using nationwide survey dataset.
We evaluated progressivity of HSF from all sources of available financing: tax, social insurance, private insur-ance, and OOP payments. We did not consider foreign aid, as it is not relevant because our purpose was to evaluate the distributional impact of domestic source of health systems financing on the domestic population. Assuming tax parameters have been set for foreign loan repayment, the distributional burden on the current gen-eration of foreign debt financing will be captured through the evaluation of the tax distribution.
Data and methods
Sampling technique
inequality and incidence of poverty. For this round, data collection was started on 1st February 2010 and continued up to 31st January 2011.
A two-stage stratified random sampling technique was followed in drawing the sample for this survey under the framework of Integrated Multipurpose Sampling (IMPS) design developed on the basis of the 2001 Bangladesh population and housing census. In IMPS design, the whole country was divided into 16 strata, which in-cluded six from rural, six from urban, and four from sub-municipal areas (SMAs). The design consists of 1000 primary sampling units (PSUs) throughout the country systematically drawn from the 16 strata. Out of 1000 PSUs, 640 were from rural and 360 from urban areas. Each PSU is comprised of approximately 200 households. In the first stage, 612 PSUs were drawn from 1000 PSUs. In the second stage, 20 households were randomly selected from each PSU. Thus, PSUs se-lected for HIES 2010 are actually a subset of PSUs of the IMPS design. The total sample size stands at 12,240 households comprising of a population of 55,580.
Methods
We used two methods to measure the progressivity of health payments: comparing the share of health pay-ments to their share of ATP, and assessing departure from proportionality or Lorenz dominance analysis. Under the progressive system, the share of health pay-ments are less than their ATP and the Lorenz curve dominates (lies above) the concentration curve. The op-posite is true for a regressive system. Kakwani index is being used to measure the magnitude of progressivity.
We have used STATA 14.0 [21] and the Automated Development Economics and Poverty Tables (ADePT) software, version 5.0 developed by World Bank’s experts [22]. Progressivity is assessed using a direct and a less direct method. A direct method is a percentage of OOP payments for healthcare as a percentage of total house-hold expenditure by quintile/decile groups of equivalent household expenditure. A less direct method of assessing progressivity is defined in relation to departure from proportionality. This method compares the share of health payments contributed by proportions of the populations ranked by ATP with their share of ATP. It compares the concentration curve of health payments (LH(p)) with the Lorenz curve for ATP, (L(P)). The merit
of this curve is that it provides a visual representation of the distribution information. However, it does not show the distribution exactly, and it is difficult to compare this curve between the countries.
Because the Lorenz dominance analysis alone does not provide a measure of magnitude of proportionality, Kakwani index [23] is used to measure the magnitudes of progressivity/regressivity. Kakwani index is twice the
area between a payment concentration curve and a Lorenz curve. It is calculated as
πk¼C−G ð1Þ
Where,C is the concentration curve and Gis the Gini coefficient of the ATP variable. The Gini coefficient (G) is used to measure of inequality of a distribution. The value of G varies from 0 to 1. The Gini coefficient is regarded as the gold standard in economic analysis in assessing inequality.
Key variables
The variables for this part of analysis are ability to pay (ATP) (Table 1), food consumption, non-food consump-tion, and amount of healthcare payments. Ability to pay for each household was calculated by adding all forms of consumption such as food consumption and non-food consumption. The amount of healthcare payments was calculated by adding all the related costs of healthcare including direct and indirect costs.
Results
The summary statistics (Table 2) show that out of 12,240 households, 11,638 households were included for analysis. The mean household size is 4.5 persons, ranging from 1 to 17 members per household. The mean households’ ag-gregate annual consumption is Tk. 132,510 (US$ 1656) with a range from a minimum of Tk. 15,327 (US$191.6) to a maximum of Tk. 1,843,160 (US$23,039). Nonfood con-sumption varies from Tk.4827 (US $60) to Tk.1,712,261 (US $21,403). There are more observations below the mean (right skewed) for both total consumption and non-food consumption. The average contribution of tax is Tk.754, social health insurance is Tk. 142 US $9.4), and private health insurance is Tk.8 (US $0.1). Total OOP pay-ments range from zero to Tk.1,369,000 (US $17,113) with an average of Tk.5339 (US $76) and a median of Tk.2200 (Us $28). Majority of observations are below the mean.
Table 1Variables with definitions and source
Variables Definitions Source
Ability to pay (ATP)
Households’yearly consumptions of food, non-food and payments towards healthcarea
HIES, 2010
Food consumption
Market price of food items consumed in
one yeara HIES, 2010
Nonfood consumption
Market price of nonfood items in one yeara HIES, 2010
Healthcare payments
Gross of all payments towards healthcare, including direct tax, indirect tax, social insurance and private insurancea
HIES, 2010
a
Health systems financing
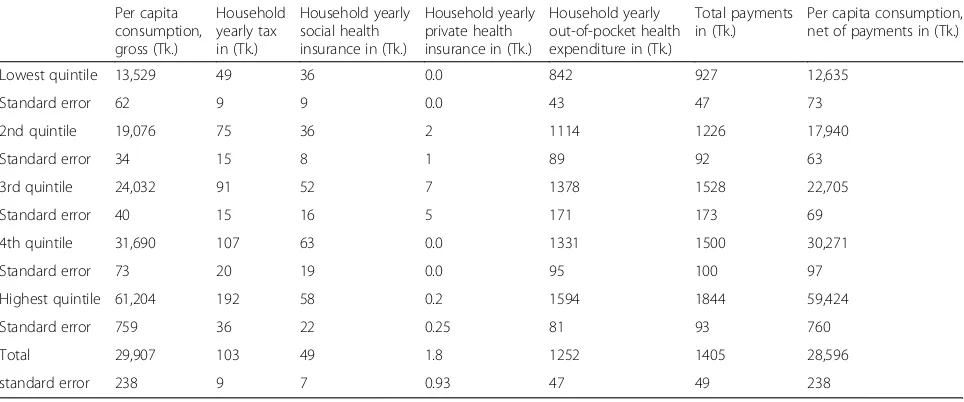
The average per capita consumption for lowest, second and third quintile is lower than the total average (Tk.29,907), which indicates that majority of the popula-tion consumes less than the average (Table 3). Total consumption in the poorest quintile (Tk. 13,529) is less than half (Tk. 29,908) of the total average consumption. Direct tax appears to be born significantly higher by the richest quintile. It is also important to note that the amount of social insurance is very small. Contribution to private health insurance for each and every quintile is very negligible and insignificant. Out-of-pocket expend-iture constitutes a major portion of health finance. The poorest quintile contributes Tk.842, which is half of the richest quintile (Tk.1594). Per capita consumption gross for the poorest quintile is Tk.13,529 and per capita con-sumption net of healthcare payments is Tk.12,635. Households in the poorest quintile consume 0.22 times the richest quintile in respect of gross consumption and 0.21 times in respect of net consumption. This clearly
shows an inequity in healthcare payments between the poorest and the richest quintiles.
Progressivity or regressivity?
Tables 4 and 5 analyze the progressivity of HSF. Table 4 gives the average consumption and financing share by quintile, with households ranked in ascending order of gross consumption. Information related to gross con-sumption gives an idea about income inequality; the greater of the richest quintiles, the greater the inequality. The poorest quintile consumes, on average, 9.0% of total (gross) consumption, whereas this amounts to 41.0% for the richest quintile (Table 4). Taxes appear to be borne mostly by the upper three quintiles, 17.7, 20.9 and 37.4%. The lowest two quintiles make up 9.5 and 14.6% of the total. The financing share increases by quintile for taxes. In case of social health insurance, the fourth quintile paid the most (25.5%) followed by the highest quintile (23.7%). The lowest and the second quintile make up nearly the same percent for social
Table 2Summary report of sample data (HIES), Bangladesh 2010
N mean min max p1 p50 p99 N_unique
Household size (person) 11,638 4.5 1.0 17.0 1.0 4.0 10.0 17
Total HH consumption (Tk.) 11,638 132,510 15,327 1,843,160 40,001 110,443 474,890 11,632
Total NF consumption (Tk.) 11,638 62,071 4827 1,712,261 10,387 42,050 354,297 10,654
Household sampling weights 11,638 2739 897.1 6882.3 897.1 2946 6882.3 16
Household tax (Tk.) 11,638 754 0.0 200,000 0.0 0.0 20,000 184
Social health insurance (Tk.) 11,638 142 0.0 120,000 0.0 0.0 3000 76
Private health insurance (Tk.) 11,638 8 0.0 50,000 0.0 0.0 0.0 9
Total OOP expenditure (Tk.) 11,638 5339 0.0 1,369,000 0.0 2200 50,000 1594
Note: p1 = 1st percentile, p50 = 50th percentile, p99 = 99th percentile
Table 3Average Per Capita Health Finance by quintiles, Bangladesh 2010
Per capita consumption, gross (Tk.)
Household yearly tax in (Tk.)
Household yearly social health insurance in (Tk.)
Household yearly private health insurance in (Tk.)
Household yearly out-of-pocket health expenditure in (Tk.)
Total payments in (Tk.)
Per capita consumption, net of payments in (Tk.)
Lowest quintile 13,529 49 36 0.0 842 927 12,635
Standard error 62 9 9 0.0 43 47 73
2nd quintile 19,076 75 36 2 1114 1226 17,940
Standard error 34 15 8 1 89 92 63
3rd quintile 24,032 91 52 7 1378 1528 22,705
Standard error 40 15 16 5 171 173 69
4th quintile 31,690 107 63 0.0 1331 1500 30,271
Standard error 73 20 19 0.0 95 100 97
Highest quintile 61,204 192 58 0.2 1594 1844 59,424
Standard error 759 36 22 0.25 81 93 760
Total 29,907 103 49 1.8 1252 1405 28,596
standard error 238 9 7 0.93 47 49 238
Table 4Household Share of Total Healthcare Financing, Bangladesh 2010
Per capita consumption, gross (%)
Household yearly tax (%)
Household yearly social health insurance (%)
Household yearly private health insurance (%)
Household yearly out-of-pocket health expenditure (%)
Total payments %
Per capita consumption, net of payments (%)
Quintiles of per capita consumption, gross
Lowest quintile 9.0 9.5 14.8 0.0 13.4 13.2 8.8
standard error 0.25 1.83 3.72 0.00 0.83 0.79 0.24
2 12.8 14.6 14.7 17.8 17.8 17.5 12.5
standard error 0.32 2.78 3.38 13.19 1.37 1.27 0.32
3 16.1 17.7 21.3 79.4 22.0 21.8 15.9
standard error 0.39 2.91 5.95 14.19 2.23 2.04 0.39
4 21.2 20.9 25.5 0.0 21.3 21.4 21.2
standard error 0.48 3.52 6.55 0.00 1.45 1.37 0.49
Highest quintile 40.9 37.4 23.7 2.8 25.5 26.2 41.6
standard error 0.72 4.96 7.43 3.11 1.37 1.35 0.73
Total 100.0 100.0 100.0 100.0 100.0 100.0 100.0
standard error 0.00 0.00 0.00 0.00 0.00 0.00 0.00
Gini coefficient 0.3134 0.3276
standard error 0.00 0.00
Concentration Index 0.2419 0.1040 −0.1208 0.1128 0.1217
standard error 0.05 0.07 0.06 0.02 0.02
Kakwani index −0.0714 −0.2094 −0.4342 −0.2005 −0.1917
standard error 0.05 0.07 0.06 0.02 0.02
Table 5Financing Budget Shares, Bangladesh 2010 (Health Financing as a Share of total gross consumption)
Per capita consumption, gross
Household yearly tax
Household yearly social health insurance
Household yearly private health insurance
Household yearly out-of-pocket health expenditure
Total payments
Per capita consumption, net of payments
Quintiles of per capita consumption, gross
Lowest quintile (%) 100.0 0.4 0.3 0.0 6.2 6.8 93.4
standard error 0.00 0.07 0.07 0.00 0.32 0.34 0.29
2nd quintile (%) 100.0 0.4 0.2 0.0 5.8 6.4 94.0
standard error 0.00 0.08 0.04 0.01 0.47 0.48 0.28
3rd quintile (%) 100.0 0.4 0.2 0.0 5.7 6.4 94.5
standard error 0.00 0.06 0.07 0.02 0.71 0.72 0.24
4th quintile (%) 100.0 0.3 0.2 0.0 4.2 4.7 95.5
standard error 0.00 0.06 0.06 0.00 0.30 0.31 0.20
Highest quintile (%) 100.0 0.3 0.1 0.0 2.6 3.0 97.1
standard error 0.00 0.06 0.04 0.00 0.14 0.16 0.12
Total (%) 100.0 0.3 0.2 0.0 4.2 4.7 95.6
standard error 0.00 0.03 0.02 0.00 0.16 0.17 0.09
Gini coefficient 0.3134 0.3276
standard error 0.00 0.00
Concentration Index 0.2419 0.1040 −0.1208 0.1128 0.1217
standard error 0.05 0.07 0.06 0.02 0.02
Kakwani index −0.0714 −0.2094 −0.4342 −0.2005 −0.1917
insurance (14.8 and 14.7%). In both per capita gross con-sumption and household yearly tax, the richest quintile bears the greater share, 40.9 and 37.4% respectively, which are 4.5 and 4.0 times respectively higher than the lowest quintile. In respect of social health insurance, the poorest quintile bears a 14.8% share, whereas the richest quintile bears 23.7%.
Private health insurance is either absent, or is present only in some pocket areas. The middle class or third quintile possesses the highest share of private health in-surance (79.4%). Whereas, the poorest and the fourth quintiles have no private insurance and the richest quin-tile has only a 2.8% share.
Financing share for household yearly OOP expenditure for the poorest quintile is approximately half (13.4%) of the richest quintile (25.5%).
The discrepancies between the share of gross con-sumption and OOP payments are clearly visible. The comparison between per capita gross consumption and per capita consumption net of health payments shows that share decreases among the poor (9.0 vs 8.8%) and increases among the rich (40.9 vs. 41.6%), which indi-cates that post-healthcare payments consumption de-creases among the poor and inde-creases among the rich. This finding supports figures for the Gini coefficient (Table 5); prepayment Gini or income inequality is less than the post-payment Gini or income inequality (0.3134 vs. 0.3276). The concentration indexes are positive except households’ private health insurance. This indicates the wealthier contribute more in absolute amount to the financing of healthcare than the poor do. For the private health insurance, the concentration index is negative which is an indication of a regressive mode of financing. The concentration index is largest for house-hold yearly taxes (0.2419) suggesting that taxes are rela-tively progressive than other sources. The differences between Gini coefficient of per capita gross consumption and concentration index or Kakwani Index for all sources of healthcare financing are negative. This indi-cates regressivity, meaning that OOP payment is more concentrated among the poor (Table 5).
Table 5 presents health financing as a share of total gross consumption. Household OOP healthcare expend-iture remains the highest share (4.2%) of all healthcare financing (tax, social insurance and private insurance). The lowest quintile spends 6.8% of their total gross con-sumption for healthcare compared to 3.0% for the high-est quintile. This clearly shows a regressive mode of financing. The contribution of household yearly private insurance tends to zero for nearly all the quintiles. Household yearly tax and social insurance are minimal, consisting of 0.3 and 0.2% respectively.
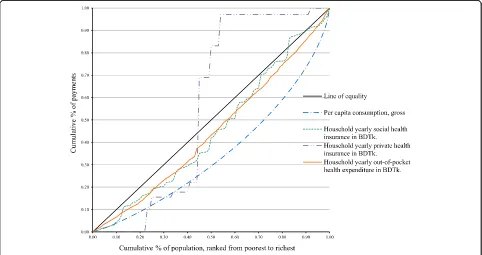
Figure 1 shows the concentration curve for household taxes. The concentration curve of household tax lies
inside the Lorenz curve at all levels of consumption. This suggests regressivity, which means that the poor pay proportionately more of their total household con-sumption for healthcare than the rich. In Fig. 2, both OOP expenditure and social insurance lie inside the per capita consumption gross (Lorenz curve), which indi-cates regressivity. Again, private insurance shows an ab-normal peak just after the 20% mark of the population ranked from poorest to richest. As we discussed earlier, private insurance in Bangladesh exists in pocket areas of the country.
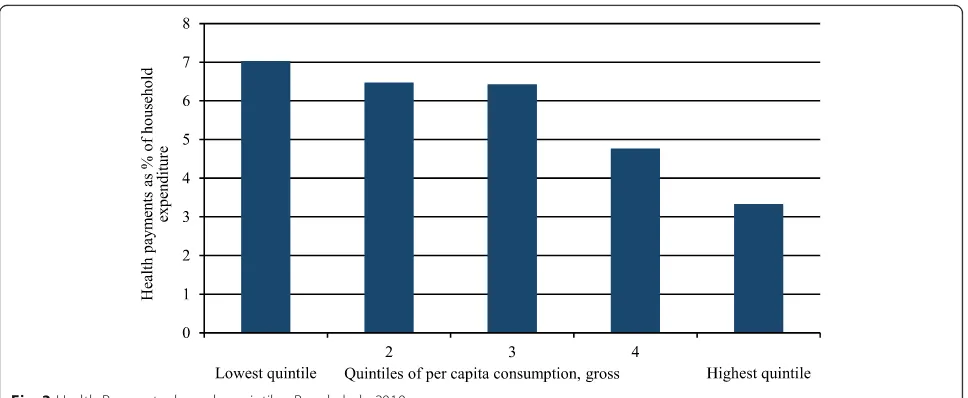
Finally, using the direct method, we have analyzed the overall progressivity (Fig. 3). It is the direct representa-tion of the progressivity of health payments. It shows the health payments share by quintile. In Bangladesh, the share of health payments to household economic status, in our case consumption, decreases from the est quintile to the highest quintile. As is visible, the low-est quintile households pay 7.0% of their total consumption for healthcare, whereas, the highest quin-tile households pay about 3.3%. The bars show a sharp decreasing trend from lowest to highest quintile. We conclude that the HSF in Bangladesh is definitely regressive.
Discussions
Our findings show that health system financing in Bangladesh is regressive in nature. Payments toward healthcare are not related to ATP. Healthcare payments account for decreasing proportion of ATP. As shown by the negative Kakwani indices, health systems financing is concentrated among the poor. This indicates that in-equality exists in health systems financing. Our results confirm the conclusion of previous studies conducted by Wagstaff [24, 25], Van Doorslaer [26], and Mastilica [27] that OOP payments are a regressive means of healthcare revenue collection.
NGOs initiated certain kinds of health insurance for the rural population. Grameen Bank also started to provide a micro health insurance scheme in the late 1990s. Simi-larly, Gonoshasthaya Kendra (GK) initiated some kind of health insurance in limited areas for the rural poor and middle class [28].
An inequality exists in per capita gross consumption in Bangladesh. On average, the lowest quintile consumes 0.22 times the highest quintile. Contrary to this, the rate of tax
borne by the lowest quintile is 0.25 times that of the highest quintile. In respect to social health insurance, the lowest quintile bears 0.62 times what the highest quintile does.
The greater share of healthcare financial burden in household is OOP payments. The poor bear 0.53 times of the rich’s burden, whereas their consumption or ATP is only 0.22 of the rich. Proportionately, the poor pay more in OOP expenditures than the rich do. This makes the payments regressive or pro-rich.
Fig. 1Lorenz dominance analysis of household tax, Bangladesh2010
It is clearly evident that the rich consume more than their poor counterparts, but at the same time, the rich pay proportionately less in taxes, social insurance, pri-vate insurance and OOP payments. For the poor, per capita net consumption decreases (9.0 vs. 8.8%) after OOP payments, whereas for the rich per capita net con-sumption increases (40.9 vs. 41.6%) after OOP payments (Table 2). This is related to the transfer payments and/or redistribution of disposable income, as we have seen in decomposition of redistributive effects. These findings are concordant with the Gini coefficients we estimated; prepayment Gini is less than the post payment Gini (0.3134 vs 0.3276). The positive concentration indexes indicate that the rich pay more in absolute terms but proportionately less. The concentration index is the lar-gest for household yearly tax, suglar-gesting that in terms of progressivity, taxes are relatively better than all other fi-nancing sources. Similarly, the Gini coefficient of per capita gross consumption and concentration index or Kakwani index for all sources of financing are negative; this indicates regressivity.
In Bangladesh, like other low-income countries, OOP payments contribute the greatest share of revenue (63.3%). The Lorenz dominance analysis indicates that the inequality exists in all sources of health systems fi-nancing (Figs. 1 and 2). Both the graphs offer a powerful means of representing the effect of health systems finan-cing on the distribution of household living standards. It should be noted that this kind of analysis does not con-sider utilization of healthcare. Progressivity should not be interpreted as the rich paying more for the same amount of healthcare, as this is most often not the case and not accounted for the measure presented here.
The overall progressivity/regressivity analysis we per-formed used a direct measure. The results indicate, with
little ambiguity, that it is regressive, as the lower income quintiles’ share of household consumption decreases with healthcare consumption. This clearly indicates that the health systems financing in Bangladesh is regressive.
The findings, although rich with both statistical and policy significance, should be interpreted in view of sev-eral limitations. Firstly, estimates of OOP payments from survey data are potentially subjected to both recall bias and small sample bias owing to the infrequency with which some healthcare payments are made. Secondly, our conventional measures of progressivity provide no information on those citizens who cannot afford to use health services and have incurred no health expendi-tures. Thirdly, the present study does not examine the obvious impact of OOP payments on the quantity and quality of care consumed. Our interpretations, therefore, need to be complemented by studies of health care utilization [29] and the incidence of public finance [30]. Finally, our analysis does not capture all potentially cata-strophic effects of illness or disability, such as lost earn-ings, and does not investigate whether health shocks are absorbed by incurring debt or expending savings to smooth consumption [31].
Conclusions
Our findings substantially add to the evidence on the re-gressivity of HSF in Bangladesh. This macro-level data analysis shows that there is heavy reliance on OOP pay-ments, which exceed 63.0% of the total health expend-iture. Further, this heavy reliance on OOP payments reduces household living standards and may lead to pov-erty or ultimately push households to deeper povpov-erty.
private health insurance is present only in some pocket areas run by NGOs. The system urgently needs to introduce health insurance schemes for the poor, eld-erly, disabled and disadvantaged. Measurable country-specific milestones in monitoring progressivity need to be adopted. The findings of this study can guide policy decisions in this aspect.
Chronic illnesses and household income were found to be the most influential and statistically significant (p< 0.001) predictors of high household healthcare ex-penditure in Bangladesh [32]. Further, low revenue gen-erating ability of the government of Bangladesh and high OOP expenditures make a risk pooling and prepayment system an absolute necessity. The Bangladesh Health Care Financing Strategy (HCFS), 2012–2032 recom-mends a national health protection scheme [33]. The scheme targets mainly the formal sectors of the country with compulsory payroll taxation. People below the pov-erty line would be subsidized from the general revenue. It would allow the informal sector to join the scheme voluntarily. Health cards have some positive effect on OOP payments [34]. Thailand introduced an identity card named “Health Card” in 1983 to protect the poor in the community [35]. Australian Health Care Card [36] and Indonesian Health Card Program [37] were in-troduced for the same purpose. Development of such type of health card may be an option for financial pro-tection of the poor in Bangladesh.
The study findings may contribute to policy making, particularly in relation to the proposed financial risk pro-tection, social propro-tection, and universal coverage. Our findings provide empirical evidence for future healthcare reforms. We hope this research will stimulate more stud-ies of this subject with improved method and analysis.
Acknowledgements
We are thankful to Bangladesh Bureau of Statistics for providing us the dataset on Household Income and Expenditure Survey, 2010. We are deeply thankful to the anonymous reviewers of the journal for their thoughtful and creative comments and suggestions. Our sincere thanks and gratitude to Mr. Cub Kahn for a thorough language edit.
Funding
The study was not funded by any source.
Availability of data and materials
The data is not publicly available. We bought the dataset from Bangladesh Bureau of Statistics for use in our research. We have the analytical files.
Authors’contributions
AAM participated in the research design, data compilation, analysis and writing the original text. CC in finalization of research design, analysis and edited the final manuscript. Both the authors read and approve the final manuscript.
Ethics appoval and consent to participate
We have used a secondary dataset (HIES, 2010). The data has been collected by Bangladesh Bureau of Statistics (BBS). We have taken ethical clearance from institutional review board (IRB), reference number 7453 dated 05/02/ 2016 of the Oregon State University. As secondary data analysis, it does not deal with any human subject.
Consent for publication
Not applicable
Competing interests
The authors declare that they have no competing interests.
Publisher’s Note
Springer Nature remains neutral with regard to jurisdictional claims in published maps and institutional affiliations.
Author details
1Institute of Health Economics, University of Dhaka, Dhaka, Bangladesh. 2Department of Applied Health Sciences, Public and Community Health,
School of Nursing and Health Professions, Murray State University, Murray, KY, USA.3School of Biological and Population Health Sciences, Milam 13,
Corvallis, OR 97331-5109, USA.4Graduate Program in Health Management
and Policy, College of Public Health and Human Sciences, Oregon State University, Milam 13, Corvallis, OR 97331-5109, USA.5Graduate Program in Applied Economics, Oregon State University, Milam 13, Corvallis, OR 97331-5109, USA.6Graduate Program in Public Policy, Oregon State
University, Milam 13, Corvallis, OR 97331-5109, USA.
Received: 3 March 2017 Accepted: 20 August 2017
References
1. Wagstaff A, O'Donnell O, Van Doorslaer E, Lindelow M. Analyzing health equity using household survey data: a guide to techniques and their implementation: World Bank Publications; 2007 Nov 2.
2. O'Donnell O, Van Doorslaer E, Wagstaff A, Lindelow M. Analyzing health equity using household survey data: a guide to techniques and their implementation. In: Washington. DC: The World Bank Google Scholar; 2008. p. 2010.
3. Tobin J. On limiting the domain of inequality. The Journal of Law and Economics. 1970 Oct 1;13(2):263–77.
4. Sen A. Why health equity? Health Econ. 2002;11(8):659–66.
5. Culyer AJ, Wagstaff A. Equity and equality in health and healthcare. J Health Econ. 1993;12:431–57.
6. Atun R, De Andrade LO, Almeida G, Cotlear D, Dmytraczenko T, Frenz P, Garcia P. Gómez- Dantés O, Knaul FM, Muntaner C, de Paula JB. Health-system reform and universal health coverage in Latin America. Lancet. 2015 Apr 3;385(9974):1230–47.
7. Crivelli L, Salari P. The inequity of the Swiss health care system financing from a federal state perspective. Int J Equity Health. 2014 Feb 14;13(1):17. 8. Duran A, Kutzin J, Menabde N. Universal coverage challenges require health
system approaches; the case of India. Health policy. 2014 Feb 28;114(2):269–77. 9. Normand C. Equity in the finance and delivery of health care: an
international perspective. Br Med J. 1993 Jul 10;307(6896):140–1. 10. Balarajan Y, Selvaraj S, Subramanian SV. Health care and equity in India.
Lancet. 2011 Feb 11;377(9764):505–15.
11. Gilson L. Government health care charges: is equity being abandoned? A discussion paper, 1988.
12. Asante A, Price J, Hayen A, Jan S, Wiseman V. Equity in health care financing in low-and middle-income countries: a systematic review of evidence from studies using benefit and financing incidence analyses. PLoS One. 2016 Apr 11;11(4):e0152866.
13. Reich MR, Harris J, Ikegami N, Maeda A, Cashin C, Araujo EC, Takemi K, Evans TG. Moving towards universal health coverage: lessons from 11 country studies. Lancet. 2016 Feb 26;387(10020):811–6.
14. World Health Organization. Global action plan for the prevention and control of noncommunicable diseases 2013–2020.
15. World Health Organization. Sixty-fourth World Health Assembly. Youth and health risks. WHA64. 28. 24 May 2011.
16. The World Bank, IBRD, IDA. Accessed on 26 June 2017, available at: http://data.worldbank.org/country/bangladesh.
18. Bangladesh National Health Account 2007-2012. Health economics unit (HEU), Ministry of Health and Family Welfare Government of the People’s Republic of Bangladesh Dhaka, 2012.
19. Majumder MA. World health statistics 2011: how does Bangladesh compare with other south-east Asian countries? South East Asia Journal of Public Health. 2013 Jan 8;1(1):4–11.
20. Bangladesh Bureau of Statistics. Bangladesh Household Income and Expenditure Survey. (2010). Statistics Division, Ministry of Planning. Government of Bangladesh; 2011. Available at: http://www.bbs.gov.bd/ WebtestApplication/userfiles/image/Latest Reports/HIES-10.pdf. Accessed Jan 2016.
21. StataCorp. Stata statistical software: release 14. College Station, TX: StataCorp LP; 2015.
22. Bilger M, Sajaia Z, Lokshin M. Health equity and financial protection: streamlined analysis with ADePT software: World Bank Publications; 2011. 23. Kakwani NC. Measurement of tax progressivity: an international comparison.
Econ J. 1977;87(345):71–80.
24. Wagstaff A, Van Doorslaer E. Equity in the finance of health care: some international comparisons. J Health Econ. 1992 Dec 1;11(4):361–87. 25. Wagstaff A, Van Doorslaer E, Van der Burg H, Calonge S, Christiansen T,
Citoni G, Gerdtham UG, Gerfin M, Gross L, Häkinnen U, Johnson P. Equity in the finance of health care: some further international comparisons. J Health Econ. 1999 Jun 30;18(3):263–90.
26. Van Doorslaer E, Wagstaff A, Van der Burg H, Christiansen T, Citoni G, Di Biase R, Gerdtham UG, Gerfin M, Gross L, Häkinnen U, John J. The redistributive effect of health care finance in twelve OECD countries. J Health Econ. 1999 Jun 30;18(3):291–313.
27. Mastilica M, Bozikov J. Out-of-pocket payments for health care in Croatia: implications for equity. Croatian Medical Journal. 1999 Jun 1;40:152–9. 28. Hamid SA, Ahsan SM, Begum A. Disease-specific impoverishment impact of
out-of-pocket payments for health care: evidence from rural Bangladesh. Applied health economics and health policy. 2014 Aug 1;12(4):421–33. 29. Somanathan A, O'Donnell O, et al. Who gets health care in Asia? EQUITAP
working paper # 4. Rotterdam and IPS, Colombo: Erasmus University; 2005. 30. O'Donnell O, van Doorslaer E, et al. Explaining the incidence of catastrophic
expenditures on health care: comparative evidence from Asia. In: EQUITAP working paper #5. Colombo: Eramsus University, Rotterdam and IPS; 2005. 31. Gertler P, Gruber J. Insuring consumption against illness. Am Econ Rev.
2002;92(1):51–70.
32. Molla AA, Chi C, Mondaca AL. Predictors of high out-of-pocket healthcare expenditure: an analysis using Bangladesh household income and expenditure survey, 2010. BMC Health Serv Res. 2017 Jan 31;17(1):94. 33. Expanding social protection for health: towards universal coverage—health
care financing strategy 2012–2032, Health economics unit, Ministry of Health and Family Welfare, Dhaka (2012).
34. Pradhan M, Prescott N. Social risk management options for medical care in Indonesia. Health Econ. 2002;11:431–46.
35. Pannarunothai S, Srithamrongsawat S, Kongpan M, Thumvanna P. Financing reforms for the Thai health card scheme. Health Policy Plan. 2000;15(3):303–11. 36. Correa-Velez I, Gifford SM, Bice SJ. Australian health policy on access to
medical care for refugees and asylum seekers. Australia and New Zealand health policy. 2005;2(1):23.
37. Johar M. The impact of the Indonesian health card program: a matching estimator approach. J Health Econ. 2009;28(1):35–53.
• We accept pre-submission inquiries
• Our selector tool helps you to find the most relevant journal • We provide round the clock customer support
• Convenient online submission • Thorough peer review
• Inclusion in PubMed and all major indexing services • Maximum visibility for your research
Submit your manuscript at www.biomedcentral.com/submit