M E T H O D O L O G Y
Open Access
Operationalizing a model to quantify
implementation of a multi-component
intervention in a stepped-wedge trial
Linnea Ferm, Charlotte Diana Nørregaard Rasmussen and Marie Birk Jørgensen
*Abstract
Background:It is challenging to interpret the results of multifaceted interventions due to complex program theories that are difficult to measure in a quantifiable manner. The aims of this paper were, first, to develop a model for a comprehensive quantitative implementation evaluation and, second, to operationalize it in the process evaluation of the stepped-wedge cluster randomized controlled trial:“Prevention of low back pain and its consequences among nurses’aides in elderly care”to investigate if implementation differed across intervention components, steps, and settings (workplaces).
Methods:Operationalization of a quantifiable measure of implementation requires three steps: (1) development
of a program logic and intervention protocol, (2) description of a complete and acceptable delivery of the intervention, and (3) description of what determines the receipt of the intervention. Program logic from a previously developed multifaceted stepped-wedge intervention was used. The optimal delivery of the intervention was defined as the deliverers’full understanding and following of the intervention protocol and that they performed their best and contributed to the participants’attention and motivation (fidelity). The optimal receipt of the intervention was defined as participants being fully present at all intervention activities (participation), being motivated and satisfied, and having a good social support (responsiveness). Measurements of the fidelity, participation, and responsiveness were obtained from logbooks and questionnaires. Fidelity was multiplied by participation to measure exposure of the intervention to the individual. The implementation was determined from optimal delivery and optimal receipt on a scale from 0 (no implementation) to 100 (full implementation) on individual and organizational level.
Results:Out of 753 sessions, 95% were delivered. The sessions were delivered with 91% success (fidelity) across the organization. Average participation, fidelity, exposure, and responsiveness were 50, 93, 48, and 89% across all participants. The implementation of the intervention was uniform across steps (p= 0.252) and workplaces (p= 0.125) but not for intervention components (p= 0.000). However, participation, fidelity, exposure, and responsiveness varied between workplaces.
Conclusions:This study developed a quantifiable implementation evaluation measuring participation, fidelity, exposure, and responsiveness. The quantifiable implementation evaluation was suitable for comparing implementation across steps, components, and settings and can be applied in the analyses on the impact of implementation of complex interventions.
Keywords: Stepped-wedge design, Process evaluation, Pragmatic trials, Fidelity, Receipt, Delivery
* Correspondence:[email protected]
National Research Centre for the Working Environment, Lersø Parkallé 105, DK-2100 Copenhagen, Denmark
Background
More and more public health interventions consist of multiple intervention components, are performed in complex settings and social structures with often hetero-geneous populations and build on complex program theories. These characteristics challenge the interpretation of classic rigid evaluations in randomized controlled trial designs since a mere effect evaluation only explains a fraction of the causal assumptions in the program theory [1, 2]. Furthermore, the effect evaluation itself risks rejecting the hypothesis underlying the program theory, due to implementation failure (type III error) [1].
Therefore, process evaluations have been increasingly developed, debated, and used. Previously, process eval-uations were mostly anecdotal and were mainly used as formative analyses rather than summative [3]. However, in recent years, a number of useful frameworks have
been developed to guide researchers’ evaluation plans
[2, 4–7]. For example, Sanchez et al. [8] offered a comprehensive guide to develop a process evaluation plan that covered both formative and summative applica-tions of different process measures (fidelity (implemented as planned), dose, reach, recruitment, and context) [8]. Furthermore, they illustrate its use in a proposed school-based case study. However, only the process evaluation
plan is presented––not the operationalized process
eva-luation in actual values or results [8]. Linnan and Steckler [5] proposed similar process measures and had concrete suggestions as to how to quantify implementation. Nevertheless, still only few process evaluations offer the opportunity to compare process outcomes between studies or to use process outcomes in mediation and/ or moderation analyses to understand which of the intervention components affect the intervention outcome [6]. For the latter, particularly level of implementation of the intervention is useful to evaluate in a quantifiable manner. Multiple determinants like the program char-acteristics (size, coverage, and complexity), setting characteristics, facilitation strategies, reach of participants
(fraction of all eligible), and the participants’ motivation
are potential predictors of the implementation and are therefore also important factors to measure and include in
process evaluations [2,6,9,10]. However, most central to
the studies’effectiveness evaluation is whether or not the
intervention was implemented as planned; and therefore, the quantifiable assessment of implementation deserves specific attention.
Implementation has been suggested to be the sum of the dose and quality of delivery of the intervention (fidelity) and the receipt of the intervention in a number of
frameworks and checklists [3–6, 11]. The receipt is
often measured merely as participation; however, re-sponsiveness is also a factor in receipt of the interven-tion [12]. It explicitly measures factors that impede or
hamper the manifestation of the intervention effect within the individual and may therefore be important to consider as a mediator, highly proximal to the intervention [12]. Implementation is however complex to assess when the intervention consists of multiple key effective components [6,13]. Furthermore, balancing fidelity against the oppor-tunity for adaptability of the intervention content to the re-ceivers can be challenging [1]. Furthermore, no one has to our knowledge provided a meaningful step by step opera-tionalized guide of how to quantify implementation in multicomponent interventions. Therefore, we developed a model with a step-by-step operationalized guide to conduct a comprehensive quantitative implementation evaluation and operationalized it in a multifaceted stepped-wedge intervention delivered to four workplaces in Denmark. The model and the step-by-step operationalized guide are highly inspired by the methods suggested by Linnan and Steckler [5], Caroll et al. [6], and Saunders et al. [4] but offer specific values for implementation that will be comparable between studies and useful to detect the most effective components in the intervention. Also, the model addresses the challenge of how to quantify the vari-able participation of individuals over learning sessions across sites and clusters in which the intervention is implemented. Furthermore, the model offers opportunity to deal with the implementation issues particularly evident in stepped-wedge designs, where the intervention is implemented to randomized groups in a phased manner, and there is a risk that implementation changes over time (i.e., with increased experience among intervention deliverers) which challenges the interpretation of the effect analyses [14]. Thus, the quantification of implemen-tation may be vital in building an evidence base that informs policy and practice [2]. Therefore, the aim of this paper was, first, to develop a model for a comprehensive quantitative implementation evaluation and, second, to give a step-by-step guide by operationalizing it in a multifa-ceted stepped-wedge intervention implemented in four workplaces and to investigate if implementation differed across intervention components, delivery timings (trial steps), and the workplaces (settings) involved.
Methods
In the development of a model for a comprehensive quantitative implementation evaluation, we have carefully reviewed existing theories and process evaluation
frame-works and models [4–6]. Hence, the current model is not
a new theory in itself or a new view on implementation, but a quantitative operationalization of previous theories.
Development of the model of how to quantify implementation in multicomponent interventions
Previous theories and frameworks [4, 5] suggest that
of the intervention(dose, content (the amount and propor-tion), and quality of the intervention that are delivered as
planned) and (2) receipt of the intervention(the amount
received and perceived by the participants as intended). To be able to develop a quantifiable implementation measure, it is important to be particularly specific regard-ing these aspects. Thus, the followregard-ing three steps aim to guide which aspects need to be particularly carefully considered for the implementation model to work: (1) development of a program logic and an intervention protocol, (2) define what determines an optimal delivery of the intervention, and (3) define what is an optimal receipt of the intervention.
1) Development of program logic and intervention protocol
First, a program logic must be developed describing the purpose of the program, the objectives, the change process, the expected impact, and outcome of the inter-vention. The program logic should be supported by an
operationalized program logic––a written intervention
protocol for the intervention deliverers, that specifies:
– Which are the effective components? – How important is fidelity compared with
adaptation? That is, should the protocol be strictly followed or is there room for adapting the content to the target group, and if yes, how much?
2) Description of complete and acceptable delivery of the intervention
Elements of the intervention that need to be delivered during the study to preserve treatment integrity should be defined as pre-specified success criteria for each of the intervention components for each of the sessions and written in the intervention protocol. With the clear definition of the success criteria, also opportunities for adaptability of the intervention content to the receivers must be clarified. Finally, the success criteria should be measurable (i.e., so that questions for measuring the pre-specified success criteria can be developed).
3) Description of what determines receipt of the intervention
Particularly for the receipt of the intervention, it is highly up to the developers of the program logic to define what are the key components that determine when an individual has received an intervention. For example, an intervention may happen at a higher organizational level, i.e., at team level. Then, what determines how much the individual is exposed to the intervention? A very simple
measurement of receipt of the intervention, often used in previous implementation evaluations, is participation or attendance [15]. However, it must be pre-defined by the researchers which degree of participation is needed and whether for example co-worker/peer participation contaminate others? However, apart from the mere presence of a participant, also responsiveness to an intervention, may determine how much of the intervention is taken up by the individual. Factors previously suggested to impact responsiveness may be motivation for the intervention, satisfaction, engagement, pre-intervention expectations, knowledge, and social support during the intervention [12]. In some instances, such factors may have a very small and perhaps negligible role (for example, in case of a merely structural intervention) and in some cases, it may have a highly determining role (for example, in case of a choice-based intervention). The role of the responsiveness must be considered and made measurable before the implementation can be quantified.
The complex multifaceted stepped-wedge intervention For the current example study, the program logic has been reported in a research protocol [16]. We designed a multifaceted intervention for the prevention of low
back pain (LBP) among nurses’ aides in elderly care in
Denmark evaluated in a stepped-wedge randomized controlled trial. The intervention was built on a compre-hensive theoretical framework of both effectiveness and implementation in the development and planning of the intervention [17] and used a participatory approach that involved all levels of the organization (management, supervisor, workers). In short, the intervention lasted 3 months and consisted of a combination of participa-tory ergonomics (PE), physical training (PT), and cognitive behavioral training (CBT) and was conducted in the teams at the workplace. PE consisted of a kick-off meeting for all participants where an ergonomic working group was formed that participated in two workshops and two evaluation meetings. The PE was conducted as an organizational intervention meaning that only a subgroup of the participants was to participate in the workshops and evaluation meetings and that contamination to the rest of the team was expected. CBT consisted of two workshops of 3-h duration for all participants. PT consisted of 12 weekly 1-h sessions for all participants. In total, the intervention consisted of 19 sessions/ 27 h (PT (12 sessions/12 h), CBT (2 sessions/6 h), and PE (5 sessions/9 h)). The intervention was con-ducted during paid working hours and delivered by six local trained physiotherapists and occupational therapists (deliverers). The optimal delivery of the intervention required that the deliverers fully understood and followed the intervention protocol that they performed their best
motivation. An optimal receipt of the intervention required that the participants were present at all PT sessions, and all CBT sessions and that their work team was present at all PE sessions and that they were motivated, satisfied with the interventions, and had a perception of high support during the sessions. The multifaceted intervention was conducted in 2013/ 2014 and is described in detail in Rasmussen et al. 2013 [16], and the effect on LBP is reported in Rasmussen et al. 2015 [18].
The workplaces, which were recruited to participate in the trial (adoption), and the employees, who were chosen to be enrolled in the trial (reach) have been described previously. In short, 9 workplaces (districts) in a municipality were offered participation. Four of the nine workplaces in the elderly care administration of the municipality adopted the project corresponding to 44%. There were 1074 eligible employees from 58 teams and of those 594 wanted to participate and were randomized to the intervention [19]. The participants were randomized to 4 groups beginning the intervention at 4 different time points, with 126 participants in group 1, 146 participants in group 2, 158 participants in group 3, and 164 participants in group 4. The intervention components were to be delivered equally to all teams in the four workplaces.
Measures
The data were gathered from questionnaires for the
participants and from deliverer logbooks (Table 1).
Moreover, in order to check the quality of the deliverers’
responses to the logbooks, observations of random sessions were conducted. The observations were all conducted by one observer, and the observation guide included the exact same questions as the questions posed in the deliverer logbooks.
Delivery of the intervention (fidelity)
DoseThe number of sessions delivered compared to the
number of sessions that were supposed to be delivered during the entire intervention was registered.
Content (success criteria) To measure if the deliverers followed the intervention protocol, the success criteria within each component for each session were measured by asking the deliverers to fill in a logbook after each session. The logbooks were specifically developed for each type of session to match the success criteria for that specific session. It was explained to the deliverers that the logbooks were for analyses purposes only and
possible poor ratings of one’s own performance as a
deliverer would not be criticized or used against them. All in all, 55 questions were included in the logbooks
over the course of all sessions. The questions were“Have
you implemented the following according to the manual:
(success criteria)?” with (success criteria) substituted
with the specific success criteria for each part of the
session (i.e., “generated ergonomics working groups?”).
The response categories for all the success criteria
ques-tions were“not implemented,” “partly implemented,” “
com-pletely implemented”, and “implemented more in depth.”
The last response category was included to contribute to possible more in depth understanding of the implementation since more in depth implementation of one theme may compensate for less implementation of
another theme [8]. However, the“implemented more in
depth” option is not used in the calculation of the
implementation. Therefore, answers “completely
im-plemented” and “implemented more in depth” on the
4-point scale were scored 100, “partly implemented”
was scored 50, and “not implemented” was scored 0.
Specifically, for the PT sessions, the extent the PT fulfilled the success criteria also considered the physical intensity of the sessions. The intensity was evaluated by the instructor in the instructor logbooks measured as the maximal intensity during the PT at a group level on a scale ranging from 0 to 10. The scale was scored
as 0–3 = 0, 4–5 = 50, 6–7 = 75, and 8–10 = 100.
Quality (deliverers’ performance) The quality of the
intervention was measured as the deliverers’ performance
in terms of understanding, contribution, and overall self-rated performance in the logbooks [8]. Understanding and
contribution to the participants’learning both consisted of
four questions on a 5-point scale with response categories: To a very large extent/to a large extent/somewhat/to a small extent/to a very small extent. The four questions
posed concerning understanding were“To which extent
(i) has the activity of the day (as described in the manual) been easy to comprehend? (ii) Did you have a
clear understanding of today’s theme(s)? (iii) Do you think
today’s themes were relevant? (iiii) Do you think
today’s themes were interesting?”. The four questions
concerning contribution to the participants’ learning
were:“Regarding today, to which extent have you
contrib-uted to (i) the participants’commitment and motivation?
(ii) Ensuring the participants’participation in the course?
(iii) Adapting the course to the needs of the participants?
And (iiii) maintaining the participants’ attention?” The
deliverers’ self-rated performance was measured by one
question: “Suppose that your performance, at its best,
equals 10 points. How would you rate your performance
today?”The response categories were on a scale from 0 to
10, where 0 corresponds to“not capable to perform” and
10 corresponds to “best performance.” For the 5-point
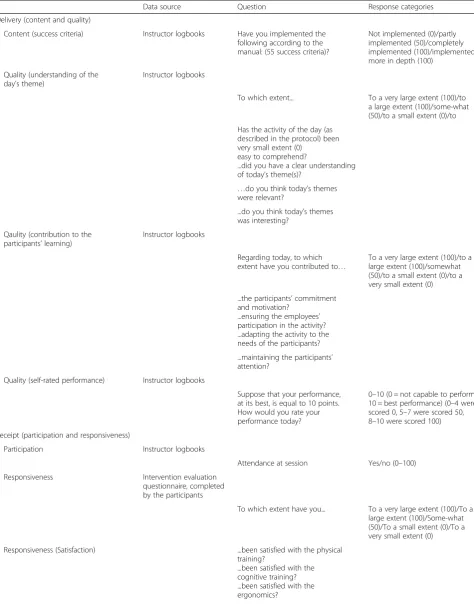
Table 1Overview of data sources, questions, and response categories that constitute each of the concepts that are involved in the implementation (delivery (content and quality) and receipt (participation and responsiveness)). All response categories were scored into a scale from 0 to 100 (numbers given in parentheses after each of the response categories)
Data source Question Response categories
Delivery (content and quality)
Content (success criteria) Instructor logbooks Have you implemented the following according to the manual: (55 success criteria)?
Not implemented (0)/partly implemented (50)/completely implemented (100)/implemented more in depth (100)
Quality (understanding of the day’s theme)
Instructor logbooks
To which extent... To a very large extent (100)/to a large extent (100)/some-what (50)/to a small extent (0)/to
Has the activity of the day (as described in the protocol) been very small extent (0)
easy to comprehend?
...did you have a clear understanding of today’s theme(s)?
…do you think today’s themes were relevant?
...do you think today’s themes was interesting?
Qaulity (contribution to the participants’learning)
Instructor logbooks
Regarding today, to which extent have you contributed to…
To a very large extent (100)/to a large extent (100)/somewhat (50)/to a small extent (0)/to a very small extent (0)
...the participants’commitment and motivation?
...ensuring the employees’ participation in the activity? ...adapting the activity to the needs of the participants?
...maintaining the participants’ attention?
Quality (self-rated performance) Instructor logbooks
Suppose that your performance, at its best, is equal to 10 points. How would you rate your performance today?
0–10 (0 = not capable to perform; 10 = best performance) (0–4 were scored 0, 5–7 were scored 50, 8–10 were scored 100)
Receipt (participation and responsiveness)
Participation Instructor logbooks
Attendance at session Yes/no (0–100)
Responsiveness Intervention evaluation
questionnaire, completed by the participants
To which extent have you... To a very large extent (100)/To a large extent (100)/Some-what (50)/To a small extent (0)/To a very small extent (0)
Responsiveness (Satisfaction) ...been satisfied with the physical
training?
in the middle was scored 50. The 0–10 scale regarding the
deliverers’ self-rated performance was scored as follows:
0–4 = 0, 5–7 = 50, and 8–10 = 100.
ExposureThe uptake of the intervention is dependent on whether the participant attends a session or not and on the fidelity of the sessions that the participant attended. Therefore, exposure was calculated as the sum of the fidelity of attended sessions (see more in calculation).
Receipt of the intervention
Participation For all sessions in PT and CBT, participa-tion was calculated based on individual presence at a session (yes/no) weighted according to the duration of
the session registered through the deliverers’ logbooks.
This was also done for the kick-off meeting, where all were invited to participate. However, in the four sessions of PE, where only a subgroup was participating, the participation was calculated on team level based on supervisor affiliation, and the participation for each team were assigned to each worker of the specific team. This was to allow that all workers were given participation since the PE was anticipated to affect all workers within a team (contamination). The participation for the PE was calculated as a combined participation score and continuity score. The participation score was the percentage of participants, according to a required number of represen-tatives weighted according to the duration of the session. A supervisor with less than five workers were required
to have two representatives participating in the sessions, a
supervisor with 5–9 workers was required to have three
representatives in the sessions, a supervisor with 10–14
workers was required to have four representatives in the
sessions, a supervisor with 15–19 workers was required to
have five representatives in the sessions, and a supervisor with 20 or more workers was required to have 6 represen-tatives in the sessions. The continuity score was calculated as the team participation score with an exception that the score was dependent of whether it was the same representatives participating in all the sessions since it was anticipated that continuation would improve imple-mentation. The total percentage for the PE were calculated by summing the team participation score and the continuity score and divide it by 2, and the value was assigned to each worker of the respective team. Finally, the overall participation of all the sessions was calculated by summing the PE participation with the PT and CBT participation weighted according to the overall duration of the sessions (27 h).
Responsiveness Participants’ responsiveness was mea-sured by satisfaction, social support, and motivation [8, 12]. The participants were asked to fill in a ques-tionnaire at the end of the entire intervention.
The questions regarding satisfaction of the interven-tion included six quesinterven-tions with responses on a 5-point scale with response categories being: to a very large extent/to a large extent/some-what/to a small extent/to a very small extent. The first three questions referred
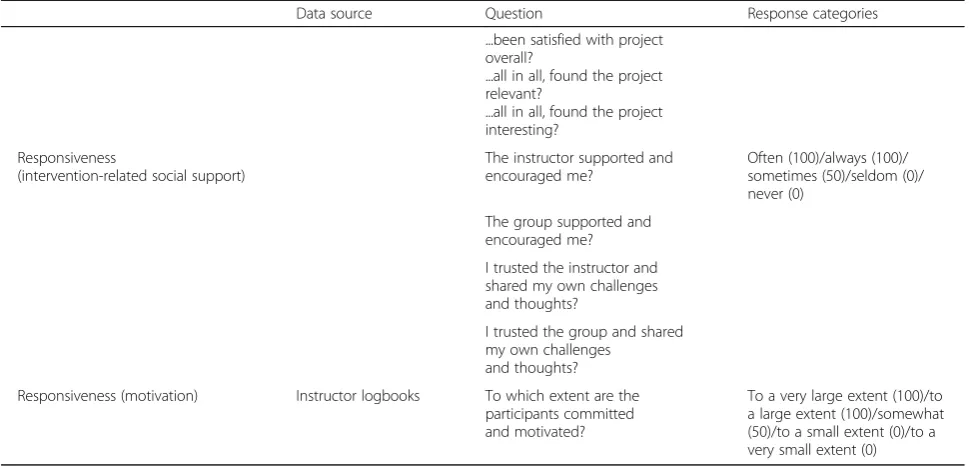
Table 1Overview of data sources, questions, and response categories that constitute each of the concepts that are involved in the implementation (delivery (content and quality) and receipt (participation and responsiveness)). All response categories were scored into a scale from 0 to 100 (numbers given in parentheses after each of the response categories)(Continued)
Data source Question Response categories
...been satisfied with project overall?
...all in all, found the project relevant?
...all in all, found the project interesting?
Responsiveness
(intervention-related social support)
The instructor supported and encouraged me?
Often (100)/always (100)/ sometimes (50)/seldom (0)/ never (0)
The group supported and encouraged me?
I trusted the instructor and shared my own challenges and thoughts?
I trusted the group and shared my own challenges
and thoughts?
Responsiveness (motivation) Instructor logbooks To which extent are the participants committed and motivated?
exclusively to one of the three intervention components:
“To which extent have you been satisfied with (the PT/
the cognitive behavioral training/the ergonomics)?” The
final three questions referred to the overall intervention:
“To which extent have you been satisfied with the
project overall?”and“To which extent have you all in all
found the project (relevant/interesting)?”
Intervention-related social support was measured in the questionnaire for the participants and included four questions on a 5-point scale with response categories being: always/often/sometimes/seldom/never. The questions
posed were: (i) “The deliverer supported and encouraged
me?”, (ii) “The group supported and encouraged
me?”, (iii) “I trusted the deliverer and shared my own
challenges and thoughts?”, and (iiii) “I trusted the group
and shared my own challenges and thoughts?”
Participants’ motivation was measured by a question
in the deliverers’ logbook: “To which extent are the
participants committed and motivated?” The answer
categories were on a 5-point scale: to a very large extent/ to a large extent/some-what/to a small extent/to a very small extent.
The 5-point scale was scored with the two most positive answers as 100, the two most negative answers were scored 0, and the question in the middle was scored 50.
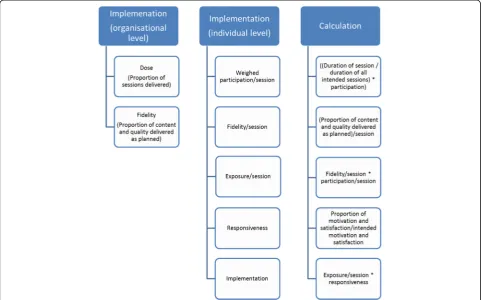
Calculation of the implementation at organizational level and individual level
The calculation of implementation is based on several data extracted from the data collection. The imple-mentation is calculated at the organizational level to describe the overall implementation of the intervention according to the protocol for the organization as a whole. Organization level implementation can be used to give an estimate of how well the organization implements the intervention. The individual level implementation gives a number to each individual participant indicating their specific level of implementation according to the protocol and can be used to analyze the association to individual outcomes. Individual level implementation is highly dependent on the organizational level implementation since, for example, the individual participant cannot gain a session, if it is canceled by the organization. However, the organizational level implementation is also dependent on
the individual participants’implementation. Therefore, the
mean implementation of all individuals will be close to similar to the organizational level implementation.
Implementation at organizational level
For the calculation of the implementation at
organizational level, three numbers are needed. First,
the overall dose delivered (D) is calculated as the
percentage of sessions delivered (Dd) per number of
sessions intended to deliver according to the protocol
(Di):
D¼Dd=Di
For example, if the protocol is to deliver 800 sessions, but only 700 sessions are delivered, the dose would be:
D¼700=800¼0:87588%
Second, the proportion of fidelity (F) (content (C) and quality (Q)) delivered compared to the protocol is calculated. Since C and Q are measured as a percentage delivery according to the protocol, equaling 100%, the fidelity is calculated as:
F¼CþQ=2
In an example where 50% of the content is delivered with 80% of the quality, the fidelity is:
F¼0:5þ0:8=2¼0:6565%
The overall organizational level implementation would then be calculated as the average of dose and fidelity:
Dþ F=2¼0:875þ0:65=2¼0:762576%
Implementation at the individual level
Implementation at the individual level consists of fidelity, participation, and responsiveness. Since the fidelity varies from session to session, and participation is session-dependent, implementation at individual level has to be calculated at session level first.
Fidelity at session level (Fs) is calculated as session
level delivery of content (Cs) and quality (Qs), where
both Cs and Qs are measured as a percentage of what
was specified in the protocol, equaling 100%:
Fs¼CsþQs=2
An individual is only exposed to the Fs if he or she
participates at the session (Ps). Participation at a session
is either yes (=1) or no (=0) and for ergonomic sessions which are team-dependent any number between 0 and 1. Furthermore, session participation needs to be weighed according to the participation in all sessions as specified in the protocol. That is, if one participant is present at one session of 3-h duration, out of 27 h of intervention sessions in total, the participation will
To calculate how much fidelity the individual then has been exposed to, we calculate session level
exposure (Es) as:
Es¼ FsPs
That is, for example, ifFs= 0.65 andPs= 0.11, then
Es¼0:650:11¼0:0727%
This means that the individual is exposed to 7% of the total intervention during this session of 3-h duration.
However, even though the exposure is 7%, the
individ-ual responsiveness (R) will determine the uptake of the
exposure, and therefore, the individual session level
implementation (Is) will be:
Is¼EsR
An individual responsiveness may be 80% (R= 0.8),
andIswill then be:
Is¼0:0720:8¼0:05766%
If either of the factors that constitute implementation
(Fs,Es,Ps, orR) equals 0, implementation will be zero.
Finally, to calculate the total exposure and imple-mentation at individual level, all the exposure and all the implementation values are summed for all of the sessions, respectively.
For exposure:
Eall¼Sum Es1þ
Es2þEs3………:
For implementation:
Iall¼Sum Is1þIs2þIs3………:
At the end, each individual will have a session-level exposure and a session-level implementation and a total exposure and total implementation that may range from 0 to 100. Finally, a mean exposure and mean implementation can be calculated for the pop-ulation as a whole and can be stratified for the different intervention components (PE, PT, and CBT), the work-places and the delivery timing (steps of the stepped-wedge design).
The calculations are summarized in Fig.1.
Analyses
With Principal Component Analysis (PCA), we investi-gated whether we could make separate indexes for the measures regarding the quality of the intervention (understanding, contribution, overall self-rated performance) and responsiveness (satisfaction, support, motivation).
The participants who responded to the intervention evaluation questionnaire were compared to the
non-responding participants with a Pearson’s chi-square
test for categorical variables and Student’s t test for
continuous variables.
The inter-rater reliability of the deliverer logbooks was tested against random samples of session observations by an intraclass correlation analysis supported by a Bland-Altman plot.
To investigate the degree of implementation across different factors (delivery timing (the stepped-wedge design) and workplaces), ANOVA tests were used. For post hoc analyses to determine where the groups may differ, we used Tukey or Games Howell depending on whether the data met the homogeneity of variance assumption. To investigate the degree of implementation between intervention components, we used a repeated measures ANOVA. For post hoc analyses to determine where the groups may differ in intervention components, we used the Bonferroni test.
The group responding to the intervention evaluation
questionnaire (N= 299 (50%)) is constituted purely by
those participants who were present at the last session; and therefore, it is a selected group with a much higher participation (68%) than the entire population (50%). Therefore, the analyses on the differences within the delivery timings, intervention components, and work-places are conducted both on fidelity, participation, responsiveness, and the implementation score (only on the selected population of responders) and on the exposure score (both on the selected and on the entire population).
Results
The PCA for quality of the intervention showed that two separate indexes could be made based on the original questions posed. The items regarding understanding constituted one index with a Cronbach alpha of 0.812, and the items regarding contribution constituted the second index with a Cronbach alpha of 0.836. Overall self-rated performance did not fit into any of the indexes and therefore constituted a measure in itself.
The PCA for the responsiveness of the intervention showed that two separate indexes could be made based on the original questions posed. The items regarding satisfaction constituted one index (Cronbach alpha = 0.862), and the items regarding social support constituted the sec-ond index (Cronbach alpha = 0.660).
There were 299 participants that answered the inter-vention evaluation questionnaires (responders) and 295 who did not (non-responders). Responders were signifi-cantly older (48 years) than non-responders (46 years)
(p= 0.012), and responders had significant higher
partici-pation (68%) than non-responders (32%). No differences were found in gender, ethnicity, or LBP days at baseline. The inter-rater reliability of the deliverer logbooks tested against 44 random samples of session observations with an intraclass correlation analysis supported by a Bland-Altman plot showed a tendency towards a general over-estimation of performance from the deliverers compared to the observer (data not shown).
Delivery of the intervention
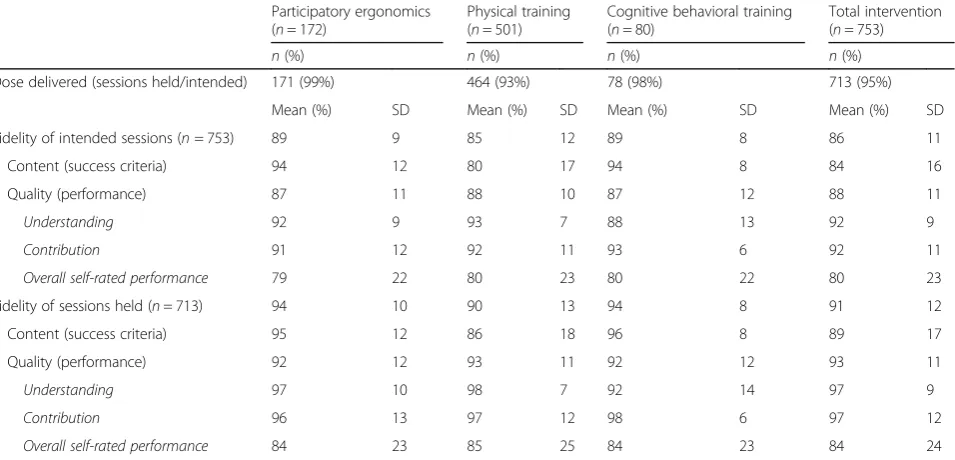
In Table 2, the dose delivered of each of the three
in-tervention components and the total inin-tervention at organizational level are shown. A total of 713 sessions were delivered (95%). The mean score for delivery was 99, 93, and 98% for PE, PT, and CBT, respectively. The fidelity of the sessions specified in the protocol varied from 85 to 89%, and the fidelity of the sessions held varied from 90 to 94%.
In Table 3, the delivery (fidelity and exposure) of each
of the three intervention components and the total intervention at individual level are shown. The mean fidelity for the total intervention was 93%. The mean score for fidelity was 92, 91, and 95% for PE, PT, and
CBT, respectively. Furthermore, Table3shows the mean
exposure of individuals in each of the three intervention components and in total. The exposure for the total intervention was 48%, and 63, 34, and 45% for PE, PT, and CBT, respectively.
Table 3 also shows the receipt (participation and
responsiveness) of the intervention. Responsiveness was based on measurements of those answering the
follow-up questionnaire (n= 299). The mean responsiveness
for the total intervention was 89%. The mean score for responsiveness was 90, 91, and 92% for PE, PT, and CBT, respectively. The average participation for the total intervention was 50%. The average participation for PE, PT, and CBT was 66, 38, and 48%, respectively.
The final implementation score (responsiveness
(R) × exposure (E)) for the total intervention was 56%,
and for PE, PT, and CBT the implementation was 60, 30, and 35%, respectively.
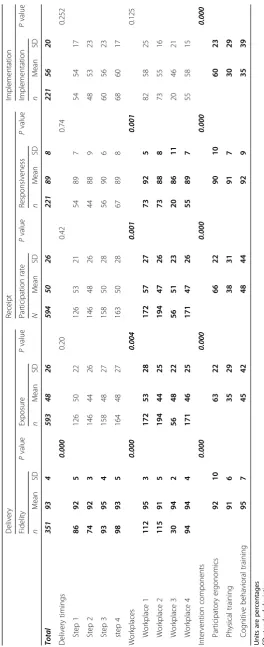
Table 4 shows the results of the implementation
components across delivering timings, workplaces, and intervention components. For delivering timings, there
were significant differences in fidelity (p= 0.000).
For workplaces, there were significant differences in
fidelity (p= 0.000), exposure (p= 0.004), participation
components, all implementation components were
statistically significant different (p= 0.000).
Discussion
This study presents an operationalization of a quantifiable implementation evaluation suitable for interventions implemented at multiple organizational levels and with multiple components. It shows that implementation can be measured at both organizational level and at individual level, in a manner, that offers analyses across settings, timings, and components of interventions. The specific evaluation of the multifaceted intervention at hand shows that this effective intervention was delivered with a 91% success. Adding both fidelity and responsive-ness to the participation measure reduces the impression of a highly implemented intervention and underlines the importance of more comprehensive implementation measures than just participation to understand the implementation. Finally, this study shows to which degree a stepped-wedge, multifaceted, multicenter inter-vention can be delivered with uniformity across timings but not workplaces and intervention components. First, the steps of the trial did not seem to introduce biasing learning effects in the intervention delivery. Second, the intervention components were delivered with varying success. Third, the delivery was dependent on workplaces. The different results of this study are discussed in relation to previous literature in the following.
The operationalization of the quantifiable implementation evaluation
The operationalization presents a doable solution to quantifying implementation in a way that offers comparison with the intervention across components, timing of delivery, and settings. More in depth analyses can also be conducted, for example, to evaluate learning across sessions, differences in fidelity across deliverers, or to study the contribution of fidelity at the first sessions for participation in later sessions. However, most importantly, the quantifiable implementation measures can be used for analyzing the impact of implementation on the effect-iveness of the study. For example, linear regressions can be performed between implementation and the primary outcome and perhaps even reveal if there are different impacts of different components of the intervention on the primary outcome. Previously, dose-response analyses have been performed in interventions, showing that higher dosage of an intervention was associated with higher effect [20]. However, the study did not allow for the comparison between intervention components and implementation was based on participation only. It is increasingly recognized that to obtain effectiveness in implementation studies, multiple effective components may be necessary and multiple implementation consider-ations are paramount. However, the more complex the
intervention, the bigger the“black box” in the evaluation.
Thus, by pre-defining and measuring each of the effective and implementation components, the content of the black
Table 2Dose delivered of each of the three intervention components and the total intervention at session level according to the
753 sessions that were intended to be held and the 713 sessions that were actually held, and fidelity of intended sessions according to the protocol (fidelity × percentage of sessions held) and the fidelity of those sessions that were held
Participatory ergonomics (n= 172)
Physical training (n= 501)
Cognitive behavioral training (n= 80)
Total intervention (n= 753)
n(%) n(%) n(%) n(%)
Dose delivered (sessions held/intended) 171 (99%) 464 (93%) 78 (98%) 713 (95%)
Mean (%) SD Mean (%) SD Mean (%) SD Mean (%) SD
Fidelity of intended sessions (n= 753) 89 9 85 12 89 8 86 11
Content (success criteria) 94 12 80 17 94 8 84 16
Quality (performance) 87 11 88 10 87 12 88 11
Understanding 92 9 93 7 88 13 92 9
Contribution 91 12 92 11 93 6 92 11
Overall self-rated performance 79 22 80 23 80 22 80 23
Fidelity of sessions held (n= 713) 94 10 90 13 94 8 91 12
Content (success criteria) 95 12 86 18 96 8 89 17
Quality (performance) 92 12 93 11 92 12 93 11
Understanding 97 10 98 7 92 14 97 9
Contribution 96 13 97 12 98 6 97 12
Overall self-rated performance 84 23 85 25 84 23 84 24
box is revealed and the analyses of them may even offer knowledge that will change our understanding of effective and implementation components in multicomponent interventions.
The evaluation of the implementation across delivery timing, intervention components, and workplaces
This study showed that using the stepped-wedge design was not a threat to the delivery and implementation of the intervention. Previous papers have discussed pros and cons for the stepped-wedge design and the risk of changed implementation of the intervention from step
to step [14,21]. Factors typically mentioned as threats to
the uniform implementation are learning effects among the deliverers, organizational changes across time, or secular trends. However, these did not seem to impact the implementation of the current study.
The study showed some difference in the implementation of the three components; the CBT and PE were most highly implemented, whereas PT was least implemented as planned. This may indicate, that in a workplace setting,
CBT and PE are easier to implement than PT. The reasons for this may be that participation is easier in CBT and PE sessions, which were delivered over a longer time slots of 3 h and thus required that the workplace logistic manager organized the logistics and called in substitute employees
during the sessions leaving the participants with true“time
off”from daily tasks. PT was conducted every week for 1 h
and required ongoing continuous participation of the workers. Thus, for future implementation of such an intervention, consideration of how the PT should be delivered ought to be considered. However, to fully under-stand why PT was less well implemented, qualitative process evaluation methods could provide valuable knowledge.
There were some differences in the implementation across workplaces. Studying the different implementation measures reveals that both fidelity, exposure, participation, and responsiveness were different, but the overall imple-mentation did not differ across workplaces. This finding again underlines the importance of separating compo-nents of implementation measures to gain insight into what hampers the implementation. The differences ob-served in implementation components across workplaces
Table 3Delivery (fidelity and exposure) and receipt (responsiveness and participation rates) for each of the three intervention components
and the total intervention at individual level (weighted according to duration of sessions)
Participatory ergonomics Physical training Cognitive behavioral training Total intervention
N Mean (%) SD n Mean (%) SD N Mean (%) SD n Mean (%) SD
Delivery
Fidelity 583 92 10 427 91 6 353 95 7 351 93 4
Content (success criteria) 583 97 4 427 88 7 353 97 6 351 94 4
Quality (performance) 583 91 14 427 94 6 353 92 10 351 93 6
Understanding 583 94 13 427 98 4 353 94 12 351 96 6
Contribution 583 94 13 427 98 5 353 98 5 351 97 5
Overall self-rated performance 583 83 18 427 85 15 353 86 19 351 85 11
Exposure 594 63 22 594 34 29 594 45 42 594 48 26
Content (success criteria) 594 64 22 594 33 27 594 46 42 594 48 26
Quality (performance) 594 61 23 594 36 30 594 44 41 594 47 26
Understanding 594 64 23 594 37 31 594 45 42 594 49 27
Contribution 594 64 23 594 37 31 594 47 43 594 49 27
Overall self-rated performance 594 57 23 594 33 28 594 41 39 594 43 25
Receipt
Responsiveness 224 90 10 251 91 7 224 92 9 221 89 8
Satisfaction 227 83 20 257 88 18 253 85 19 225 83 19
Social support 269 93* 14* 269 93* 14* 269 93* 14* 269 93* 14*
Motivation 594 91 18 427 96 6 353 93 15 594 92 16
Participation 594 66 22 594 38 31 594 48 44 594 50 26
Implementation 224 60 23 251 30 29 224 35 39 221 56 20
The delivery and receipt and each of the components that constitute these are measured on a scale between 0 and 100, with 100 being the optimal delivery and is therefore expressed in percentage
indicate that the contexts are of greater importance for the implementation than the actual intervention itself.
Limitations of this study include a tendency towards a general overestimation from the deliverers compared to the observer as found in the inter-rater reliability of the logbooks. The questions that we used may be influenced by intentional false reporting, inattentive responding, or memory limitations that introduce a bias. Therefore, data collection procedures should be considered when collecting data of fidelity. Furthermore, this study is explorative, and more trials of the quantifiable imple-mentation evaluation will improve our understanding of the model for our understanding of implementation. For instance, the current model relies on a thorough pre-paration of a protocol by the main researchers, as given in the three steps in the methods section. That protocol
is what for this model has determined the “optimal”
implementation. However, whether the anticipation of the optimal implementation was correct and how the different implementation measures may interact needs further studies of these data. Moreover, operationalizing constructs is only one aspect of making a model testable. It also requires information about construct validity and knowledge about the generalizability of the model and which contexts or factors might limit its applicability. This warrants for further testing of the model.
Conclusion
This study developed an operationalization of a quan-tifiable implementation evaluation measuring participation, fidelity, exposure, and responsiveness. The evaluation is suitable for interventions implemented at multiple organizational levels, where implementation can be measured at both organizational level and at individual level. The implementation evaluation was applied to a multifaceted intervention and showed that the interven-tion sessions were delivered with a 91% success (fidelity). The implementation of the interventions was uniform across steps, intervention components, and workplaces. However, participation, fidelity, exposure, and respon-siveness varied between workplaces and intervention com-ponents. The quantifiable implementation evaluation can be applied in analyzing the impact of implementation on the effectiveness of complex interventions.
Acknowledgements
We thank all research team members and workplaces and employees who contributed to the study.
Funding
The implementation of the intervention was externally funded by The Danish Working Environment Research Fund (journal number 201100813) and the National Prevention Fund (journal number 11-2-1a-113). This study was financed by the Danish Government through a grant to the FOR-SOSU program (SATS 2004) at the National Research Centre for the Working Environment. The funding source did not take part in the study design,
data collection, interpretation of the results, writing of the manuscript, or decisions regarding publication of the manuscript.
Availability of data and materials
Can be given upon request to the corresponding author.
Authors’contributions
All authors created the study concept and design. All authors contributed equally to the analysis and interpretation of the data as well as drafting of the paper. All authors have approved the final version of the manuscript.
Ethics approval and consent to participate
The study has been approved by the Danish Data Protection Agency and the Ethics Committee for the regional capital of Denmark (journal number H-4-2012-115).
Consent for publication
Not applicable.
Competing interests
The authors declare that they have no competing interests.
Publisher’s Note
Springer Nature remains neutral with regard to jurisdictional claims in published maps and institutional affiliations.
Received: 5 June 2017 Accepted: 29 January 2018
References
1. Durlak JA, DuPre EP. Implementation matters: a review of research on the influence of implementation on program outcomes and the factors affecting implementation. Am J Community Psychol. 2008;41:327–50. 2. Moore GF, Audrey S, Barker M, Bond L, Bonell C, Hardeman W, Moore L,
OΓÇÖCathain A, Tinati T, Wight D. Process evaluation of complex interventions: Medical Research Council guidance.BMJ 2015, 350:h1258. 3. Egan M, Bambra C, Petticrew M, Whitehead M. Reviewing evidence on
complex social interventions: appraising implementation in systematic reviews of the health effects of organisational-level workplace interventions. J Epidemiol Community Health. 2009;63:4–11.
4. Saunders RP, Evans MH, Joshi P. Developing a process-evaluation plan for assessing health promotion program implementation: a how-to guide. Health Promot Pract. 2005;6:134–47.
5. Linnan L, Steckler A. Process evaluation for public health interventions and research. California: Jossey-Bass San Francisco; 2002.
6. Carroll C, Patterson M, Wood S, Booth A, Rick J, Balain S. A conceptual framework for implementation fidelity. Implement Sci. 2007;2:1. 7. Nielsen K, Abildgaard JS. Organizational interventions: a research-based
framework for the evaluation of both process and effects. Work Stress. 2013;27:278–97.
8. Sánchez V, Steckler A, Nitirat P, Hallfors D, Cho H, Brodish P. Fidelity of implementation in a treatment effectiveness trial of reconnection youth. Health Educ Res. 2007;22:95–107.
9. Linnan LA, Sorensen G, Colditz G, Klar N, Emmons KM. Using theory to understand the multiple determinants of low participation in worksite health promotion programs. Health Educ Behav. 2001;28:591–607. 10. Grol R, Wensing M. What drives change? Barriers to and incentives for
achieving evidence-based practice. Med J Aust. 2004;180:S57–60. 11. Glasgow RE, Klesges LM, Dzewaltowski DA, Estabrooks PA, Vogt TM.
Evaluating the impact of health promotion programs: using the RE-AIM framework to form summary measures for decision making involving complex issues. Health Educ Res. 2006;21:688–94.
12. Nielsen K, Randall R, Albertsen K. Participants’appraisals of process issues and the effects of stress management interventions. J Organ Behav. 2007;28:793–810.
13. Little EA, Presseau J, Eccles MP. Understanding effects in reviews of implementation interventions using the Theoretical Domains Framework. Implement Sci. 2015;10:1.
15. Wierenga D, Engbers LH, Van Empelen P, Duijts S, Hildebrandt VH, Van Mechelen W. What is actually measured in process evaluations for worksite health promotion programs: a systematic review. BMC Public Health. 2013;13:1.
16. Rasmussen CDN, Holtermann A, Mortensen OS, Søgaard K, Jørgensen MB. Prevention of low back pain and its consequences among nurses' aides in elderly care: a stepped-wedge multi-faceted cluster-randomized controlled trial. BMC Public Health. 2013;13
17. Bartholomew LK, Parcel GS, Kok G. Intervention mapping: a process for developing theory and evidence-based health education programs. Health Educ Behav. 1998;25:545–63.
18. Rasmussen CD, Holtermann A, Bay H, Sogaard K, Birk JM. A multifaceted workplace intervention for low back pain in nurses’aides: a pragmatic stepped wedge cluster randomised controlled trial. Pain. 2015;156:1786–94. 19. Rasmussen CD, Larsen AK, Holtermann A, Søgaard K, Jørgensen MB.
Adoption of workplaces and reach of employees for a multi-faceted intervention targeting low back pain among nurses’aides. BMC Med Res Methodol. 2014;14:60.
20. Pedersen MT, Andersen LL, Jørgensen MB, Søgaard K, Sjøgaard G. Effect of specific resistance training on musculoskeletal pain symptoms:
dose-response relationship. J Strength Cond Res. 2013;27:229–35. 21. Kotz D, Spigt M, Arts IC, Crutzen R, Viechtbauer W. Use of the stepped wedge
design cannot be recommended: a critical appraisal and comparison with the classic cluster randomized controlled trial design. J Clin Epidemiol. 2012;65:1249–52.
• We accept pre-submission inquiries
• Our selector tool helps you to find the most relevant journal • We provide round the clock customer support
• Convenient online submission • Thorough peer review
• Inclusion in PubMed and all major indexing services • Maximum visibility for your research
Submit your manuscript at www.biomedcentral.com/submit