Analyzing The Impact Of Weather Parameters
On Thermal Behavior Of A Building In Composite
Climate In India Through Predictive Modeling
MANISHA YADAV, DR. ANIL K. BERWALAbstract: Rapid globalization increases the growing demand of energy in building sector all over the world. Building inner environment is highly influenced by the outer weather conditions and directly affects the cooling or heating demand of buildings. Many studies report relationship between outdoor weather conditions and occupants thermal comfort behavior and it is very important to provide comfort inside the building as people spend most of their time indoors. The present study have examined the significance of outdoor weather parameters (ambient temperature, humidity, global radiation, wind speed and wind direction) with respect to the outer wall temperature of all the four walls and roof of the building situated in composite climate near Delhi. Statistical analysis was conducted using SPSS to quantify the effect of these attributes on the inside temperature. A high value of coefficient of determination (R²) achieved during the study (between 0.7-0.86 for various walls) indicate that the variable selected in the study are able to explain 70-80% variability in the inside wall temperature. Outside physical parameters plays a vital role in improving the indoor comfort of the occupants. The model clearly indicates the prime factor which influence the inside temperature or thermal comfort of the building situated in composite climate and also it helps the engineers and architects to modify the building design as per the most affected parameter for the particular climate.
Index Terms: Thermal behavior, Regression analysis, Linear and Poisson model, weather parameters, predictive modeling
—————————— ——————————
1
INTRODUCTION
Building enterprise is one of the greatest buyers of energy and consequently has a high feasibility of saving as well. Presently, the residential and industrial sectors account for 30% (22% residential and 8% commercial) of the total electrical energy use and utilization in these sectors is rising at the rate of 8% yearly [1]. India is emerging as one of the fastest developing nations to targeting $5 trillion economy by 2024. According to Niti Aayog, the electricity consumption by the building sector in India will approximately increase by 86 percent (from 238 TWh/year to 2,287 TWh/year) by the year 2047 [2]. According to EIA‘s International Energy Outlook 2017 (IEO2017) tasks that amongst the entire regions of the world, the greatest boom in constructions power consumption via 2040 will show up in India with a rate of 2.7% per year between 2015- 2040 [3]. Climate is changing globally due to adverse environment impact and this will prevail in decades until any concrete steps are taken by world community. This change in weather conditions directly affects the thermal behavior of buildings and conversely, its indoor surroundings. Extensive studies have been done to establish relation between indoor thermal comfort and discomfort. Thermal comfort in a building can be achieved by designing the building according to local condition. Therefore the buildings were designed according to the climatic requirement of that particular region [4]. Buildings protect the people from outside environment and acts as a thermal receptors or cold receptors.
The wall and roof are the significant element of the building which receive direct effect of weather parameters and also respond to outside thermal variation in the form of providing thermal comfort to the occupants. The energy transfer through the building takes place in the form of conduction, convection and radiation. The thermal performance of a building depends upon the climatic condition of that particular region. So, the building should be a good thermal performer but due to lack of consciousness about the energy efficiency in buildings. The energy consumption of a building depends on various factors like climatic condition, occupancy pattern, daylight hours, building design; inherent efficiency of tools used etc. Researchers have examined the relationship between the indoor conditions of building in respect to outdoor ambient condition by using different regressions or models to investigate the impact of various parameters on energy consumption in the buildings [5]. The aim of the study is to find out the significance of environment factors on the thermal pattern of the wall of a building which directly affect the thermal comfort behavior of the occupants [6]. This study focused on five weather parameters – ambient temperature, relative humidity, global radiation, wind speed and wind direction. Statistical analysis was performed to analyze: (1) the significance of the independent variables on different façade and roof of the building (2) Most significant variable/ variables for a particular wall. Different regressions or models have been carried out to study the impact of climate changes on energy consumption but no work on energy regression analysis has been done so for by taking these five parameters in composite climate. Also, this is the only study which shows the influence of these parameters with respect to the façade of the building. The study helps the engineers and architects to modify their design as per the findings of the study and can provide insulation or other energy efficient features to the particular façade as per their requirements.
2
THERMAL
BEHAVIOR
OF
THE
BUILDING
Thermal behavior of the wall of a building have the ability to
————————————————
• Manisha Yadav, PhD Research Scholar, Center of Excellence in Energy and Environmental Studies, DCR University of Science & Technology, Murthal, Sonipat, Haryana, India, Mob-9466676569. E-mail: [email protected]
2517
preserve comfortable interior living condition or thermal comfort, though weather parameters (temperature, humidity and air velocity) varies from season to season. The heat flow between the outer and inner surface of the wall relies upon the thermal conductance of the layers and materials of the wall, roof, window and door [6]. The process of heat flow from outside to inside of the building occurs by means of conduction, convection and radiation through the walls and roof material and rate of flow through the façade dependent on the material of the façade as well as weather parameters. Outside weather conditions are responsible for raising the temperature of the outer surface of walls and roof of the building. The thermal retention through the walls and roof leads to the radiation heat transfer into the indoor of the building at sharp warm sunny days. There starts off evolved to raise a temperature difference between the outer and inner wall surfaces [5] The thermal behaviour of the roof of the buildings is undoubtedly one of the most important research fields for reduction in annual energy demand for the building sector [7]. The heat transfer and air infiltration through doors and windows affects the indoor hygrothermal conditions of the building and adversely affects energy consumption through HVAC systems to achieve and maintain the comfort levels as per physiological condition of occupants [8,9]. The thermo physical properties of a building envelope are important due to its direct effect on energy consumption and indoor comfort behavior [10]. According to Hensen, thermal comfort is defined as a state where no driving impulses exist so as to modify the environment by the behavior [11]. The ASHRAE define thermal comfort as the mind condition in which satisfaction with the thermal environment is expressed [12]. There are six factors as defined by Macpherson, (1962) which influence thermal feeling including four climate variables (such as air temperature, relative humidity, air velocity and mean radiant temperature), along with individual variables (like clothing insulation and activity level, that is metabolic rate) [13]. Outside air temperature influence the energy consumption patterns of the building to establish the fact statistical [14]. Models were developed by researchers to analyze the effect of increasing ambient temperatures on energy consumption [15,16,17,18,19]. Peak energy demand increases from 0.45 and 4.60% per degree of increase in the outer ambient temperature, based upon the geographical region [16]. Various environment variables were defined like average indoor temperature, apparent temperature, relative humidity (RH), and absolute humidity (AH) and analyze through regression model to relationship between indoor and outdoor temperatures. (20) Effects of outside temperature and humidity on building energy consumption was also mentioned by a researcher which also being influenced by wind speed and external environment. [17] Temperature is not the only climate variable that affects energy consumption, relative and total humidity have a significant impact on energy consumption because energy is needed to extract moisture from the air [18]. Impact of average ambient temperature and rainfall also be analyzed over electricity consumption and found that an increase in 1°C of the temperature will result in an increase of 6.79 % electricity consumption [21]. Linear regression analysis is a great tool used to develop the relationship among the climate variables. A study in Thailand also used multiple linear regression models to study the impact of climate changes (temperature, humidity, and wind speed) on electricity demand [22]. Regression analysis also done by considering variables
such as window to wall ratio (WWR), SHGC, solar protection angles, building volume indicators and the roof U value to evaluate the envelope efficiency level [23]. The potential impact of ambient temperature rose due to urbanization or global warming as for 1°C rise in ambient temperature the electricity consumption increase by 9.2%, 3.0%, and 2.4% in domestic, commercial, and industrial sectors, respectively [24]. Statistical Package for the Social Science (SPSS) software is used to understand the influence between air temperature and electricity consumption of high-performance buildings [25]. IBM SPSS Statistics is software for predictive analysis of data which incorporates many statistical tools including regression analysis. The physical factors of environment around a building affect its thermal behavior or comfort, chiefly by influencing its space cooling requirement. So, a model needs to be developed to find out the significant effect of the variables on the thermal behavior of façade and roof of the building. For the study, data of five physical factors, namely ambient temperature, humidity, global radiation, wind speed and wind direction was collected monthly from Jan 2018 to Dec 2018 and effect of these variables on wall and roof temperature was analyzed using IBM SPSS Software version 23. Two different models i.e. linear and Poisson model were developed using generalized linear model specifications and their results were compared to find out best model.
2.1. Characteristics of models
Various regression models have been compared in different studies to find out the best fit graph between the variables [26]. Two models i.e. Linear and Poisson model is compared to find out the best possible model for regression analysis for the present study [27,28]
2.1.1 Multiple Linear Regression models
A number of studies used multiple linear regression technique to correlate wall temperature with explanatory variables [29]. Multiple linear regression approach assumes that the wall temperature is a normally distributed continuous variable and linearly related to the explanatory variables. The model form of this approach is defined as:
a
a
i i
Y where
Y is wall temperature,
i
is the affecting factor,
a
,a
i are
the model coefficients and
is the random error term assumed to be normally distributed with mean zero and variance
2. Although model development and interpretation is very simple in case of multiple linear regression models, this method suffers serious drawbacks. Firstly, some of the variables affecting temperature may not be continuous; as a result the assumption of normal distribution of error term is not true and may lead to erroneous conclusions.2.1.2 Poisson model
! y i e y Y P Y i (2.1)
Where μi is the Poisson parameter for wall temperature unit i, which is equal to the expected mean of y and estimated by using functional forms: i
e
ii
where i arecoefficients andi are factors affecting wall temperature.
3.
RESEARCH
METHODOLOGY
3.1 Dataset
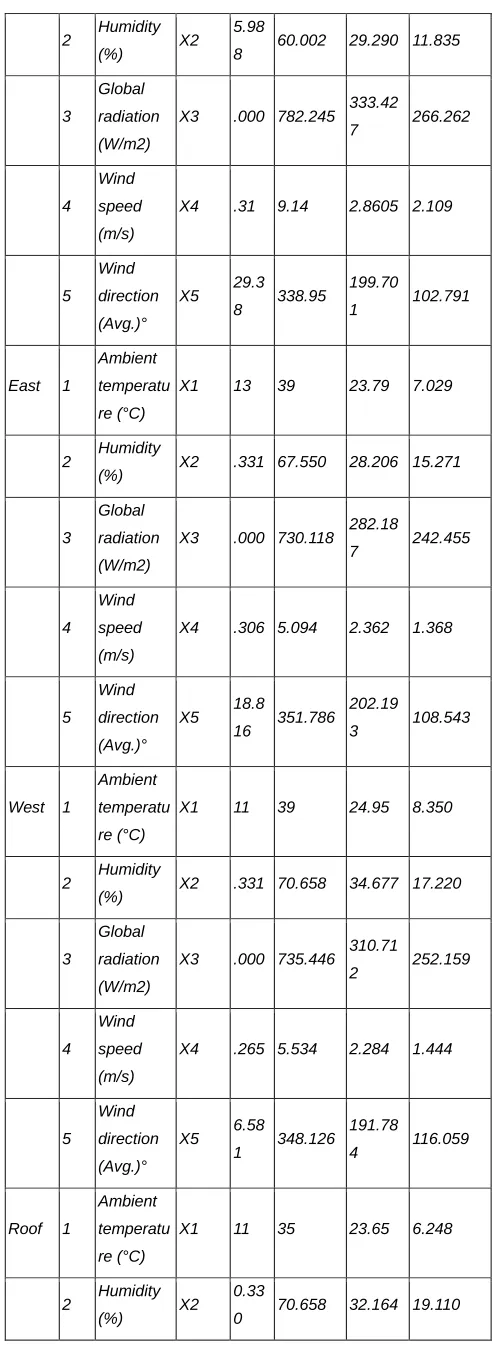
The study was conducted on an institutional building in composite climate (MV block, DCRUST, Murthal, Haryana) under the influences of five weather and climate related variables for which data was collected every month consistently throughout the year beginning from Jan 2018 till Dec 2018 from 8 a.m to 6 p.m. The data was collected during the sun shine hours with clear sky within 1st week of every month to maintain the effectiveness of survey. The data of variables are collected through data loggers installed in building and the outside wall and roof temperature was measured using fluke thermometer. This resulted in a data set comprising 133 samples respectively from each façade i.e. North, South, East, West and Roof. The summary statistics for all 5 variables collected from sensors are described below in Table 1
Table 1 : Description of Model Variables for wall temperature prediction.
Wall Sr. No. Variable with measure ment units Desig nation
in the
model
Min. Max. Mean Std.
Deviation
North 1
Ambient
temperatu
re (°C)
X1 14 36 24.58 6.345
2 Humidity
(%) X2
5.98
8 65.740 33.106 13.662
3
Global
radiation
(W/m2)
X3 .000 903.091 312.60
1 308.095
4 Wind
speed
(m/s)
X4 .301 9.139 2.725 1.982
5 Wind
direction
(Avg.)°
X5 6.58
1 320.762
160.55
7 105.421
South 1
Ambient
temperatu
re (°C)
X1 14 34 22.95 5.749
2 Humidity
(%) X2
5.98
8 60.002 29.290 11.835
3
Global
radiation
(W/m2)
X3 .000 782.245 333.42
7 266.262
4 Wind
speed
(m/s)
X4 .31 9.14 2.8605 2.109
5 Wind
direction
(Avg.)°
X5 29.3
8 338.95
199.70
1 102.791
East 1
Ambient
temperatu
re (°C)
X1 13 39 23.79 7.029
2 Humidity
(%) X2 .331 67.550 28.206 15.271
3
Global
radiation
(W/m2)
X3 .000 730.118 282.18
7 242.455
4 Wind
speed
(m/s)
X4 .306 5.094 2.362 1.368
5 Wind
direction
(Avg.)°
X5 18.8
16 351.786
202.19
3 108.543
West 1
Ambient
temperatu
re (°C)
X1 11 39 24.95 8.350
2 Humidity
(%) X2 .331 70.658 34.677 17.220
3
Global
radiation
(W/m2)
X3 .000 735.446 310.71
2 252.159
4 Wind
speed
(m/s)
X4 .265 5.534 2.284 1.444
5 Wind
direction
(Avg.)°
X5 6.58
1 348.126
191.78
4 116.059
Roof 1
Ambient
temperatu
re (°C)
X1 11 35 23.65 6.248
2 Humidity
(%) X2
0.33
2519 3
Global
radiation
(W/m2)
X3 0.82
0 938.979
330.09
2 244.833
4 Wind
speed
(m/s)
X4 0.30 5.93 2.452 1.633
5 Wind
direction
(Avg.)°
X5 6.58 331.71 208.44
8 109.855
3.2. Methodology
To develop predictive models for inside wall temperature, the dataset described above was divided into train and test data sets. Out of total 133 data points 100 were used for training of models and rest 33 were used for testing and validation of models. Two different models namely linear and Poisson model were developed using SPSS (IBM, 2013) software. Initially all five independent variables were selected into the model and their significance at 95% confidence interval was examined. Those having significance value less than 0.05 were retained and remaining variables were dropped one by one till significance drop was observed in the statistical measures Akaike Information Criterion-finite sample Corrected (AICC) and Bayesian Information Criterion (BIS) [32, 33]. The comparative statistics achieved in final models are provided in table 2.
Table 2: Comparative statics of models
Comparat
ive statistics
of Models
Bayesia
n
Information
Criterion
(BIC)
Akaike
Information
Criterion –
Finite
Sample
Corrected
(AICC)
2 Log
pseudo
likely-hood
North Linear 609.150 598.893
-295.446
Poission 144.577 141.043 -67.521
South Linear 548.132 538.457
-265.228
Poission 112.652 109.819 -51.909
East Linear 641.178 630.757 -311.379
Poission 182.025 177.923 -85.962
West Linear 638.048 625.174
-307.587
Poission 157.173 152.461 -72.230
Roof Linear 504.344 494.866
-243.433
Poission 164.619 160.623 -77.311
4.
RESULTS
AND
DISCUSSION
Table 3 provides the correlation coefficient (CC), Root Mean Square Error (RMSE) and Mean Absolute Error (MAE) values
using linear and Poisson model developed in the study.
Table 3 – Performance indicator of various models
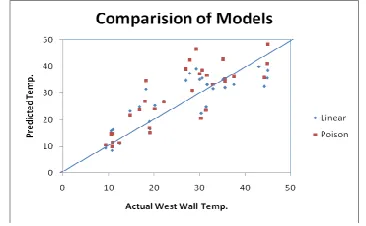
The results clearly indicates an improved performance by Poisson model for all the four walls (North, South, East, West) and roof for the used dataset in terms of all indicators. The scatter plots comparing the results of linear and Poisson model for different walls are provided in fig 1to 5. These plots also indicate that a better fit was achieved using Poisson model for all wall and roof.
Fig. 1 Actual vs predicted south wall temperature
Fig. 2 Actual vs predicted North wall temperature
Fig. 3 Actual vs predicted west wall temperature
Fig. 5 Actual vs predicted roof temperature
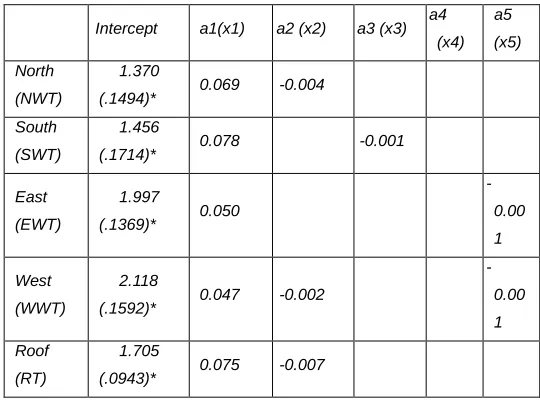
The plots in the above figure indicates better fit achieved using Poisson model as it clearly shows small deviation by predicted values with respect to actual values. Parameter estimates of Poisson models develop for various wall and roof are provide in Table 4.
Table 4 Parameter estimates of models
Intercept a1(x1) a2 (x2) a3 (x3) a4
(x4) a5
(x5)
North
(NWT)
1.370
(.1494)* 0.069 -0.004
South
(SWT)
1.456
(.1714)* 0.078 -0.001
East
(EWT)
1.997
(.1369)* 0.050
-0.00
1
West
(WWT)
2.118
(.1592)* 0.047 -0.002
-0.00
1
Roof
(RT)
1.705
(.0943)* 0.075 -0.007
* the value in the parenthesis are standard errors in estimates
The results given in table 4 clearly show that at least one climate variable had a significant impact on the temperature of each wall (34). Hence, it was reasonable to assume that the regression equation was useful in describing the wall temperature as a function of these climate variables. The model equation for various wall and roof inside temperature are provided in equation 1 to 5
Model equation of SWT (south wall temp.) as per model is
InSWT 3.0660.0781 0.0013 ……1
From the model equation (1) which qualifies the effect of various variables on south wall inside temperature it can be seen that increase of 1°C in X1 (ambient temperature) results an increase of around 8% inside temperature and 1° change in wind direction results in a decrease of only 0.1% in wall temperature.
Model equation of NWT (North wall temp.) as per model is
InNWT 3.9360.06910.0042 ...2 The equation (2) for north wall inside temperature clearly indicates that increase of 1°C in ambient temperature results approx. 7 % increase in wall temperature. On the other hand 1° in wind direction results in a decrease of 0.4% in wall temperature.
Model equation of WWT (west wall temp.) as per model is
5 2
1 0.002 0.001
047 . 0 312 .
8
InWWT …3
As per the equation for west wall increase of 1°C in ambient temperature results a 4.8 % increase in wall temperature and 1° increase in humidity results in 0.2% decrease in west wall temperature. On the other side change of 1° wind direction results in a decrease of 0.1% in wall temperature.
Model equation of EWT (East wall temperature) as per model is
5
1 0.001
051 . 0 306 .
7
InEWT ………4
The equation (4) shows that 1°C increase in ambient temperature results a 5.2% increase in wall temperature and 1° unit increase in wind direction results in a decrease of only 0.1% in wall temperature.
Model equation of RT (Roof temp.) as per model is
2 1 0.007
075 . 0 499 .
5
InRT ……….5
For roof increase of 1°C in ambient temperature results 7.7 % increase in wall temperature and 1° unit rise in wind direction
2521
5.
CONCLUSION
The present study was conducted in Murthal, the state of Haryana, India to understand the effect of weather and climate factors on the inside temperature of walls and roof of a buildings so as to understand how these factors affects the thermal behavior of the building. Statistical analysis was conducted to quantify the effect of these attributes on the inside temperature. Two set of models were developed and their results were compared. The performance of Poisson model was found better than linear model on all performance indicators (Table 4). The results shows that the inside wall temperature are strongly correlated with outside weather and climate factors studied during the study. A high value of coefficient of determination (R²) achieved during the study (between 0.7-0.86 for various walls) indicate that the variable selected in the study are able to explain 70-80% variability in the inside wall temperature. Temperature of north wall is mainly influenced by ambient temperature and humidity. Similarly, South wall temperature is influenced by ambient temperature and global radiation. As south wall receive direct solar radiation on its surface on most of the hour so it is also affected by global radiation. Ambient temperature and wind direction shows their significance on east wall. The west wall is affected by ambient temperature, humidity and wind direction. Roof of the building is influenced by ambient temperature and humidity. Overall, it is found that ambient temperature has a great significance on every wall and roof of the building. Regression analysis indicated that the wind speed had no correlation with wall temperature. The results show the thermal behavior of the façade has strong influence on thermal comfort of the occupants and indoor environment of the building. As, the result shows that ambient temperature largely affect the building thermal performance so there is a need to provide insulation on the wall as well as roof to minimize the effect of temperature in composite climate. So, the building demands substantial levels of insulation and energy efficiency measures to achieve thermal comfort inside the building.
6
REFERENCES
[1] Kumar, D. S. USAID ECO-III Project.(2011). Energy Use in commercial buildings-Key findings from the national benchmarking study. USAID-INDIA.
[2] Pimpalkhare, A.(2018). ‗Building‘ an energy efficient India. https://www.orfonline.org/expert-speak/42744building-an-energy-efficient-india/
[3] US EIA (2017). Buildings energy consumption in India is expected to increase faster than in other regions. https://www.eia.gov/todayinenergy/detail.php?id=33252 [4] Samuel, D. L., Dharmasastha, K., Nagendra, S. S., &
Maiya, M. P. (2017). Thermal comfort in traditional buildings composed of local and modern construction materials. International Journal of Sustainable Built Environment, 6(4), 463-475.
[5] Ponni, M., Baskar, R. (2014) Evaluation of Indoor Temperature through Roof and Wall Temperatures - An Experimental Study in Hot and Humid Climate. International Journal of Engineering and Innovative Technology, 6(4), 205-211.
[6] Yang, Climatic analysis and architectural design strategies for bio-climatic design [Ph.D. thesis], Xi‘an University of Architecture and Technology, 2003.
[7] Echarri Iribarren V, Espinosa Fernández A, Galiano Garrigós A. Energy efficiency of flooded roofs: the University of Alicante Museum. Ashurst, United Kingdom: WIT Transactions on Engineering Sciences; 2016. p. 163– 175. Available from: http://library.witpress.com/viewpaper.asp?pcode=HT16-016-1
[8] Halawa E, van Hoof J. The adaptive approach to thermal comfort: A critical overview. Energy and Buildings. 2012;51. http://dx.doi.org/10.1016/j.enbuild.2012.04.011.
[9] de Dear RJ, Akimoto T, Arens EA, Brager G, Candido C, Cheong KWD, et al. Progress in thermal comfort research over the last twenty years. Indoor Air. 2013;23(6):442–461. pmid:23590514
[10]Manioğlu G, Yılmaz Z. Energy efficient design strategies in the hot dry area of Turkey. Build Environ 2008;43(7):1301– 9.
[11]Hensen JLM. On the thermal interaction of building structure and heating and ventilating system. Technische Universiteitt Eindhoven; 1991.
[12]Standard, A. S. H. R. A. E. (2004). Thermal environmental conditions for human occupancy. American Society of Heating, Refrigerating and Air conditioning Engineers, Vol 55.
[13]Lin Z, Deng S. A study on the thermal comfort in sleeping environments in the subtropics—developing a thermal comfort model for sleeping environments. Build Environ 2008;43(1):70–81.
[14]Sailor, D. J. (2001). ―Relating residential and commercial sector electricity loads to climate–evaluating state level sensitivities and vulnerabilities.‖ Energy, 26(7), 645–657. [15]Coskun, C., Ertük, M., Oktay, Z., and Hepbasli, A. (2014). ―A
new approach to determine the outdoor temperature distributions for building energy calculations.‖ Energy Convers.Manage., 78, 165–172.
[16]Santamouris, M., Cartalis, C., Synnefa, A., and Kolokotsa, D. (2014). ―On the impact of urban heat island and global warming on the power demand and electricity consumption of buildings–A review.‖ Energy Build., 98, 119–124.
[17]Kalvelage, K., Passe, U., Rabideau, S., and Takle, E. S. (2014). ―Changing climate: The effects on energy demand and human comfort.‖ Energy Build., 76, 373–380.
[18]Wang, H., and Chen, Q. (2014). ―Impact of climate change heating and cooling energy use in buildings in the United States.‖ Energy Build., 82, 428–436.
[19]Bessec, M., and Fouquau, J. (2008). ―The non-linear link between electricity consumption and temperature in Europe: A threshold panel approach.‖ Energy Econ., 30(5), 2705–2721.
[20]J. L. Nguyen, J. Schwartz, D. W. Dockery Indoor Air (2014), ―The relationship between indoor and outdoor temperature, apparent temperature, relative humidity, and absolute humidity‖ 24: 103–112 © 2013 John Wiley & Sons A/S. Published by John Wiley & Sons Ltd
[21]Joyce Carlo, Roberto Lamberts (2008), ―Development of envelope efficiency labels for commercial buildings: Effect of different variables on electricity consumption‖, Energy and Buildings 40 (2008) 2002–2008
[23]S. Parkpoom, G.P. Harrison, J.W. Bialek, Climate change impacts on electricity demand, in: Universities Power Engineering Conference 2004. 39th International, vol. 3, 2004, 1342–1346.
[24]W.Y. Fung, K.S. Lama, W.T. Hung, S.W. Pang, Y.L. Lee, Impact of urban temperature on energy consumption of Hong Kong, Energy 31 (14) (2006) 2623–2637.
[25]Fernanda Cruz Rios; Hariharan Naganathan; Wai K. Chong, M.ASCE; Seungtaek Lee; and Anderson Alves. Analyzing the Impact of Outside Temperature on Energy Consumption and Production Patterns in High-Performance Research Buildings in Arizona
[26]Sonderegger, D., Wang, H., Clements, W. and Noon, B. (2009) Using SiZer to detect thresholds in ecological data, Front. Ecol. Environ., 7, 190–195.
[27]Srinivas, C., Dinu, R.R., Veeraragavan, A., (2007). Application of poisson and negative binomial regression for modeling road accidents under mixed traffic conditions. Transportation Research Board 86th Annual Meeting No. 07-1617.
[28]Gyanendra Singh, S.N. Sachdeva, Mahesh Pal (2016) ―M5 model tree based predictive modeling of road accidents on non-urban sections of highways in India‖, accident Analysis and Prevention 96 108–117
[29]Keele, L. (2008) Semiparametric Regression For the Social Sciences, West Sussex, England, John Wiley & Sons, Ltd. [30]Maher, M., Mountain, L., 2009. The sensitivity of estimates
of regression to them ean. Accid. Anal. Prev. 41 (4), 861– 868.
[31]Li, X., Lord, D., Zhang, Y., Xie, Y., (2008). Predicting motor vehicle crashes using Support Vector Machine models. Accid. Anal. Prev. 40, 1611–1618.
[32]Sawaldha, Z., Sayed, T., (2003). Statistical issues in traffic accident modeling. In:82nd Annual Meeting of the Transportation Research Board, TRB.
[33]Vogt, A., Bared, J.G., (1998). Accident Models for Two-lane Rural Roads: Segments and Intersections. Publication No. FHWA-RD-98-133.
[34]Mohareb, E. A., Kennedy, C. A., Danny Harvey, L. D., and Pressnail, K. D. (2011). ―Decoupling of building energy use and climate.‖ Energy Build., 43(10), 2961–2963.