2045
Volume LXI 225 Number 7, 2013
http://dx.doi.org/10.11118/actaun201361072045
STUDY MAPS AS A TOOL FOR THE
ADAPTIVE TESTS CONSTRUCTION
Dita Dlabolová, Jiří Rybička
Received: August 23, 2013
Abstract
DLABOLOVÁ DITA, RYBIČKA JIŘÍ: Study maps as a tool for the adaptive tests construction. Acta Universitatis Agriculturae et Silviculturae Mendelianae Brunensis, 2013, LXI, No. 7, pp. 2045–2054
Measurement of students’ knowledge is an essential part of the educational process. Teachers on universities o en use computer-based tests to testing a large number of students in a short time. The question is, what kind of information these tests provide, and if it is possible to classify students on this basis. Praxis shows that the scalar test results in the form of simple numbers cannot be plainly interpreted as the level of knowledge; moreover it is not easy to build such tests, which detect the necessary information. In the fi rst part of the article we present the results of pedagogical experiment focused on the diff erence between information obtained through the computer-based test and a teacher’s interview with the same students. Possible starting point to improve information from computer-based tests in non-scalar form is a construction of an adaptive test, adapting test items to identify knowledge similar to a conversation with a teacher. As a tool for the design of the adaptive tests we use so called study maps, which are described in the second part of the article.
adaptive testing, computer assisted testing, mind map, concept map, knowledge, study map, tests in higher education
Number of university students is very high in some courses. Verifi cation of their knowledge cannot be made by an oral examination and similar time-consumption methods, hencecomputer-aided testing is used very o en. Questions that can be processed by the computer itself are used in the computer tests, these questions are composed from the taught curriculum selection by qualifi ed teachers. But this composing process has not a systematic support and an appropriate balancing of the share of parts and diffi culty. Thus, results obtained from these tests usually does not represent required explanatory power. The test result is o en depicted as an amount of points and student obtains appropriate mark on this point basis. We detect some principal questions in this context: What knowledge, however, such a mark match? Have two students with the same score the same knowledge? Is it possible to get passed mark, even if a student’s
knowledge is insuffi cient? These problems were discussed in many articles with many points of view. For example prof. Vaníček (1999) says: …numbers (marks) do not refl ect any operation of composition in the real world. There even is not any empirical justifi cation between particular grades. The diff erence between 3 and 4 is a diff erence between success and fail, the diff erence between 1 and 2 is a diff erent intensity of a complementary praise to the success in passing the exam. If we calculate an arithmetic mean from the grades, we gain a number that has no meaning in an empirical world.1 This cite from a year 1999 sums up one of topics of our research and this paper – the topic is fi nding an answer and a possible solution on a question – is one number (grade) able to describe student’s knowledge? Especially when the number was obtained from a computer assisted test with closed questions?
In 2012 a preliminary pedagogical experiment of comparing a computer assisted test (with closed
questions) with an oral exam was performed. The goal was to get an objective prove that the results of this kind of test doesn’t provide an appropriate information about student’s knowledge. Simultaneously we wanted to gain a proper foundation for a design of a computer assisted adaptive test competing with the drawbacks of currently used regular computer assisted tests. Hand in hand with this goal goes another need – a design of a representation of the results of the test depicting structure of student’s knowledge verifi ed by the test. Objective of this paper is to describe results of this pedagogical experiment and to introduce a proposal of a method for computer adaptive testing with a focus on knowledge of context.
MATERIALS AND METHODS
The experiment was performed within a university course Informatics for Economists II (Informatika pro ekonomy II, an abbreviation IPE2 is used in following text) taught at Faculty of Business and Economics (FBE) and within a course Informatics in Agribusiness (Informatika v agrobyznysu, INAGB) taught at Faculty of Agriculture (AF), both at Mendel University in Brno (MENDELU) during the summer semester 2011/2012. Goal of the experiment was to intercept the diff erence between “classic” computer based test (computer assisted test with closed questions) and an oral exam. The experiment was performed on 90 tests and it consisted of a written computer test and of a following oral exam.
Written computer assisted test was performed via an e-learning application in a University Information System of Mendel University (UIS). The test from the course IPE2 is a test with 25 closed questions of diff erent types: dichotomous questions, ordering questions, multiple choice questions with one or with more correct answers. Main condition of this test construction was computer evaluation without an intervention of teachers, because these courses are studied by very large number of students. This condition excludes the use of more complex or open questions. The whole test is divided into fi ve thematic modules; at least 50% from each module is necessary to pass the test (the reason for their implementation is described in details in Haluza, Talandová, 2009). Guessing correction is implemented in the test, i.e. wrong answers are penalized with negative amount of points. This amount is proportional to the probability of guessing the correct answer. Test from the course INAGB is a test with 17 closed questions of diff erent types, no division into modules is implemented here, guessing correction is used, the minimum to pass the test is 50% (a er recalculation due to the guessing correction).
The form of the oral exam was following: an open discussion with a student – few questions were chosen from the test and then complementary questions were asked. From each module usually one question was chosen – with emphasize to wrong-answered in previous test, but randomly were used right-answered or skipped questions. Complementary questions on related terms were asked in dependency on student’s answer with emphasize on a wider context and relations between terms. All questions and answers were put down by a record-keeper together with a subjective evaluation of student knowledge.
A er the experiment was over, all the data from the computer test was uploaded to a database created for this purpose and also the notes from the oral examining were rewritten into this database. Detailed description of the course of the experiment, manner of posing the questions and the structure of the database is in a paper from conference PefNet 2012 (Dlabolová, 2012).
The main method used to examine the results of the experiment was casuistry – particular tests and following complementary questions were chosen as representatives of common cases or observations during the experiment and described in details to depict the results.
RESULTS
To illustrate the diff erence between a computer test and an oral exam, particular tests were chosen. Three basic kinds of situations were observed: • The test result is akin to the oral exam results. • Deep ignorance of the topic – wrong answer
doesn’t mean only a mistake in the particular question, but behind the wrong answer there is an absence of knowledge of basic terms.
• The result of the written test doesn’t correspond to the result of the oral exam – in both ways.
The detail description of particular chosen examples follows.
The fi rst case is a desirable state showing only an acceptable diff erence in the results of both tests. In the tests from this category, students usually don’t know incorrectly answered questions and knows correctly answered ones. Sometimes there are some small mistakes caused by wrong interpretation of the question or similar reasons. There can be also found some amount of questions that were just guessed or learned by heart from the study materials. In this category there is in some cases a basic background knowledge behind incorrectly answered or skipped questions.
Following two tests are examples of deep ignorance of the topic, one item was chosen to illustrate the problem from both tests. First example is from a test named A12, which is from a course
INAGB, the result of the test was 56.02%. One of the items discussed during the oral exam was The term relation in a relation database system means:3 with a wrong answer: a relationship between diff erent entities from diff erent sets, the correct answer for this item was: chosen elements originated from a Cartesian product of sets, which represent data types. Student was asked to describe diff erent kinds of database systems – hierarchical, network and relational. He gave basic characteristics, which were exactly citing features of the database systems as they were stated in the study material, hence the terms from the question were determined one by one in following dialog:
Q: The relationships in the database system, between what actually they are? A: between computers and computer systems.
Q: What is an entity? A: Services.
Q: What is a database system? A: It gathers and provides information.
Q: What are the components of a database system? A: Information.
Q: What is a database management system? A: Data are managed there.
This dialog can be seen as a proof that the student’s knowledge about the database topic was zero.
The second example is from a test A2, again a course INAGB. Result was 51.77%, one of the examined questions was Compression is: it was correctly answered (process of redundancy decreasing in data). Following complementary questions were posed with no or wrong (very vague) answer. Between the questions, a short explanation of a term from the previous question was given to the student:
What is the basic principle of compression? What is the purpose of using compression? Have you ever used compression in practice? Compression rate, on what does it depend?
What is the diff erence between BMP and JPG format? Which fi le format is very close to an image with no compression? A: GIF.
Again, the absence of the knowledge, now behind a correctly answered item, is obvious.
Three examples from the third category – deep diff erence between the written test result and the result of the oral exam, follows. First of them is named E1, course IPE2, result was 86.98%, which was the best result for IPE2. Out of 25 questions, three were answered incorrectly, one was skipped and one was partially correct. First examined question was: Which mathematical function is able to transform a number of diff erent realizations of a phenomenon on the quantity corresponding to the amount of information? it was correctly answered (logarithm of any base). During the subsequent dialog, actual very poor student’s knowledge about the information theory and about logarithm function showed up. Next examined item was about recognizing of a content of a fi le in a CSV format. The student knew the “textbook defi nition”
what CSV format is, but had no idea about its use. Than questions to a database module were asked (all the fi ve items in the database module were quite similar, so no particular one was chosen, the result of the module was 65%). Further questions showed up that the student even does not have an idea of what actually a database is – e.g. he does not know who or what poses the queries for a database.
Next example named E2, again the course IPE2. Its result is 54 points and 66.75%, only one module was missing with result 40%. The student wasn’t able to answer any of complementary questions, even about the items that were correctly answered. The last example for this cathegory is named E3, course IPE2, it was a re-sit, the previous result was 56% (during the fi rst term the result of the oral exam was similar to the result of the written test, but in few cases, student didn’t know correctly answered question). The result of E3 was 77.33 points, 83.33%, all modules were fulfi lled, the result was the second best for IPE2. The student mostly did not answer any question, very few answers that he gave were absolutely wrong. Anyway, the student claimed that the previous oral exam helped him in better understanding of the subject of the course.
Opposite example of a diff erence between the test result and the oral exam is named E4, course IPE2, 47 points, 61.78%, one module was missing (databases). The oral exam started with the database module, which was missing. First examined item was: Choice of all attributes in a listing of elements in a relation at command SELECT is: where the answer wasn’t correct (in the chosen answer was that a formula ALL should be used, instead of correct answer – using a character “*”). Complementary questions were: Explain what is a relational DB system., Explain what is a relation?, What is an entity? All of them were answered correctly. Next examined question was Projection operation in a relational database system is: no answer was chosen. The complementary questions were about diff erent operations over databases, the questions went quite deep in the topic and they were all answered correctly. Same result was for the last examined item How do we call a part of an information system intended for a tactical management? which was answered incorrectly, again the complementary questions went deep into the topic. A er this examining of the database module giving correct answers, the examination was fi nished.
In total 113 diff erent complementary questions were used during the oral exams, 68 of them were used only once, 6 uses were the maximum. For the complementary questions that were posed at least four times, particular test items were assigned. Since sometimes asking the complementary questions was a long process, in those assigns also not actually obvious connections can be seen. As an example,
a complementary question: What is a client? was asked at following test items:
JavaScript language can be used for creation of dynamic documents.
Choose a correct statement for the code bellow:… (followed by a piece of HTML code with JavaScript)
Internet service WWW works on a client-server principle. The term ‘protocol’ in this meaning means:
Choose a correct statement about dynamic documents. Since with many test items, more complementary questions were used, when those selected complementary questions and test items were placed into a structure similar to concept map, a network depiction of common examined topics in examined courses was obtained.
Subjective impression of the tests was that the tests in most cases don’t correspond to the real student’s knowledge. Mostly the background knowledge and interconnections between diff erent facts or statements was missing. It is impossible to formalize the subjective observations, but the previous casuistry should serve for the illustration. The casuistry is supported by two bar charts. All results were divided in four categories: less than 50%, 50–60%, 61–70% and more than 70%. For better understanding of the bar charts, two pie charts are added – pie charts showing results (in percentage) of the written tests for both courses. Fig. 1 depicts the pie chart for the course IPE2 on the le side, the course INAGB on the right side.
1: Division of the test results in the course IPE2 on the left side, the course INAGB on the right side
2: Comparison of the oral exam result with the test result, divided according from the written test result – the course IPE2
Then, all results of the oral examination were divided into three categories: “worse than written test”, “similar result to the written test” and “better than the written test”. This result is depicted in a bar chart. There was a principal diff erence between those numbers for the tests from both courses, so a separate graph for each of them was created. Unfortunately this made the sparse data even sparser, so those graph can’t be seen as a formal result of the experiment. Another problem of the graphs is subjectivity in the division in the three categories. Hence the purpose of the graph is an illustration of a subjective observation. Fig. 2 shows the graph for the course Informatics for Economists II.
Fig. 3 shows the graph for the course Informatics in Agribusiness.
The bar chart for the course INAGB shows that for all results of the test, in one third of the cases, the result was the same, for one third better and for one third worse. In the course IPE2 the situation is diff erent, for the test over 60%, there was inconsiderable amount of better results during the oral exam than during the test. It has to be sad, that the worse results in those two categories were actually much worse (as was e. g. the above mentioned tests E1 and E3, which were the best results of the written test, but during the oral exam, the students didn’t know anything). In the category under 50%, the most numerous group were tests with the oral exam even worse than the test. In the middle category, the most numerous group is the same result for both kinds of testing, it has to be sad that the main reason is that those tests can be non-formally described as “student knows something and something not”, which was usually the result of the oral exam as well, but the fact is that in many cases there was a diff erence in what student knows/ doesn’t know according to the test and according to the oral exam.
For complex investigation, a test named E5 was chosen. It was chosen as an example of both previously described problems – deep ignorance of basic knowledge and the result of the written test does not correspond to the oral exam. Student didn’t pass the exam, because he didn’t fulfi ll three modules (of fi ve), the overall result was 57%. The overall scalar result of the test “is not bad”, but during the oral exam it showed up, that student didn’t know the basic terms, he didn’t understand the matter and he didn’t know any relations between the topics. Final result of the student was F. Only three modules out of fi ve were discussed during the oral exam due to large time demands. Three questions from the oral exam were chosen as a sample. From the module “dynamic web documents” a question with a right answer was chosen. The question was: What kind of documents is created in JavaScript language? Some of very tightly related terms were known to
the student – HTML language, division on static and dynamic documents and their relations. Anyway, he didn’t know other basic terms – what is a client, what JavaScript enables us to create, what is the diff erence between a client-side dynamic document and at the server-side dynamic document. From the module “character encoding” a wrong answered question was chosen: Is it possible to change encoding of Czech text from Windows 1250 encoding to ISO Latin 2? It wasn’t only this question the student didn’t know, also basic terms contained in the question were missing, e.g. student didn’t have an idea what is a character encoding, what are national characters, which encodings are used for Czech language or which family of languages uses encodings Windows 1250 or PC Latin 2. Obviously there is no sense in asking on particular types of encoding a person, who doesn’t know what is a character encoding at all. Very similar result was with a wrong answered question from the module “databases”, the examined question was Which of following commands inserts into table knihy values ‘Beran’, ‘Typografi cký manuál’,3,2003?. When the student didn’t know we asked what a database is and he had no idea.
Based on the observation during the oral examination and other results a method of a computer adaptive testing was designed. This adaptive testing method should test relations within the knowledge and the context. Also the result of the test should be displayed in a “non-scalar” form, in a form keeping the structure of knowledge proven in the test. There are three common data structures suitable for this purpose of keeping the structured knowledge and also for the representation of the result of the test. Those data structures are mind maps, concept maps and topic maps.
Mind maps. Mind map serves for a graphical representation of the thoughts; basically it is a diagram, where terms are radially organized around a central term (Buzan, 1996). From the point of view of a graph theory a mind map is a tree.
Concept maps. Concept map contains a set of terms interconnected with named relations. Very o en, a concept map is used to store a compact piece of knowledge (Novak, Musonda, 1991).
Topic maps. They are standardized in an ISO standard ISO/IEC 13250:2003. They are defi ned as a “deterministic formal system of elements and sets of element modeling conversations and noting knowledge” (ISO/IEC, 2003). They are composed of two layers – upper and lower, that are connected through occurrences (Hunting, 2003).
A concept map of the part of the course Informatics for Economists II was created in a program CMapTools4. Into this map, results of the written test were entered up. Each question was related to one or more concepts or relations. Right answer meant coloring by green color, wrong
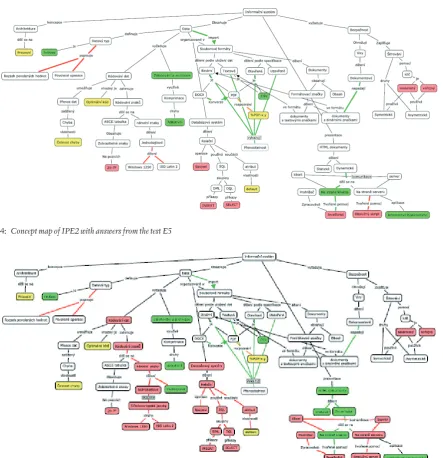
answer by red color, no answer yellow. This concept map is in Fig. 4.
Even in the thumbnail in 4, it is very obvious from the concept map, that the test is testing only fragmentary knowledge. Later, the questions from the oral exams were entered up into the same concept map under the same principle. This concept map is in Figure 5. This completion of the concept map gave us an overall image that corresponded to a “verbal” result of the exam – large red areas proving missing of basic knowledge, with some fragments of terms that the student knew.
The purpose of fi gures 4 and 5 is to illustrate the diff erence in coverage of the topic between the computer test and the oral exam. The content of the nodes is not important for this illustration.
Figure 6 is used for an illustration is a mind map of the whole course IPE2, where answers from the written test were visualized. On this mind map it is visible that the knowledge tested by the test lays only in the deepest layer, presuming that students have the knowledge of higher levels. The purpose of this fi gure is to illustrate the structure of the whole course compared with the coverage of the topic by the test. The content of the nodes is not signifi cant again.
DISCUSSION AND CONCLUSION
Examples from tests A1 and A2 show very deep ignorance behind wrong answers or skipped items in the tests. This ignorance was the main reason for evaluating of the result of the oral exam as worse
4: Concept map of IPE2 with answers from the test E5
than the test – depicted in fi gures 2 and 3. Absence of basic background knowledge was also observed in the examination of the complementary questions. It can be seen that diff erent test items leads to common ignorance of a basic knowledge.
Example tests named E2, E3 and E4 show cases when the result of the test doesn’t correspond to the oral exam at all. A subjective impression of the tests E2 and E3 was that students knew the test questions before the test (the test pool is not large enough for being used every semester with enormous amount of students, so there is very high probability that the questions are known to the students). Important note is that those two tests had the best two test results of the course IPE2, but the progress of the oral exam can be seen as the worst ones.
The subjective observation of the diff erences between both kinds of testing is depicted in fi gures 2 and 3. Especially fi gure 3 (course IPE2) supports an idea of Alfred Binet from the beginning of 20th century – a common test is calibrated for an average student, students under and over the average is put at disadvantage (Binet & Simon, 1905, in Weiss, 2004). This idea was a foundation for an adaptive testing.
Comparing fi gures 4 and 5 shows how much the knowledge tested by the computer test are out of context. Actually they are just lonesome terms, compared with the structure of the course depicted in 6, the result is irrelevant with the structure of the course.
A sum up of this observation can be a citation of prof. Vaníček: In any case, it is nonsense to count of partial results arithmetic means. If student did not understand any part of the topic, which is crucial for the given area, he must re-sit the exam, even if he mastered another part of the topic perfectly. On the other hand, an insensitive using of this rule without off ering a proper help, would be to too tough. For this reason, it is very disputable to make a decision based only at result of a written exam. The nescience doesn’t have to be always a deep ignorance. The wrong or missing answer can be a result only of a misunderstanding or omission.5
Primary results (relevant to the design of an adaptive test) of the comparison can be sum up as following:
• We can’t presume that the examinee knows the very basic terms (has the basic knowledge) for the given area. Even if the terms are commonly used within the course and their knowledge is taken for granted. Within the experiment those “missing basic knowledge” were mostly terms from pre-requisites courses.
• If the test item comprises a term, it should be proven that the term is known to the examinee. • Real knowledge is proven more by a testing of
a continuous area of the course than by testing of diff erent pieces of random areas.
• Knowledge of relations between the terms is an indicator of understanding of the area.
Those statements gave a base for a proposal of an adaptive test – it is crucial to test the relations between the terms and to pose the question in the moment, when it is proven that the student understands preceding facts. Before we can create a test which is testing knowledge of relations, it is necessary to organize the knowledge in a way capturing the relations. For this purpose two data structures were designed in dependency on previous research described in the section “Introduction”. First structure is based on a principle of mind map. It is diff erent from a mind map, we call it study map. The second structure is a concept map.
Solution design
All parts of our solution are designed for computer aid. Known principles of implementation of concept maps will be used for study map implementation but new formats for tests in each node will be developed. Algorithm for adaptive testing is presented below. Description of all design components is in following paragraphs.
Study map
The basic idea is to display a structure of a topic in a diff erent form than the linear form (used in books). Both mind and concept maps are considered by many researchers as a useful and functional tools used for this purpose in many areas (Beel, 2004; Buzan, 1996; Novak, 2006). Concerning the desired goal, concept or mind map it itself couldn’t be used, so a study map that evolved from the mind map and a concept map was created. The basic diff erences from the mind map is the content of the nodes – node in a mind map contains usually only one term, in the study map, the content is more rich. Next important diff erence lays in multiple parental nodes of the nodes in the study map. The study map captures all the topics of the course in a hierarchical structure. It has two purposes: it determines an order of questions in a test and it serves as a study material. Features of study map are following: • It is a general directed graph. The layout is similar
to a tree, but it can contain circles.
• There is a central node in the center; the name should defi ne a goal of the course.
• Name of the other nodes is a particular topic. Complete study map contains also a study text to the topic and a list of key terms.
• Each edge is directed, which creates the hierarchical structure.
• The fi rst nodes of all “branches” are the main topics of the course. They branch out in sub-topics in the same manner as book is divided into chapters and sub-chapters.
• If the study map is used as a base for test, it should be divided into layers. The fi rst proposal uses three layers. Based on other fi ndings, diff erent number of layers can be used.
Division in layers (using three layers):
• 1st layer: key, fundamental knowledge, crucial for understanding subsequent themes.
• 2nd layer: knowledge base of the course.
• 3rd layer: deep knowledge, necessary for best students, but also a student without this knowledge is able to pass the course.
6: Mind map of a course Informatics for Economists II with responses from test E5
Example of a study map created over a course Informatics for Economists II is in Fig. 7. The fi gure illustrates the structure of the study map and the division into layers – they are noted by diff erent colors of the edges: fi rst layer is red, second is yellow and the third is blue. The content of the nodes is not signifi cant.
Concept map
Above mentioned analysis of complementary questions and the test items with which they were used was a base for this concept map. Not all relations are captured in the study map. The second structure – concept map is indented to support the study map, it contains all the important terms and it captures all the relations, even those which cannot be captured in the study map. The concept map should be generated from the study map and then the other relations should be added manually. Examples of partial concept maps for a course IPE2 are Fig. 4 and Fig 5.
Test items
Each test item is bound with a particular term or with a relation. Bound term should be the most concrete as it is possible. It should be also watched into which layer the item belongs.
Test process
The test is adaptive. The test items are not given in advance, but they are chosen according to student answers. The principle of choosing items is similar to the “pyramid model” (Weiss, 2004). The adaptivity of the test should model the course of the oral exam and it is based on the hierarchy of the study map. Principle is following: in the case of the right answer, an item from the next layer is chosen, in the case of wrong answer, an item from a sibling of the node is chosen or the testing of the given branch is over (in dependency on other factors described lower). Hence in the case of right answers, the test is depth-fi rst search of the graph, in the case of wrong answers the test is breadth-fi rst search. The result of this principle is that no item is asked without proving preceding knowledge. In future, the following item should be chosen not only according to the study map, but according to the concept map as well.
The reason for division of the study map into layers is following: fi rst layer contains key knowledge, wrong answer in this layer means that the student misses fundamental knowledge and testing of this layer is over. Wrong answer on a second and third layer means next item from the sibling, but this breadth-fi rst search should be limited to avoid trying all the sub-branches –a er e.g. three following wrong answers, testing of the particular branch is over. This number is a question of further research.
Algorithm for choosing items is in a simplifi ed manner described in Fig 8.
Visualization of the test results
For the visualization of the test results the study map and the concept map are used. Both maps are colored according to the right or wrong answers in the test. Green color of a node or of a relation means right answer, red color is wrong answer. The result is given by area, not by a simple number. It represents one of the non-scalar representations of knowledge.
There are many future steps to be done. Designed methodology must be verifi ed in practice on a larger sample of students. Also a detailed methodology for creation of a study map and the test items and
their connection with terms must be created. The whole process and all the parts should be supported by a specialized so ware tool. There are also some possible drawbacks, which need to be solved or minimized.
Possible drawbacks – knowledge representation: • Proper creation of a study map is very crucial for
proper testing. Without good study map, the test won’t work properly. Creation of the study map can also be very time demanding. This can be partly sort by a so ware tool enabling to convert current study materials that already have structure in into the study map (e.g. a material in TeX or in HTML could be quite easily converted).
• Concept map can become very large and complex. Possible drawbacks – testing:
• Long duration of the test. • Huge pole of test items needed.
• Same size of the “branches” can’t be presumed, the number of test items can diff er for each student, and hence the objectivity of the test is not fulfi lled. This problem has to be sorted out; probably a solid number of test items will be given.
• According to the current proposal – about knowing or not knowing the topic (the node in the study map) is decided according to answer on one question, which is very strict.
• In current version of the proposal a skipping an item is not possible.
Those problems and drawbacks are a manner to solve. Especially the algorithm of choosing the questions must be exactly specifi ed.
SUMMARY
This article addresses the problem of computer-based student testing. A pedagogical experiment comparing information obtained from computer-based test and oral examination was performed in this area. The expected result was a diff erence between the two types of information. Possible solution of this problem is a construction of adaptive tests. So called study maps can be used as a tool for the construction. Nodes of the study map represent some part of study material and edges represent logical binding between them. Each node of study map can contain test part. The test poses questions in a logical context and presented testing algorithm impersonate oral exam. Results of adaptive test are in a form of area, not a simple number. Such area exactly represents student’s knowledge and enables to assign exact classifi cation. All parts of the proposed solution are suitable for computer implementation.
REFERENCES
BELA, J. G. B., OLAF, J., 2009: Information Retrieval on Mind Maps – What could it be good for? In: Proceedings of the 5th International Conference on Collaborative Computing: Networking, Applications and Worksharing (CollaborateCom’09). Washington: IEEE, p. 1–4. ISBN 978-963-9799-76-9.
BUZAN, T., BUZAN, B., 1996: The mind map book: how to use radiant thinking to maximize your brain’s untapped potential. 1st Plume print. New York: Plume, 320 p. Plume book. ISBN 04-522-7322-6.
DLABOLOVÁ, D., 2012: Pedagogical experiment and design of a system for an evaluation of knowledge tests. In: PEFnet 2012: European Scientifi c Conference of Ph.D. Students. Brno: Publikační centrum Mendelovy univerzity v Brně, 73 p. ISBN 978-80-7375-669-7.
HALUZA, P., TALANDOVÁ, P., 2009: Zkušenosti s výukou aplikované informatiky u neinformatických oborů na PEF MZLU v Brně. In: Zborník vedeckých prác doktorandov a mladých vedeckých pracovníkov „Mladí vedci 2009“, Nitra: Fakulta prírodných vied Univerzita Konštantína
Filozofa v Nitre, p. 1211–1219. ISBN 978-80-8094-499-5.
NOVAK, J. D., CANAS A. J., 2006: The Theory Underlying Concept Maps and How to Construct and Use Them. The Theory Underlying Concept Maps and How to Construct and Use Them [online]. 2006 [cit. 2013-05-02]. Available online: http://cmap.ihmc.us/ Publications/ResearchPapersTheoryCmaps/ TheoryUnderlyingConceptMaps.htm.
VANÍČEK, J., 1999: Co doopravdy vypovídají čísla a výpočty o reálném světě. In: Informatika IV/1999. Brno: Konvoj, s. 103–113. ISBN 80-85615-79-1. VANÍČEK, J., 2002: Na co klást důraz při výuce
a zkouškách z úvodu do informatiky pro informatiky. In: Informatika X/2002. Brno: Konvoj, s. 138–142. ISBN 80-7302-027-0.
WEISS, D. J., 2004: Computerized Adaptive Testing for Eff ective and Effi cient Measurement in Counseling and Education. Measurement and Evaluation in Counseling and Development. 37, 2: 69– 84. ISSN-0748-1756.
Address