R E S E A R C H A R T I C L E
Open Access
Effectiveness of communication of spatial
engineering information through 3D CAD and 3D
printed models
Gabriel B Dadi
1*, Paul M Goodrum
2, Timothy RB Taylor
3and William F Maloney
4Abstract
Background:Poor engineering information provided to construction crews results in inefficient communication of design, leading to construction rework, disputes, and lower worker morale. The resulting errors, omissions, and misinterpretations indicates that a significant opportunity exists to improve the traditional documentation of engineering information that craft professionals use to complete their work. Historically, physical three dimensional (3D) models built by hand provided 3D physical representations of the project to assist in sequencing, visualization, and planning of critical construction activities. This practice has greatly diminished since the adoption of three dimensional CAD (computer-aided design) and BIM (building information modeling) technologies. Recently, additive manufacturing technologies have allowed for three dimensional printing of 3D CAD models.
Methods:The effectiveness of 2D drawings, a 3D computer model, and a 3D printed model in delivering engineering information to an end-user are scientifically measured.
Results:The 3D printed model outperformed the 2D drawings and 3D computer interface in productivity and workload measures.
Conclusions:A physical model has the ability to improve communication of spatial design for certain tasks. This could lead to improved productivity, reduction of errors, and better quality for construction tasks. This paper’s primary contribution to the body of knowledge is that it identifies how different mediums of engineering information impact the communication of spatial engineering information.
Keywords:Communication; Visualization; 3D printing; Labor productivity
Background
While the U.S. construction industry comprises 5.4% of the overall U.S. Gross Domestic Product (GDP) (Bureau of Economic Analysis 2013; and Huesman et al. 2013), it lags the rest of the economy in terms of productivity measurement and improvement (Goodrum et al. 2002). Due to changes in real output and differences in ac-counting procedures, there is no isolated industry level measure of labor productivity (Bureau of Labor Statistics 2012), although recently the U.S. Bureau of Labor Statis-tics has developed an aggregate multifactor productivity measure for the combined agricultural, mining, and
construction industries (Bureau of Labor Statistics 2013). Regardless of this recent advancement, an isolated prod-uctivity index for the U.S. construction industry makes it difficult to track progress, benchmark, and measure the effects of governmental and industrial policies across the construction industry.
However, at a project level, productivity figures are more diligently kept, although still inconsistently company to company. With profit margins near 3%, firms must do what they can to track their performance and make neces-sary changes (Cooper and Lee 2009). A major contributor to the overall productivity is execution of workface prac-tices. If construction practitioners are not equipped with the necessary tools, information, materials, and equipment to effectively perform their tasks, the productivity of the project will be negatively affected. This research presents * Correspondence:[email protected]
1
Department of Civil Engineering, University of Kentucky, 151C Raymond Building, Lexington, KY 40506-0281, USA
Full list of author information is available at the end of the article
insights into how different mediums, specifically two di-mensional drawings, three didi-mensional computer models, and three dimensional physical models, of engineering in-formation influence the performance of task execution.
Information delivery and its effect on construction productivity
Traditionally, two dimensional drawings (commonly re-ferred to as blueprints) are the spatial and technical com-munication media for all project participants (Gould and Joyce 2013). Drawings are presented in a variety of for-mats including plan views, elevations, detailed sections, and isometrics. Individual drawings are often scaled, list dimensions, and frequently reference other sheets to help provide the user a representation of the final design intent from all viewpoints.
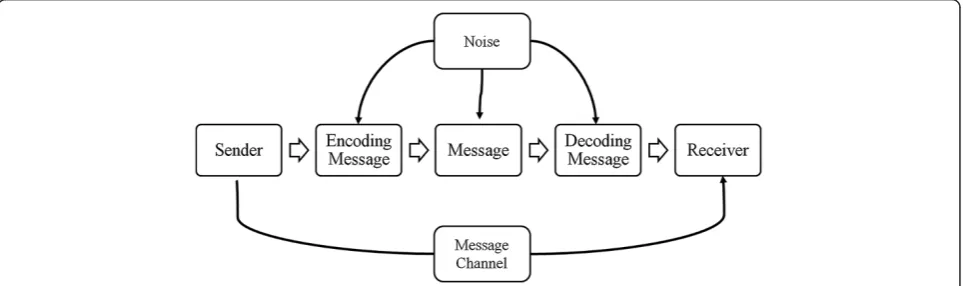
One of the main challenges in processing engineering graphical information is that the design may be well intended, but for a variety of reasons, the message received differs from the original intent. This process of creating a message, disseminating, and then processing essentially describes the well published theory of the linear standard communication process. Many models have been created to describe the process with varying stages, however, the essential elements are outlined in Figure 1 (Shannon and Weaver 1949; Schramm 1954; and Berlo 1960).
In this standard, linear model of communication, the sender must encode their interpretation of the desired end user information. This interpretation is then translated in the message medium, whether it is verbal or non-verbal. Receivers must decode the message into their individual interpretation, where the final message is processed and understood. However, the intermediary steps of encoding the message, the creation of the message, and decoding the message increases the potential for noise that can affect the ultimate outcome of the communication. The message channel is the actual flow of the message, verbal or nonverbal, from the sender to the receiver. In the linear model, there is very little, if any, feedback from the
receiver to the sender, where ultimately only a down-stream process occurs (Shannon and Weaver 1949; Schramm 1954; and Berlo 1960). In the communication of construction documents, poor design and poor design communication are two distinct opportunities for errors (Eckert and Boujut 2003). Poor design is the result of er-rors made by designers in the encoding process, while poor design communication are errors made in the inter-pretation or decoding of the message.
Errors made through poor design have been studied and identified as having an impact on project perform-ance. Several studies discuss errors in the design outputs concluding that many practitioners feel information de-livery is a deterrent to efficiently performing their job (Goodrum and Dai 2006; Dai et al. 2009a; Dai et al. 2009b; Mourgues and Fischer 2008; and Rojas 2008). The main inefficiencies from drawing management ac-cording to a survey of construction craft workers are due to errors in the drawing, availability of the drawings, slow management response to questions, legibility, and omission of necessary information on the documents (Goodrum and Dai 2006; Dai et al. 2009a; and Dai et al. 2009b). In a focus group study, Dai et al. (2005) found that craft professionals believe 32% of their negative productivity is due to inaccuracy and poor quality of infor-mation, with individuals claiming that “some drawings could not be physically built”. Rojas (2008) discusses inef-ficiencies from design drawings ultimately leading to in-creased rework on the project. Borcherding and Samelson (1980) found that rework was one of the three most sig-nificant drivers to poor productivity and decreased mor-ale, oftentimes as a result of poor engineering information design. Haas et al. (2011) found that design, engineering, instruction, and monitoring accounted for 29.08% of the total amount of rework on an analysis of records from the industrial sector. Supervisors and foremen then become focused on correcting engineering errors and rework in-stead of planning future work and focusing on crew per-formance. In the highway construction sector, an analysis
of change orders showed that omissions of information led to a 4.53% increase in original contract amount among a sample of roadway projects (Taylor et al. 2012). With 40% of the total construction cost being in direct and in-direct craft labor, there is a need to maximize efficiency and reduce non-value adding activities of the workers (Haas et al. 2011).
Similarly, poor design communication can lead to errors and confusion in task execution. Some of the issues result from the difference in the message intended versus the message received. The format and intent of drawings is easier to comprehend by the designer that creates the drawing than it is for the contractor and his/her workforce that has to interpret the message (Emmitt and Gorse 2003). This problem is magnified when the contractor must reference several different drawings to understand the design intent for a particular building element. Fur-ther, different symbols and terminology used by various designers can also lead to confusion and complications (Emmitt and Gorse 2003). Mourgues and Fischer (2008) argue that communication of project information to the workface is ineffective and can negatively impact quality, safety, and productivity. Studying the understanding and communication of design throughout all project partici-pants can greatly improve project outcomes by increasing project morale, improving productivity, and reducing rework.
Physical models and additive manufacturing
Physical scale models have had several uses in the struction industry, for tasks such as sequencing of con-crete and steel or for planning rigging, reinforcing steel, or excavation operations. Oglesby et al. (1989) surveyed managers who concluded that physical models were a useful tool for planning and communications, and that modeling pays for itself easily. However, no direct bene-fit was quantified. Physical models, as a supportive piece of information delivery, can be a useful information tool. A study estimates that labor costs can be reduced by 25% minimizing productivity losses on indirect work through a detailed execution planning strategy (O’Brien et al. 2011). The use of physical models in construction was prevalent historically, but their current use is dimin-ished (Emmitt and Gorse 2003). The development of 3D CAD technologies is cited as one of the main causes be-hind the fading use of physical scale models (Emmitt and Gorse 2003).
3D printing technologies have developed and advanced to the point where 3D CAD models can be effectively printed (Breen et al. 2003; and Simondetti 2002). These modeling techniques are defined to be “the process of joining materials to make objects from 3D model data, usually layer upon layer” (Buswell et al. 2007; and Lim et al. 2012). Having the ability to create physical models
through a printing process presents an opportunity to support traditional information delivery with an accur-ate, scaled representation of a three dimensional space. There are many models of 3D printers with similar tech-nologies. The printers work by essentially building up an object with individual thin layers of a material, such as plastics or starch. ABS (acrylonitrile butadiene styrene) plastics or PLA (polylactic acid) plastics are two of the more common plastic outputs. A 3D printed model was selected to represent a physical model to test its applic-ability as a format for information display. Ultimately, the means to achieve the end result of a physical model are not relevant to the outcomes of the study, as the pri-mary objective was to test a physical model as opposed to blueprints or a CAD model.
Mental workload
A critical cognitive component to the design of informa-tion delivery is in the mental workload requirements. Assuming that everyone has a fixed maximum cognitive capacity, mental workload is the amount of mental re-source required compared to the total rere-sources avail-able to that person (Carswell et al. 2005). An effective method of information delivery should reduce the men-tal workload requirements while allowing the necessary information to be conveyed. Typically, this involves re-ducing the amount of time the user must retain the in-formation in their working memory and reduce the irrelevant, distracting mental operations that may occur. Ultimately, a desirable level of mental workload leads to improvements in design communication as information is able to be retained.
Research in cognitive design has identified three classes of mental workload metrics used to evaluate the outcome of the study. The classes are physiologic, secondary task, and subjective measures (Carswell et al. 2005). Physiologic measures use indirect measures of mental workload by studying ocular and cardiac responses. These physiologic responses have a relationship with cognitive activity in the brain. Increased cognitive activity has been found to result in small increases in pupil dilation, slowing blinking pat-terns, more consistent heart rates, and heightened heart rates (Carswell et al. 2005). Secondary task measures look to identify the remainder of the mental workload, which is not occupied by performing the desired task. These sec-ondary tasks are developed for certain applications such as aviation and high-demand environments. For this study, objective and subjective measures are used as they are readily available, universally accepted, nonintrusive, and the simplest to administer.
measure mental workload in over 1,200 studies since its inception (Hart 2006). Although its use is widespread across fields (e.g. aviation, transportation, and other dis-play oriented fields), its use within construction research has been limited. Mitropoulos and Memarian (2013) in-vestigated task demands in masonry work using the NASA-TLX to identify factors affecting activity perform-ance and propose strategies to improve performperform-ance.
However, there are drawbacks to current subjective measures. The subjects must self-evaluate their perform-ance and their cognitive capacity. Response bias could factor into the results if the subjects are stakeholders in the study (Carswell et al. 2005). For instance, if conduct-ing this study with a veteran journeyman electrician, he or she may be inclined to prefer the traditional 2D draw-ing set because of their familiarity with the medium.
Methods
This research focuses on spatial information format as an initial mechanism for improving understanding and communication of design and evaluates three different formats using several measures. The ability to evaluate cognitive abilities of practitioners in using various infor-mation delivery formats requires defined performance metrics. In a discussion of construction communication deliverables, Emmitt and Gorse (2003) suggest that infor-mation formats must yield quick, simple, and easily inter-pretable results. Using those guidelines along with the cognitive principles and measures previously discussed, a series of evaluations have been created for assessment.
Cognitive task
The main portion of the experiment is a building task using scale model elements to recreate a structure based on given information. The basis of design for the experi-ment’s model must be simple enough to solely capture the cognitive aspects of spatial information processing, yet complex enough to where there is difficulty and mistakes can be made. If the model is too complex, the design would bias the results away from understanding the per-formance of medium. If the model is too simple, there will not be a differentiation in the measures. The structure design was created through a standard set of two di-mensional construction drawings (blueprints), a three dimensional computer aided design (CAD) model, and a physical model created by a three dimensional printer from the CAD model. These forms of media were se-lected as they are typical display formats and are ac-cepted as the forms used to communication spatial design (Emmitt and Gorse 2003). Subjects were pre-sented with information in one of the three formats, from a randomized sequence, and then instructed to build the structure from simple building elements. The same structure was used for each experiment but the
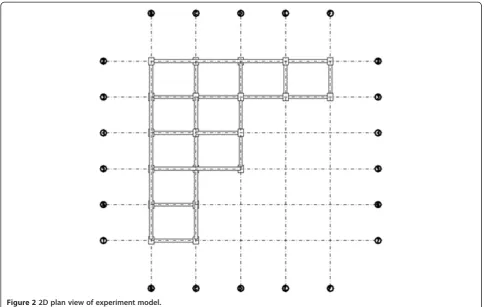
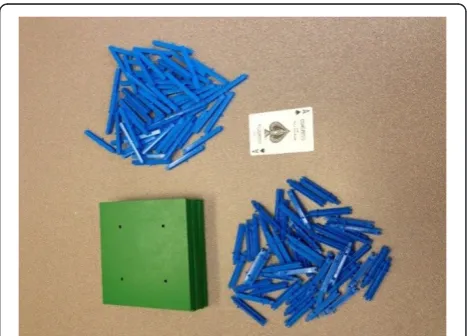
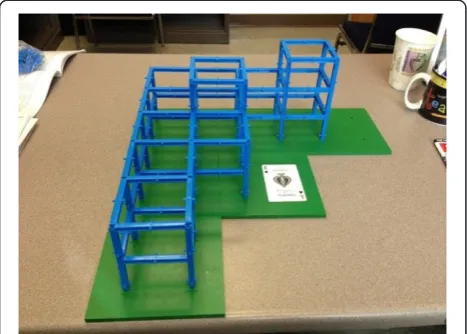
participants were not told that the three structures were identical. To control and identify a potential learning curve, the sequence that the mediums were presented was rotated. The subjects were free to manipulate the models as needed, and the order in which the subjects received the models was randomized and were available to consult throughout the experiment. Understanding that the sub-jects worked with the same model, the authors wished to identify if there was a learning curve present. Due to the scope of this paper and length restrictions, this phenom-ena was studied and reported in another publication (Dadi et al. 2014), where the authors examined the cognitive outcomes of the experiment in significant depth. The ob-jective of the previous manuscript was to study the cogni-tive outcomes of various information formats, where this current manuscript identifies the performance of the for-mats in many key areas such as speed to completion, productivity, and errors made. Samples of the 2D drawings are illustrated in Figures 2 and 3. The 3D CAD model is pictured in Figures 4 and 5. Finally, the physical model can be seen in Figure 6. Figures 7 and 8 show the building elements, the Tekton Tower Girder and Panel Building Set by Bridge Street Toys, before and after model creation respectively. The amount of building elements in the set outnumbered the pieces necessary to complete the model.
Sample group
Practitioners were recruited to provide a sample of indi-viduals that regularly use design and construction draw-ings for the purposes of field installation of the final design intent. The subjects from this sample group were recruited from engineering and construction firms through an e-mail invitation with a range of experience from one year to over thirty years. The scope of the study was presented to management and executive level employees at several companies throughout the state of Kentucky. In this notification of study, the employees were asked to make engineers and craft workers avail-able to complete the study, and the companies provided 26 individuals to complete the experiment. Job titles in-cluded carpenter, laborer, electrical, and mechanical fore-man, as well as project engineer and design engineer. The study attracted the participation of 26 subjects and are outlined in Table 1.
information delivery format. To conduct a five-minute rat-ing, a time sheet was prepared and divided into subsets of time and then columns for notation of the activity classifi-cation. The classification categories are direct work, indir-ect work, rework, and delay due to rework. Dirindir-ect work is defined as any physical building of the model towards the final product. Indirect work is defined as any activities performed towards the end result that is not physically building the model. This includes time getting familiar with the building elements, and manipulating and pro-cessing the information delivery format. Rework includes any disassembling or reassembling of a previously built
portion of the model. Finally, delay due to rework includes time spent reprocessing the information delivery medium after rework occurs.
To measure the cognitive performance of the subjects, the National Aeronautics and Space Administration Raw Task Load Index (NASA-rTLX) was utilized to measure mental workload. Mental workload is a measure of the amount of mental resources required to complete a task compared to the total amount of mental resources avail-able to that individual (Carswell et al. 2005). Often, the de-sired workload imposed by a task has a balance. Too much mental workload and the user may not have the Figure 22D plan view of experiment model.
capacity to maintain a proper level of performance. Too little mental workload and the user may not have the focus and diligence required to complete the task appro-priately (Hart and Staveland 1988; and Mitropoulos and Memarian 2013).
The NASA-TLX workload measure is a multidimen-sional tool that rates responses in accordance to six fac-tors: 1) mental demand, 2) physical demand, 3) temporal demand, 4) effort, 5) performance, and 6) frustration (Table 2). The traditional NASA-TLX obtains pairwise weights for each of the six factors prior to identifying a scaled response for the factors. These sub-factors then combine based on the weight from the pairwise scores to form a composite workload score. A derivative of the NASA-TLX is the NASA Raw Task Load Index (NASA-rTLX) that does not weight the subscales by their pair-wise comparisons, resulting in a composite workload score from an average of the subscales. Several studies
have found a strong correlation between the NASA-TLX and NASA-rTLX, which lends towards the adoption of the simpler NASA-rTLX tool (Moroney et al. 1995; Moroney et al. 1992; and Byers et al. 1989). This study utilized the NASA-rTLX tool to measure workload for the participants. Table 2 provides a description of the NASA-rTLX factors and the measurement scale.
Statistical analysis procedure
A key statistical measure used in the study’s experiments is the analysis of variance (ANOVA) procedure. ANOVA models seek to test whether there is a difference between means of several populations (Dielman 2005; Fellows and Liu 2008). The often performed procedure estimates sta-tistically significant differences between the means through an Fvalue, while also measuring the amount of variation in the dependent variable that is explained by Figure 43D computer model top view.
Figure 53D computer model isometric view.
Figure 63D printed model isometric view (shown next to standard size playing card for scale).
the independent variables (η2) (Dielman 2005; and Fellows and Liu 2008).
For this study, the three populations tested are individ-uals completing the experiment using the two dimensional drawing set, individuals completing the experiment using the three dimensional computer model, and individuals completing the experiment using the three dimensional printed, physical model.
To quantify these statistically significant differences, there are several post hoc tests available to compare multiple means. The original post hoc test was Fisher’s Least Significant Difference (LSD) test. This test com-pared multiple means through a series of t-tests. How-ever, no adjustment was made to the error rate for the comparisons. In the assumptions of a t-test, the sam-pling distribution was intended for only one test. When multiple comparisons are made, the true alpha value for significance is lower than 0.05, which is the value as-sumed in the LSD test (Dielman 2005). Another, more reasonable post hoc test is the Bonferroni method.
Bonferroni uses ttests to perform pairwise comparisons but sets the critical alpha value as the experiment-wise error rate divided by the total number of tests. This cor-rects for the effect that multiple tests has on the testedt value (Dielman 2005).
Results and discussion
For the model with all subjects, there were 26 participat-ing subjects, resultparticipat-ing in 77 complete buildparticipat-ing experi-ments. One individual could not complete a third model, which prevented the sample size from reaching 78. Each subject completed the task with all three model types in a randomized order. Table 3 reports the average results across all participants for the four key obtained variables.
The physical model had preferred outcomes in time to complete the experiment, composite mental workload, and direct work rate. The 2D drawing set resulted in the lowest rework rate percentage. Of significance, individ-uals spent more time interpreting the information from the 3D computer interface, whereas the physical model required little processing time. As with all information processing, the work task will demand the optimal dis-play format.
Preferences for engineering and construction tasks In a post-test questionnaire, the subjects were presented with real work scenarios that require the use of spatial information and asked which format should be used to complete the task. The scenarios were selected based on previous research on the advantages of display format (Boyer and Wickens 1994; Cockburn and McKenzie 2002; Hickox and Wickens 1999; and St John et al. 2001). Table 4 summarizes the desired information traits. Relative positioning presents better in two dimen-sions, as the specific planar dimensions can be focused on, and the third, and unnecessary dimension, is elimi-nated. When projective ambiguity is a concern, a two di-mensional format is superior. Projective ambiguity exists when three dimensions are recreated in a two dimen-sional format, resulting in a distorted third dimension. 3D displays better represent shape understanding as a full 360° viewing angle can be achieved. In a similar fashion, a 3D display allows the user to focus on a plane while still having quick reference to a third dimension. When understanding a layout or terrain, a profile view can be accessed while also having the depth (or width, depending on the chosen profile) dimension readily available. Finally, a 3D display allows for depth cues to be referenced. This means that a 2D sheet can be stud-ied while also having the third (depth) dimension repre-sented to give a point of reference for depth and location.
Figure 8Scale model building elements appropriately assembled (shown next to standard size playing card for scale).
Table 1 Sample demographics
Demographics Practitioners
Number 26
Age range (Mean/Median) 20-62 (40.7/40.5)
Number of engineering course work hours in post-secondary education
9-190
Years of experience (Mean/Median) 1-33 (16.5/15)
Position titles (Number,%) Carpenter foreman (11, 42%) Laborer foreman (5, 19%)
Electrical foreman (2, 8%)
Mechanical foreman (2, 8%)
Project fngineer (4, 16%)
There were four tasks presented in the post-test ques-tionnaire to identify preferences of the practitioners. The tasks were:
You are a structural steel subcontractor and need to plan and present an erection sequence, which information delivery format (s) would you use to complete the task (2D, 3D Interface, Physical Model)?
If you are calculating the necessary cubic yards of concrete for an upcoming slab pour, which information delivery format (s) would you use to complete the task (2D, 3D Interface, Physical Model)?
If you are a mechanical, electrical, or plumbing (MEP) engineer and need to design piping runs with sufficient access space, which information delivery format (s) would you use to complete the task (2D, 3D Interface, Physical Model)?
If you are estimating the quantity of earthwork that will have to be cut and/or filled on a project, which information delivery format (s) would you use to
complete the task (2D, 3D Interface, Physical Model)?
In a construction setting, a structural steel erection plan requires an understanding of relative positioning, as it involves coordination of the construction of steel shapes in two directions or dimensions. Therefore an ideal information format choice would be the 2D draw-ings. Calculating the required yardage of concrete for a future placement event requires an understanding of the shape and the ability to measure distances. Shape under-standing presents well in three dimensions, which would point towards the 3D computer model or the physical model. Being that distances are represented and auto-matically calculated in the computer software, the 3D computer model provides the best representation. MEP runs are typically associated with having sufficient access and coordination between the trades to fit the pipes in the allowable space provided. This requires depth cues and shape understanding without projective ambiguity. The depth cues and shape understand lends itself to-wards a 3D model, while projective ambiguity concerns
Table 2 NASA-rTLX factors and descriptions (Hart and Staveland, 1988)
NASA-rTLX factors Rating scale Description
Mental demand 1-100 (Low-High) How much mental and perceptual activity was required (e.g., thinking, deciding, calculating, remembering, looking, searching, etc.)? Was the mission easy or demanding, simple or complex, exacting or forgiving?
Physical demand 1-100 (Low-High) How much physical activity was required (e.g., pushing, pulling, turning, controlling, activating, etc.)? Was the mission easy or demanding, slow or brisk, slack or strenuous, restful or laborious?
Temporal demand 1-100 (Low-High) How much time pressure did you feel due to the rate or pace at which the mission occurred? Was the pace slow and leisurely or rapid and frantic?
Performance 1-100 (Good-Poor) How successful do you think you were in accomplishing the goals of the mission? How satisfied were you with your performance in accomplishing these goals?
Effort 1-100 (Low-High) How hard did you have to work (mentally and physically) to accomplish your level of performance?
Frustration 1-100 (Low-High) How discouraged, stressed, irritated, and annoyed versus gratified, relaxed, content, and complacent did you feel during your mission?
Table 3 ANOVA results: model type by dependent variables, all subjects
Dependent variables Mean Overall mean N df F p η2
Time to completion (secs) 2D 10.02 10.70 77 74 1.73 0.19 0.045
3D 11.75
Physical 10.33
NASA composite workload (1-100 scale) 2D 33.72 34.26 77 74 0.47 0.63 0.012
3D 36.63
Physical 32.34
Direct work rate (%) 2D 75.55 76.53 77 74 16.77* <0.00 0.312
3D 66.69
Physical 87.78
Rework rate (%) 2D 3.41 4.38 77 74 0.68 0.51 0.018
3D 5.82
Physical 3.90
lead the user towards a 2D representation. However, a physical model provides the necessary depth cues and shape understanding in a proper and efficient 3D repre-sentation. Finally, estimating the quantity of earthwork for cut and fill requires project information and layout understanding of the terrain. Similar to the concrete placement scenario, a 3D computer has the necessary display, information, and calculating tools to complete the task.
Having reviewed the scenarios and proper information format displays, Figures 9, 10, 11, and 12 display the preferences for practitioners to complete the steel erec-tion plan, concrete placement, MEP coordinaerec-tion, and earthwork quantity calculation tasks respectively.
For the steel erection sequence plan, subjects preferred the 3D computer model 58% of the time, 2D drawings 23%, and a physical model 19%. Literature suggests the 2D drawings would be preferred as it gives a proper viewing of relative positioning of the steel members. A 3D com-puter model would distort distances due to projective am-biguity and does not provide addition information that would be desirable. In addition, the practitioners did not perform a simple steel erection sequence during the task completion. It would be a reasonable assumption that a more complex project with more moving parts would prove even more difficult.
When calculating concrete quantities for a slab place-ment, 62% of practitioners preferred using 2D drawings compared 38% preferring a 3D computer model and 0% for a physical model. This task requires shape under-standing and underunder-standing of necessary dimensional properties, which makes a 3D computer model a super-ior choice. Given this information, subjects likely prefer the 2D drawings due to their limited experiences with CAD technologies. In the current CAD software pack-ages, a concrete slab element can be clicked on and exact quantities will immediately be presented. Without this knowledge and experience, practitioners revert to their familiarity with quantity takeoffs from two dimen-sional drawings.
Table 4 2D versus 3D display comparisons
Tasks where 2D displays are advantageous
Tasks where 3D displays are advantageous
Relative positioning Shape understanding
Projective ambiguity concern Layout understanding
Depth cues
Figure 9Practitioner’s preferences for planning steel erection sequence.
Figure 10Practitioner’s preferences for quantity takeoff of concrete for slab placement.
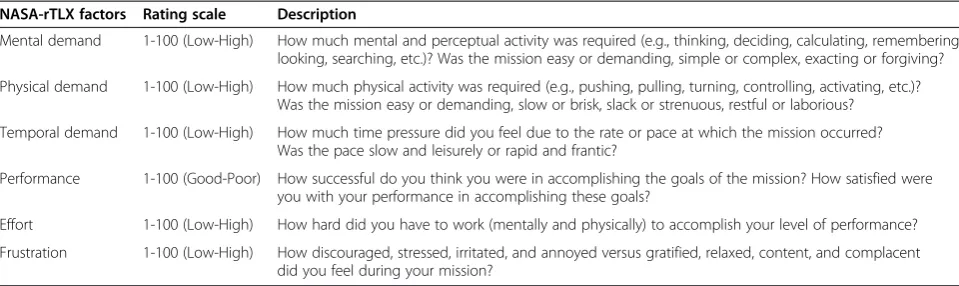
With the need for depth cues, shape understanding, and avoidance of projective ambiguity, coordinating the loca-tions of mechanical, electrical, and plumbing pipes is a de-manding task. On one hand, depth cues and shape understanding require a 3D display, while a standard 3D display presents issues of projective ambiguity. The issue is averted in a physical model where subjects benefit from depth cues and shape understanding of a 3D display and avoiding projective ambiguity from a true three dimen-sional, haptic output. However, 77% of practitioners pre-ferred a 3D computer model, while 15% and 8% chose 2D drawings and a physical model respectively.
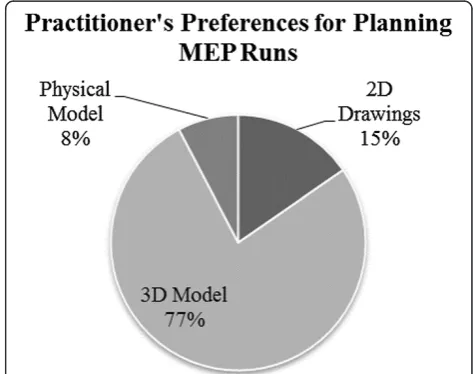
Calculating cut and fill earthwork quantities requires a knowledge of the terrain and layout, and ideally, the ability to quickly calculate volumes. 3D CAD software packages are readily equipped with this capability and provide a 3D display that is optimal to complete the task. 58% of practitioners appropriately identify the 3D computer model as the information format of choice for this operation, while 42% would use the standard 2D drawing set and 0% would reference a physical model.
When these responses are aggregated (see Figure 13), 58% of practitioners would use a 3D model for the con-struction tasks. 34% and 8% would use 2D drawings and a physical model respectively. These numbers are inter-esting, as the results of the experimental task showed that practitioners perform better with a physical model. Practitioners had difficulty manipulating the computer model to a proper and efficient orientation. In fact, several practitioners could not turn the computer model towards a desired display and ended up turning their work plat-form to match the orientation on the screen. Furthermore, the participants indicated a significantly higher NASA Composite Workload Demand with the 3D computer
model than either of the 2D or physical model (Table 3). With this much difficulty with a simple structural model, a more complex and layered computer model, as are the ones currently populating the industry, would prove to be too burdensome and laborious for efficient field interpret-ation. Despite the participants’ difficulty in manipulating the 3D model, the participants still indicated a signifi-cantly stronger preference for using 3D digital information to perform these common construction tasks. Moving for-ward, these suggests provide compelling data that improv-ing the delivery of 3D digital information to construction crews is both desired and would be beneficial in improv-ing craft worker performance.
Conclusion
The current work tested subjects using various formats of information delivery (2D, 3D interface, and a physical model) to complete a building task and evaluated per-formance through cognitive and productivity measures. This paper’s primary contribution to the body of know-ledge is identification of how different mediums of en-gineering information influences the performance of construction task execution. By conducting a cognitive task experiment, the performance and preferences of subjects with a 3D computer interface and a physical, haptic model was evaluated.
The cognitive workload mean scores were lower with the physical model than the two dimensional drawings Figure 12Practitioner’s preferences for calculating cut and fill
earthwork quantities.
and three dimensional computer model average composite workload. These findings suggest that 3D printed models present a promising alternative as at lease a supplemental form of spatial information to the traditional forms of infor-mation delivery. There are forms of engineering informa-tion, such as dimensions and material specifications, that are impractical to be imposed on a 3D printed model with current printing capabilities. While a 3D computer model may be a more convenient method to representing 3D de-sign due to its current prevalence in industry, it does not appear to be an effective method for spatial designs. This can negate the benefits of the third dimension, since space is the critical addition to the information presentation.
For construction practitioners, the current work implies that physical models present a potential alternative for spatial representation than a 3D computer model and even 2D drawings for spatial tasks. The physical models have higher direct work rates and lower composite work-load scores than a 3D computer model and 2D drawings. The task dependent nature of information displays, along with the performance of subjects in the experiment sug-gest specific situations control the advantages and disad-vantages of various mediums. For example, 2D drawings can be useful in tasks involving layouts and relative posi-tioning of objects. A 3D computer model can be useful for dimensioning 3D elements, repetitive calculations, and shape properties due to the intelligence contained within the model. Physical models provide an advantage for tasks that require visualization of spatial elements, coordination of space, and a scaled understanding of depth such as crit-ical lift planning, structure steel sequencing, and planning staging areas for material. Limitations of the current work include a limited sample size and the limited applicability of the model building task to an actual construction task. With a larger sample size and replication of actual con-struction tasks, the implications for concon-struction practi-tioners become more impactful. Future work in this area includes further analysis of mental workload in construc-tion professionals to begin the process of understanding the cognitive work demands associated with construction tasks. The outcomes of such studies can identify compo-nents of tasks that are mentally demanding and inhibit understanding and execution of the task efficiently. Fur-thermore, there is a need to examine the use of 3D printed models for more complex designs that can be physically assembled and dissembled by craft workers and other end users and the influence this would have on construction performance. This in essence would replicate the function that traditional modeler built physical models provided on jobsites decades ago. In addition, the current cost to 3D print a project model is substantial, and the print sizes can be relatively small. A cost-benefit analysis on the use of a 3D printed model as a means of information presentation is needed.
Competing interests
The authors declare that they have no competing interests.
Authors’contributions
GBD conducted the literature review, administered the experiments, collected the data, and wrote the initial draft of the manuscript. PMG revised the manuscript for intellectual content, was instrumental in the concept of the experiment, and assisted in the design of the experiment. TRBT revised the manuscript for intellectual content, assisting in drafting the scope of the manuscript, and assisted in the design of the experiment. WFM revised the manuscript for intellectual content and assisted in the design of the experiment. All authors read and approved the final manuscript.
Author details
1
Department of Civil Engineering, University of Kentucky, 151C Raymond Building, Lexington, KY 40506-0281, USA.2Department of Civil,
Environmental, and Architectural Engineering, University of Colorado Boulder, 428UCB, 1111 Engineering Drive, Boulder, CO, USA.3Department of Civil Engineering, University of Kentucky, 151A Raymond Building, Lexington, KY, USA.4Department of Civil Engineering, University of Kentucky, 151B Raymond Building, Lexington, KY, USA.
Received: 19 June 2014 Accepted: 23 October 2014
References
Berlo, DK. (1960).The Process of Communication: An Introduction to Theory and Practice. New York: Holt, Rinehart and Winston: The University of Michigan. Borcherding, S, & Samelson. (1980). Improving motivation and productivity on
large projects.Journal of the Construction Division, 106, No. CO1, 77. Boyer, BS, & Wickens, CD. (1994).3D weather displays for aircraft cockpits(Technical
Report ARL-94-11/NASA-94-4). Savoy, IL: Aviation Research Laboratory. Breen, J, Nottrot, R, & Stellingwerff, M. (2003). Tangible virtuality–perceptions of
computer-aided and physical modelling.Journal of Automation in Construction, Elsevier, 12, 649–653.
Bureau of Economic Analysis. (2013).National Income and Product Accounts Tables: U.S. Department of Commerce. http://www.bea.gov/iTable/iTable.cfm? ReqID=9&step=1#reqid=9&step=3&isuri=1&903=317 (July 16th, 2013). Bureau of Labor Statistics. (2012).Overview of BLS Productivity Statistics: U.S.
Department of Labor. http://www.bls.gov/bls/productivity.htm (April 21st, 2013).
Bureau of Labor Statistics. (2013).News Release: Multifactor Productivity Trends for Detailed Industries, 2011(USDL-13-1941): U.S. Department of Labor. http://www.bls.gov/news.release/pdf/prin3.pdf.
Buswell, RA, Soar, RC, Gibb, AGF, & Thorpe, A. (2007). Freeform construction: mega-scale rapid manufacturing for construction.Journal of Automation in Construction, Elsevier, 16, 224–231.
Byers, JC, Bittner, AC, & Hill, SG. (1989).“Traditional and raw task load index (TLX) correlations: Are paired comparisons necessary?”. In A Mital (Ed.),Advances in Industrial Ergonomics and Safety(pp. 481–485). London: Taylor and Francis. Carswell, CM, Clarke, D, & Seales, WB. (2005). Assessing mental workload during
laparoscopic surgery.Surgical Innovation, 12(1), 80–90.
Cockburn, A, & McKenzie, B. (2002). Evaluating the Effectiveness of Spatial Memory in 2D and 3D Physical and Virtual Environments. InCHI 2002. Minneapolis, MN: ACM, New York.
Cooper, K, & Lee, G. (2009).“Managing the Dynamics of Projects and Changes at Fluor.”Conference of the System Dynamics Society. InProceedings from the 27th International Conference of the System Dynamics Society(pp. 1–27). Albuquerque, New Mexico.
Dadi, GB, Goodrum, PM, Taylor, TRB, & Carswell, CM. (2014). Cognitive workload demands using 2D and 3D spatial engineering information formats.Journal of Construction Engineering and Management, 140(5), 04014001.
Dai, J, Goodrum, PM, Maloney, WF, & Sayers, C. (2005). Analysis of Focus Group Data Regarding Construction Craft Workers’Perspective of the Factors Affecting Their Productivity. InProceedings from the 2005 Construction Research Congress (pp. 1–10): Published by the American Society of Civil Engineers.
Dai, J, Goodrum, PM, Maloney, WF, & Srinivasan, C. (2009b). Latent structures of the factors affecting construction labor productivity.Journal of Construction Engineering and Management, 135(5), 397–406.
Dielman, TE. (2005).Applied Regression Analysis: a Second Course in Business and Economic Statistics 4th ed. Mason, OH: South-Western Cengage Learning. Eckert, C, & Boujut, JF. (2003). The role of objects in design co-operation:
communication through physical or virtual objects.Computer Supported Cooperative Work, 12, 145–151.
Emmitt, S, & Gorse, C. (2003).Construction Communication. Oxford: Blackwell Publishing. Fellows, R, & Liu, A. (2008).Research Methods for Construction(3rd ed.). Malden,
MA: Wiley-Blackwell Publishing.
Goodrum, PM, & Dai (CII), J. (2006).Work Force View of Construction Productivity (Research Summary 215-1). University of Texas at Austin: The Construction Industry Institute.
Goodrum, PM, Haas, CT, & Glover, R. (2002). The divergence in aggregate and activity estimates of U.S. construction productivity.Journal of Construction Management and Economics E & F N Spon, 20(5), 415–423.
Gould, F, & Joyce, N. (2013).Construction Project Management(4th ed.). New Jersey: Prentice Hall.
Haas, CT, Goodrum, PM, Caldas, CH, Granger, R, & Zhang, D. (2011).A Guide to Construction Rework Reduction(Implementation Resource 252-2b). University of Texas at Austin: The Construction Industry Institute.
Hart, SG. (2006).“NASA-task load index (NASA-TLX); 20 years later”. InProceedings of the Human Factors and Ergonomics 50thAnnual Meeting(pp. 904–908). Santa Monica, CA: Human Factors and Ergonomics Society.
Hart, SG, & Staveland, LE. (1988).Development of the NASA-TLX (Task Load Index): Results of empirical and theoretical research.
Hickox, JG, & Wickens, CD. (1999). Effects of elevation angle disparity, complexity and feature type on relating out-of-cockpit field of view to an electronic cartographic map.Journal of Experimental Psychology: Applied., 5, 284–301. Huesman, J, Holland, L, & Langley, T. (2013).December 2012 Construction at $885.0
Billion Annual Rate: U.S. Census Bureau News. U.S. Department of Commerce. http://www.census.gov/construction/c30/pdf/pr201212.pdf. (July 16th, 2013). Lim, S, Buswell, RA, Le, TT, Austin, SA, Gibb, AGF, & Thorpe, T. (2012). Developments
in construction-scale additive manufacturing processes.Journal of Automation in Construction, Elsevier, 21, 262–268.
Mitropoulos, P, & Memarian, B. (2013). Task demands in masonry work: sources, performance implications and management strategies.Journal of Construction Engineering and Management., 139(5), 581–590.
Moroney, WF, Biers, DW, Eggemeier, FT, & Mitchell, JA. (1992).A comparison of two scoring procedures with the NASA Task Load Index in a simulated flight tasks(pp. 734–740). Dayton, OH: Proceedings from NAECON.
Moroney, WF, Biers, DW, & Eggemeier, FT. (1995). Some measurement and methodological considerations in the application of subjective workload measurement techniques.International Journal of Aviation Psychology., 5(1), 87–106. Mourgues, C, & Fischer, M. (2008).A Work Instruction Template for Cast-in-Place
Concrete Construction Laborers: Center for Integrated Facility Engineering. Stanford University. Working Paper #109.
O’Brien, B, Leite, F, & Meeks, S. (2011).Enhanced Work Packaging: Design through Workface Execution(Implementation Resource 272-2). University of Texas at Austin: The Construction Industry Institute.
Oglesby, CH, Parker, HW, & Howell, GA. (1989).Productivity improvement in construction. New York: McGraw-Hill.
Rojas, EM. (2008).Construction productivity: a practical guide for building and electrical contractors. Fort Lauderdale: J. Ross Publications.
Schramm, W. (1954).The Process and Effects of Communication. Champaign, IL: University of Illinois Press.
Shannon, CE, & Weaver, W. (1949).The Mathematical Theory of Communication (Vol. 1). Champaign, IL: University of Illinois Press.
Simondetti, A. (2002). Computer-generated physical modelling in the early stages of the design process.Journal of Automation in Construction, Elsevier, 11, 303–311.
St John, M, Cowen, MB, Smallman, HS, & Oonk, HM. (2001). The use of 2D and 3D displays for shape-understanding versus relative-position tasks.Human Factors, 43(1), 79–98. Human Factors and Ergonomics Society.
Taylor, TRB, Uddin, M, Goodrum, PM, McCoy, A, & Shan, Y. (2012). Change orders and lessons learned: knowledge from statistical analyses of engineering change orders on Kentucky highway projects.Journal of Construction Engineering and Management, ASCE, 138(12), 1360–1369.
doi:10.1186/s40327-014-0009-8
Cite this article as:Dadiet al.:Effectiveness of communication of spatial
engineering information through 3D CAD and 3D printed models.
Visualization in Engineering20142:9.
Submit your manuscript to a
journal and benefi t from:
7Convenient online submission 7Rigorous peer review
7Immediate publication on acceptance 7Open access: articles freely available online 7High visibility within the fi eld
7Retaining the copyright to your article