O R I G I N A L A R T I C L E
Open Access
Estimation of body height from
percutaneous length of tibia in Debre
Markos University students, North West
Ethiopia
Bickes Wube Sume
Abstract
Introduction:Estimation of body height from measurement of various body parts is a particular interest to forensic scientists to complete biological profile after death. However, establishing the identity of an individual from mutilated, decomposed, and amputated body fragments has become a challenging task in medico-legal cases.
Objective of the study:To estimate body height from percutaneous length of the tibia in Debre Markos University (DMU) students.
Materials and methods:Institution-based cross-sectional prospective study was conducted in undergraduate students of DMU. The sample size was 572, and data were collected from April 2018 to December 2018. Height and percutaneous tibial length were measured in both sexes. Data were analyzed through SPSS version 25. Level of significance was set at P< 0.05.
Results: The mean age of study participants was 21.27 ± 1.74 years for males and 20.41 ± 1.58 years for females. The mean height of study participants was also 168.36 ± 5.89 cm for males and 165.24 ± 4.01 cm for females. The tibial length was strongly correlated with body height in the males than the females: right tibial length (malesR= 0.634, femalesR= 0.259) and left tibial length (malesR= 0.632, femalesR= 0.258). Independentttest exhibited statistically significant gender differences (P< 0.05) with the males having consistently higher values than the females. Pairedt test revealed the existence of bilateral asymmetry between the right and left tibial lengths (P< 0.05). The relatively highest correlation was depicted in the right tibial length in both males and females.
Conclusion:The mean value of height and tibial length was greater in males than that of females, and these differences were statistically significant (P < 0.05). Tibial length was significantly (P < 0.05) correlated with height in both sexes. Therefore, tibial length can predict body height in both sexes.
Keywords: Estimation of body height, Percutaneous tibial length, Forensic
Introduction
Height is one of the important parameters in the anthropometric study of humans. Stature is natural heights of a person in an upright position. It represents the distance between the top of the head (vertex) and the bottom of the feet. It is an important physical identity (Khatun et al.2016).
Except in some pathological cases or under some eco-logical factors, human body height has a proportional biological relationship with other parts of the body (Agnihotri et al. 2007). The height of a person, which itself is a sum of the length of certain bones and append-ages of the body, represents certain relationship with form of proportions to the total stature. It takes a very important role both in anthropological research and identification process necessitated by medico-legal ex-perts (Anirban et al.2013).
© The Author(s). 2019Open AccessThis article is distributed under the terms of the Creative Commons Attribution 4.0 International License (http://creativecommons.org/licenses/by/4.0/), which permits unrestricted use, distribution, and reproduction in any medium, provided you give appropriate credit to the original author(s) and the source, provide a link to the Creative Commons license, and indicate if changes were made.
Correspondence:[email protected]
School of Medicine, Debre Markos University, +251269 Debre Markos, Ethiopia
Egyptian Journal of
Forensic Sciences
SumeEgyptian Journal of Forensic Sciences (2019) 9:51Establishing the identity of an individual from muti-lated, decomposed and amputated body fragments has become a challenging task in medico-legal cases and a necessity in recent times due to natural disasters like earthquakes, tsunamis, floods, and man-made disasters like terrorist attacks, bomb blasts, car accidents, wars, and plane crashes. Victims are also attacked by wild animals in deep forests which makes difficult to identify the deceased (Wankhede et al.2015).
On the other hand, correlation of height from pharmaco-kinetic parameters and evaluation of nutritional status rely on accurate measurements of not only body weight but also height. However, a number of common disabilities and dis-ease processes make it difficult to accurately measure the standing height in many patients (Mondal et al.2009), such as old people, myopathy, spinal disorder patients, and also incomplete and decomposing corpse (Ghanbari et al.2016). In such situations as stated above, estimation of stature becomes equally important along with other parameters which are age, gender, and race (together referred to as the “Big Four”of forensic anthropology) (Ukoha et al.2016).
Equations produced for one population do not always give accurate results for another population due to differences in diet, environment, and lifestyle of each population (Song-in et al. 2013). Identification becomes necessary in the living, recently dead persons, decom-posed bodies, and skeletal remains and is required in civil and criminal cases (Arif et al. 2018). The aims and objectives of this study, therefore, were (1) to investigate the relationship and existing distribution between body height and percutaneous tibial length, (2) to identify the presence of bilateral asymmetry and gender difference, and finally (3) to develop predictive regression models for body height estimation from percutaneous length of tibia in Debre Markos University students.
Materials and methods Sampling
In this cross-sectional prospective study, 572 volunteer adult students (286 males and 286 females) of age group 18 to 26 years studying in Debre Markos University were selected using a multi-stage sampling method. Debre Fig. 1Measuring body height of male (right) and female (left) participants
Markos University has six colleges, two schools, and two institutions. The primary sampling units (PSU) were selected by lottery method as colleges, schools, and institu-tions. Secondary sampling units (SSU) were also selected by lottery method from primary sampling units as depart-ments. The tertiary sampling units (TSU) were students and selected by simple random sampling method accord-ing to inclusion criteria. The PSUs were Health Science College, Technology College, Agriculture and Natural Resource College, School of Law, and Institution of Educa-tion and Behavioral Sciences. The SSUs were departments such as Public Health, Nursing, Midwifery, Civil Engineer-ing, Electrical EngineerEngineer-ing, Construction Management, Natural Resource Management, Animal Science, Psych-ology, and School of law. The TSUs were students and interviewed and measured according to inclusion criteria until the desired sample size was attained. The number of male and female students was proportional from the total sample size, 572. Oral interview revealed that the selected participants were only Ethiopian parental roots and came from Amhara, Oromo, Tigray, Southern Nations, Nationalities, and Peoples’Region (SNNP), Afar, Gambella, and Benishangul-Gumuz ethnicities. Participants without any obvious congenital or acquired deformity of the spine, extremities, and head and who volunteered to participate were included in the study. Participants that have deformities of the spine, extremities, and significant growth disorder were excluded from the study. Further-more, the acutely ill, the physically challenged, any individ-uals known to be on some form of continuous medication or being in a poor state of health manifesting with overt signs of stunting, physical emaciation, and grotesque obesity were also excluded. Data were collected from April 2018 to December 2018.
Anthropometry
Equipment
1. Stadiometer (PRESTIGE)
2. Non-elastic measuring tape meter 3. Digital sliding caliper
Measurement techniques
Standing height was measured to the nearest 0.1 centi-meters (cm) using a stadiometer with the subject stand-ing erect on a horizontal reststand-ing plane, barefooted, having palms of hands turn inward, and fingers pointing downwards. The head was adjusted in the Frankfurt horizontal plane. All measurements were taken by bring-ing the slidbring-ing horizontal bar up on the vertex. It was measured from the sole of the feet to the vertex of the head as recommended by the International Biological Program (Ibegbu et al.2015) (Fig.1).
For measuring the percutaneous length of the tibia, the person was asked to sit on a stool so that the thigh should be placed in a straight line, and the leg and thigh should be placed right angle to each other (maintain the angle of 90°with each other); the foot was rotated laterally, so that the bony projection were prominently seen. Then, prox-imal and distal points of the tibia were marked by a marker pencil. Then, the two points (proximal and distal) were measured by non-elastic measuring tape meter and sliding caliper. Then, the tibial length was measured between the medial most superficial point on the upper border of medial condyle of the tibia and the tip of the medial malleolus (Trotter and Gleser1952) (Fig.2).
Data quality control
Data were collected by two personnel: one male (Bachelor of Science in Public Health) and one female (Bachelor of Science in Midwifery). To maintain data quality, training was given for data collectors about anthropometric measurements and measurement errors. Data collectors had reliability testing as part of the training, aimed to achieve technical errors within internationally accepted limits. All measurements were taken by the trained tester/ measurer. Properly designed data collection materials were prepared. Supervision was carried out by the princi-pal investigator during data collection times to check completeness and consistency of data. The reliability and representativeness of data were also maintained by incorp-orating only complete data of study participants with in the study period.
Statistical analysis
Data were entered in EPI data version 3.1 and analyzed using SPSS version 25 statistical software. Data were analyzed for mean, standard deviation, and standard Table 1Descriptive statistics of height and percutaneous tibial
length of male participants
Parameters (cm) Minimum Maximum Mean Standard deviation (SD)
Stature/height 155.0 182.0 168.36 5.90
RT tibial length 28.1 45.0 37.05 3.27
LT tibial length 28.2 45.0 37.09 3.26 RTright,LTleft,cmcentimeter
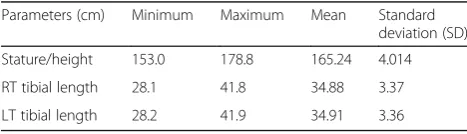
Table 2Descriptive statistics of height and percutaneous tibial length of female participants
Parameters (cm) Minimum Maximum Mean Standard deviation (SD)
Stature/height 153.0 178.8 165.24 4.014
RT tibial length 28.1 41.8 34.88 3.37
LT tibial length 28.2 41.9 34.91 3.36 RTright,LTleft,cmcentimeter
errors of estimate (SEE), using independent and pairedt tests. The Kolmogorov-Smirnov test was carried out to determine the normality of the samples. Independent t test was used to assess the evidence of sexual dimorph-ism in the study samples. The pairedttest was also used to determine the existence of bilateral asymmetry. Significance levels for differences were set at P< 0.05 (with 95% confidence interval). The Pearson’s correlation coefficients (R) were adopted as the measure of strength of the association between height and percutaneous tibial length for both males and females. Coefficient of determination (R2) was estimated to determine how much of the variance in the dependent variable could be explained by its relationship to the other variables. Linear regression equations were derived as predictive models for body height estimation from percutaneous tibial length.
Results
The mean age of the respondents was 21.27 ± 1.74 and 20.41 ± 1.58 years for males and females respectively. Body height was ranged from 155.0 to 182.0 cm with a
mean height of 168.36 ± 5.89 cm for male participants. In females, body height was also ranged from 153.0 to 178.8 cm with a mean height of 165.24 ± 4.01 cm (Table1 and Table2).
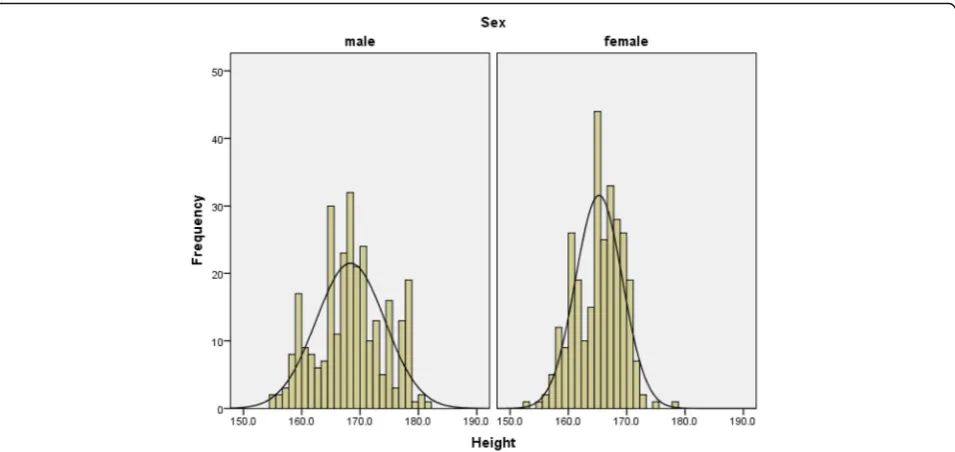
The strength of gender difference in the height and percutaneous tibial length was assessed using independ-ent (unpaired) samplettest (Fig.3). It was observed that the overall mean value of the height and percutaneous tibial length of male participants were greater than that of females, and all these differences were statistically significant (P< 0.05). The presence of bilateral asym-metry between the right and left percutaneous tibial lengths was also assessed using paired samplettest and is statistically significant (P < 0.05) for both male and female participants.
Bilateral percutaneous tibial length measurements revealed a positive and statistically significant correlation with body height (P< 0.05) in both sexes. The highest correlation was depicted in the percutaneous tibial length of male participants than that of female partici-pants (Table3).
Estimation of height from right and left percutaneous tibial length measurements of male and female partici-pants are provided in Table4and Table5(Figs.4and5).
The dependent (paired) t test for comparison of estimated height and actual height for each percutaneous tibial length in male and female participants are provided in Table6and Table7. For both the right and left percu-taneous tibial lengths, there were statistically insignificant differences (P > 0.05) between the mean values of esti-mated height and actual height in male participants (Table6).
Fig. 3Histogram for distribution of body height for both sexes
Table 3Correlation of height with percutaneous tibial length for male and female participants
Parameters (cm) Male = 286 Female = 286
Stature/height Stature/height
R P R P
Right tibial length (RTL) .634 .001 .259 .001
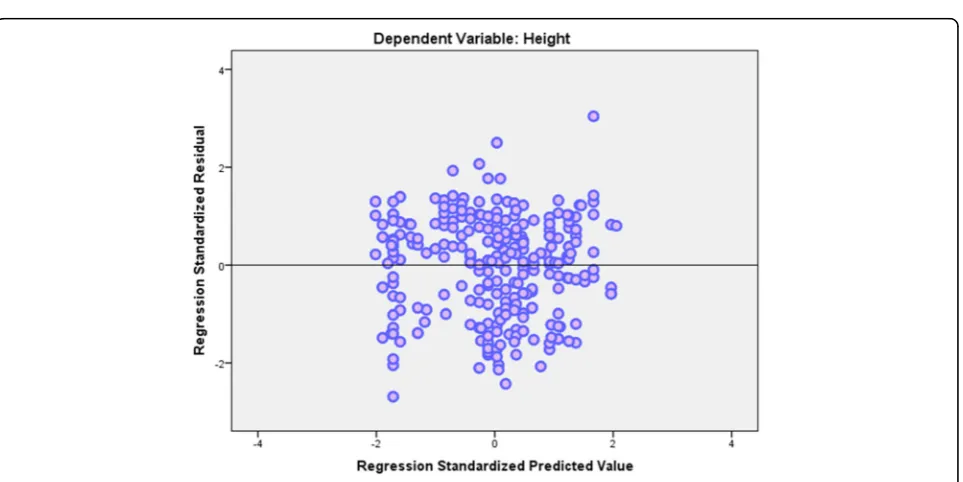
In females, it was also observed that there were statis-tically insignificant differences (P > 0.05) between mean values of estimated height and actual height (Table 7) (Figs.6and7).
Discussion
The present study was designed to estimate body height from percutaneous tibial length measurement in 572 students (286 males and 286 females) of Debre Markos University. The age group of students was ranged from 18 to 26 years.
In the present study, tibial length was strongly corre-lated with height in both males and females (P < 0.05). The correlation coefficient (R) between height and tibial length in males were 0.634 and 0.632 for right and left tibial lengths respectively. The correlation coefficient (R) between height and tibial length in females were also 0.259 and 0.258 for the right and left tibial lengths respectively. This finding is supported by a study con-ducted on 540 students (270 males and 270 females) in the age group 18 to 21 years in Madhya Pradesh (Trivedi et al. 2014). In this study, it was also reported that the correlation coefficients (R) between the height and tibial lengths in males were 0.417 and 0.442 for the right and left tibial lengths respectively and in females were 0.570 and 0.604 for right and left tibial lengths respectively.
A similar study was also carried out by Mehta et al. (2015a) on 80 adults (40 males and 40 females) in the age group 18 to 30 years in central India (Mehta et al. 2015b). This study concluded that there was a strong correlation between the height and tibial length in both sexes with R= 0.886 and R= 0.864 for the right tibial length and left tibial length respectively. These study findings agree with the findings of the current study in which the tibial length was strongly correlated with height in males (R= 0.634, R= 0.632) and in females
(R= 0.259,R= 0.258) for the right and left tibial lengths respectively.
However, there was a difference in the strength of association between the tibial length and height in this study and the current study. This is maybe due to the differences in sample size, measuring instruments, and age group in the two studies.
In the present study, significant difference was observed in the length of the right and left tibia which disagrees with the study of Mehta et al. (2015a). This is maybe due to differences in sample size, measuring instruments, and age group in the two studies.
In the current study, the variation of height depicted due to tibial length was 40.2% in males (R= 0.634, R2= 0.402) and 6.7% in females (R= 0.259, R2= 0.067). How-ever, a study conducted by Khatun et al. (2016) on 400 students (200 males and 200 females) in the age group 17 to 24 years in India (Khatun et al.2016) reported that the height variation due to tibial length was 74 % in males (R= 0.86,R2= 0.74 ) and 72% in females (R= 0.85, R2
= 0.72 ). This variation difference in height due to tib-ial length may be explained by differences in genetic and environmental factors like nutrition and climate in the two study populations
In the present study, multiple linear regression models were relatively better predictors of stature than simple linear regression models in both males and females. This finding agrees with a study conducted by Khanapurkar and Radke (2012) on 1000 students (536 males and 464 females) in the age group 19 to 22 years in Maharashtra which concluded that multiple linear regression equa-tions were better predictors of stature than simple linear regression equations.
In the present study, gender differences in mean values of height and percutaneous tibial length were signifi-cantly greater in males than that of females (P < 0.05). Table 4Estimation of height from percutaneous tibial length of male participants
Parameters (cm) R R2 AdjustedR2 SEE Regression equations Sig.
RT tibial length .634 .402 .400 4.56 125.93 + 1.15 RTL .001
LT tibial length .632 .399 .397 4.57 125.93 + 1.14 LTL .001
RTL-LTL .641 .410 .406 4.54 126.89 + 7.70 RTL +−6.58 LTL .001
Rcorrelation coefficient,R2
coefficient of determination,SEEstandard error of estimate,Sig.significance atP< 0.05,RTright,LTleft,RTLright tibial length,LTLleft tibial length,cmcentimeter
Table 5Estimation of height from percutaneous tibial length of female participants
Parameters (cm) R R2 AdjustedR2 SEE Regression equations Sig.
RT tibial length .259 .067 .064 3.88 154.48 + 0.31 RTL .001
LT tibial length .258 .066 .063 3.89 154.49 + 0.31 LTL .001
RTL-LTL .263 .069 .062 3.89 154.76 + 2.69 RTL +−2.39 LTL .001
Rcorrelation coefficient,R2
coefficient of determination,SEEstandard error of estimate,Sig.significance atP< 0.05,RTLright tibial length,LTLleft tibial length,RT right,LTleft,cmcentimeter
Fig. 4Scatter plot between body height and right tibial length for both sexes
Fig. 5Scatter plot between body height and left tibial length for both sexes
Table 6Paired samplettest to see existence of mean difference between actual and estimated height of male participants
Parameters (cm)
Actual mean Ht ± SD
Estimated mean Ht ± SD
MD SED 95% CI T Sig.
Lower Upper
RT tibial length 168.36 ± 5.89 168.346 ± 3.73 .012 .269 −.5174 .543 .048 .962
Table 7Paired samplettest to see existence of mean difference between actual and estimated height of female participants
Parameters (cm)
Actual mean Ht ± SD
Estimated mean Ht ± SD
MD SEE 95% CI T Sig.
Lower Upper
RT tibial length 165.24 ± 4.01 165.221 ± 1.03 .017 .229 −.434 .468 .075 .940
LT tibial length 165.24 ± 4.01 165.241 ± 1.03 −.002 .229 −.454 .448 −.012 .990 Htheight,SDstandard deviation,MDmean difference,SEDstandard error of difference,CIconfidence interval,Tt-statistics,Sig.level of significance,cm centimeter,RTright,LTleft
Fig. 6Residual plot of body height and right tibial length in males
Fig. 7Residual plot of body height and right tibial length in females
This finding is similar to the findings of studies con-ducted by Nemade et al. (2015), Anam et al. (2014), and Khanapurkar and Radke (2012).
Conclusion
Both the right and left percutaneous tibial lengths were significantly correlated with the height in both sexes (P < 0.05). It was strongly correlated with the height in the case of males than that of females. The mean value of percutaneous tibial length was higher in males than that of females, and this gender difference was statisti-cally significant (P < 0.05). Regression models were formulated from the percutaneous tibial length to predict the height of an individual.
Abbreviations
DMU:Debre Markos University; Ht: Height; LTL: Left tibial length; RTL: Right tibial length
Acknowledgements
I am gratefully thankful to the Ethiopian Public Health Research Institute, Department of Nutrition, and Debre Markos University, Department of Nursing, for their permission to use their stadiometer and measuring tape meter. Finally, I would like to express my great thanks to all respondents for their willingness to participate in the study.
Author’s contributions
The author conceived and designed the study and performed the analysis and interpretation of data. The author read and approved the final manuscript.
Funding
Not applicable.
Availability of data and materials
The data set will not be shared in order to protect the participants’identities.
Ethics approval and consent to participate
Permission was obtained from research directorate office of Debre Markos University. Participants were also informed well about the nature of the study and verbal consent was taken from each participant.
Consent for publication
Not applicable
Competing interests
No conflict of interest.
Received: 21 March 2019 Accepted: 3 September 2019
References
Agnihotri AK, Purwar B, Googoolye K, Agnihotri S, Jeebun N (2007) Estimation of stature by foot length. Journal of forensic and legal medicine14(5):279–283 Anam E, Patel M, Phatak A, Kumar L, Agarwal SS (2014) Estimation of stature from
inter-acromial length in Western Indian population: a pilot study. Journal of Indian Academy of Forensic Medicine36(1):31–33
Anirban D, Arindam B, Prithviraj K (2013) Estimation of stature of Eastern Indians from measurements of tibial length. Anatom. Physiol3(1):2161–0940.1000115 Arif M, Rasool SH, Chaudhary MK, Shakeel Z (2018) Estimation of stature; upper
arm length-a reliable predictor of stature. Professional Medical Journal25(11) Ghanbari K, Nazari AR, Ghanbari A, Chehrei S (2016) Stature estimation and
formulation of based on ulna length in Kurdish racial subgroup. Italian Journal of Anatomy and Embryology121(1):43–50
Ibegbu A, David E, Hamman W, Umana U, Musa S (2015) Hand length as a determinat of height in school children. Adv. Life Sci5:12–17
Khanapurkar S, Radke A (2012) Estimation of stature from the measurement of foot length, hand length and head length in Maharashtra region. Indian J Basic Appl Med Res1(2):77–85
Khatun SS, Sharma N, Jain SK, Gupta A (2016) Estimation of stature from percutaneous tibial length in Indian population. Int J Anat Res4(3):2571–2576 Mehta, A. A., A. A. Mehta, V. Gajbhiye and S. Verma (2015a).“Correlation of
percutaneous tibial length with body height and estimation of stature in living Central India population.”
Mehta AA, Mehta AA, Gajbhiye VM, Verma S (2015b) Correlation of percutaneous tibial length with body height and estimation of stature in living Central India population. International Journal of Anatomy and Research3(2):1159–1161 Mondal MK, Jana TK, Das J, Biswas S (2009) Use of length of ulna for estimation
of stature in living adult male in Burdwan district and adjacent areas of West Bengal. J Anat Soc India58(1):16–18
Nemade P, Ambiye M, Nemade A (2015) Regression analysis on stature estimation from cephalic dimensions. Int. J. Appl. Basic Med. Res4:298–312 Song-in K, Riengrojpitak S, Tiensuwan M (2013) Estimation of stature from
forearm length in Thai children. Journal of Food Health and Bioenvironmental Science6(1):131–140
Trivedi A, Saxena S, Morya R, Jehan M, Bhadkaria V (2014) Stature estimation using percutaneous tibial length in people of Gwalior region. IOSR J Dent Med Sci13(5):65–70
Trotter M, Gleser GC (1952) Estimation of stature from long bones of American Whites and Negroes. American journal of physical anthropology10(4):463–514 Ukoha UU, Umeasalugo KE, Udemezue OO, Asomugha LA (2016) Estimation of
stature from cephalic dimensions in a Nigerian population. Estimación de la estatura por las dimensiones cefálicas en una población nigeriana. Revista Argentina de Anatomía Clínica7(1):17–25
Wankhede KP, Anjankar VP, Parchand MP, Kamdi N, Patil ST (2015) Estimation of stature from head length and head breadth in Central Indian population: an anthropometric study. Int. J. Anat. Res3:954–957
Publisher’s Note