ReseaRch aRticle
C
ORROBORATINGE
VIDENCE OF AP
RE-E
URO-A
MERICANL
OW- TOM
ODERATE-S
EVERITYF
IRER
EGIME INY
ELLOWP
INE–M
IXEDC
ONIFERF
ORESTS OF THES
IERRAN
EVADA,C
ALIFORNIA,USA
Jay D. Miller1* and Hugh D. Safford2,3
1 USDA Forest Service, Pacific Southwest Region, Fire and Aviation Management, 3237 Peacekeeper Way, Suite 101, McClellan, California 95652, USA
2 USDA Forest Service, Pacific Southwest Region, 1323 Club Drive, Vallejo, California 94592, USA
3 Department of Environmental Science and Policy, University of California, One Shields Avenue, 1023 Wickson Hall, Davis,California 95616, USA
*Corresponding author: Tel.: +1-916-640-1603; e-mail: jaymiller@fs.fed.us
ABSTRACT
Fire was the dominant ecological pro-cess controlling forest structure and succession in western North American conifer forests for thousands of years. Because fires are now suppressed, and because widespread logging has great-ly altered vegetation structure, land managers often use estimates of pre-Euro-American settlement forest conditions to help guide restoration actions. It follows that it is important to fully understand the characteristics of pre-Euro-American settlement fire regimes. Percentages of high-severity fire, fire rotation period, and propor-tions of early, mid, and late develop-mental forests are intricately and inex-tricably linked. Early twentieth cen-tury vegetation maps that appear to reflect aspects of pre-settlement forest conditions demonstrate that large patches of montane chaparral, which is often an early seral community in yellow pine-mixed conifer forests, were mostly restricted to steep south-facing canyon slopes at higher
RESUMEN
ele-elevations associated with fir or sub-alpine forests. When resampled to a 16 ha minimum mapping unit, we found that an early twentieth century vegetation map shows montane chap-arral occupied only about five percent of the landscape outside of areas that were highly impacted by gold rush era mining. We found that succes-sional modeling suggests that similar levels (7 %) of high severity per fire in pre-settlement yellow pine-mixed co-nifer forests in the Sierra Nevada would permit about half of the forest-ed area to reach late development state, consistent with other estimated amounts of pre-settlement old-growth forests. In contrast, we found that high levels (30 %) of high severity per fire—the current average—would re-sult in only about 13 % of forests in a late development state. We do not see evidence that large proportions of high-severity fire were typical during pre-settlement fires in yellow pine-mixed conifer forests in our study area.
vaciones altas, asociadas a abetos o bosques subalpinos. Cuando re-muestreamos una uni-dad mínima de mapeo equivalente a 16 ha, en-contramos que un mapa de vegetación de prin-cipios del siglo XX muestra que el chaparral montano ocupaba solo el 5 % del paisaje por fuera de las áreas que habían sido altamente impactadas por la minería desarrollada durante la era correspondiente a la fiebre del oro. En-contramos que el modelado successional sugie-re que psugie-revio a la colonización europea, simi-lares niveles (7 %) de alta severidad de cada fuego en bosques mixtos de pino amarillo, per-mitiría que casi la mitad del área boscosa llega-ra al último estadio de desarrollo sellega-ral, lo que es consistente con otras estimaciones de abun-dancia de bosques maduros en el período pre-vio a la colonización. En contraste con esto, encontramos que altos niveles de severidad (30 %) de cada fuego (el promedio actual) re-sultaría en que solo el 13 % de los bosques lle-guen al estado de desarrollo seral maduro. No encontramos evidencia de que grandes propor-ciones de incendios altamente severos fuesen típicos durante el período previo a la coloniza-ción en bosques de pino amarillo in nuestra área de estudio.
Keywords: California, fire severity, mixed conifer, pre-settlement, Sierra Nevada, southern Cas-cades, succession, yellow pine
Citation: Miller, J.D., and H.D. Safford. 2017. Corroborating evidence of a pre-Euro-American low- to moderate-severity fire regime in yellow pine-mixed conifer forests of the Sierra Nevada, California, USA. Fire Ecology 13(1): 58–90. doi: 10.4996/fireecology.1301058
INTRODUCTION
In many ecosystems throughout the west-ern USA, fire is the key ecological process in-fluencing, among other things, forest structure, wildlife and plant habitat, and subsequent fire behavior (Pyne 1982, Sugihara et al. 2006a). Because fire has been excluded from most of these ecosystems for the last century, land managers often use estimates of pre-Eu-ro-American settlement fire regimes and forest conditions to help develop forest restoration
goals (Landres et al. 1999, North et al. 2009, Long et al. 2014). Since little is known about how a changing climate and projected increas-es in fire activity will affect future speciincreas-es dis-tributions and forest structures, specific resto-ration targets based solely upon restoring and maintaining historical conditions may be inap-propriate (Millar et al. 2007, Halofsky et al.
dy-namics that may permit predictions of future conditions (Swetnam et al. 1999; Fulé 2008; Safford et al. 2012a, b).
Sugihara et al. (2006a) described seven fundamental attributes of a fire regime: sea-sonality, fire frequency (or its inverse, fire re-turn interval [FRI]), fire size, spatial complexi-ty (e.g., high-severicomplexi-ty patch size and distribu-tion), intensity, severity, and fire type (i.e., sur-face, passive crown, active crown, or indepen-dent crown). Fire frequency (fire rotation, de-fined as the time needed for an area the size of the study area to burn, is the areal equivalent) and either fire type or severity (as a surrogate for intensity) are often used by ecologists to characterize different fire regimes (e.g., fre-quent, low severity; infrefre-quent, high severity; etc.) as they are relatively easily measured, and their relationship is broadly inverse and fairly well understood (Heinselman 1978, Har-dy et al. 2001, Steel et al. 2015).
One of the most profound effects of Eu-ro-American settlement in California was the near extinction of fire as an ecological process, beginning with the decimation of the Native American population in the nineteenth centu-ry, and followed by a policy of fire exclusion in the early twentieth century (Cook 1978, Kil-gore and Taylor 1979, Anderson 2005, Ste-phens et al. 2007, Mallek et al. 2013). In the last few decades, there has been an increase in the amount of high-severity fire observed in some of these California forests (Miller et al.
2009, Miller and Safford 2012, Mallek et al.
2013, Stephens et al. 2016), and the evidence is strong that this trend is driven by an interac-tion between the warming climate and forest fuel accumulations resulting from the long-term absence of fire (Safford and Van de Water 2014, Steel et al. 2015, Safford and Stevens 2017). In California, the trend of increasing fire severity is most strongly seen in yellow pine and mixed conifer forest types in the Sier-ra Nevada, which historically supported fire regimes of very frequent, mostly lower-severi-ty fire (van Wagtendonk et al. 2017,
Fites-Kaufman et al. 2007, Van de Water and Saf-ford 2011).
Yellow pine forests in California are char-acterized by the occurrence of one or both of the yellow pine species: ponderosa pine (Pinus ponderosa Lawson & C. Lawson) and Jeffrey pine (P. jeffreyi Balf.). Many other tree spe-cies overlap the geographic distribution of yel-low pine in California, including sugar pine (P. lambertiana Douglas), white fir (Abies concol-or [Gord. & Glend.] Lindl. ex Hildebr.), in-cense-cedar (Calocedrus decurrens [Torr.] Florin), Douglas-fir (Pseudotsuga menziesii
[Mirb.] Franco) and black oak (Quercus kel-loggii Newberry) (Sawyer et al. 2008). Diffi-culties in differentiating obvious forest types have led to the general recognition of a mixed conifer type (e.g., Fites-Kaufman et al. 2007). Yellow pine-mixed conifer (YPMC) forests are the focus of much attention in California because: (1) they are the most widespread for-est type on land managed by the federal re-source agencies; (2) they support most of the habitat for several old-forest obligate carni-vores and raptors, whose declining populations are of conservation concern; and (3) they in-clude a majority of the wildland urban inter-face (USDA 2004, Zielinski et al. 2013, Tem-pel et al. 2014). The preponderance of exist-ing literature describes YPMC forests in Cali-fornia to have historically supported fire re-gimes characterized by frequent low- to mod-erate-severity fires that maintained a heteroge-neous uneven-aged forest structure with large fire-resistant trees by opening small canopy gaps and thinning out most regenerating trees (see Safford and Stevens 2017 for a summary). However, fire frequency and patterns of sever-ity varied due to factors such as topographic position and complexity, and site water bal-ance (Beaty and Taylor 2001, Long et al. 2014, Kane et al. 2015).
previously resulted in extensive amounts of high-severity fire and high-severity patch sizes similar to modern fires. These authors reached their conclusions by comparing estimates of modern high-severity fire rotations to pre-set-tlement fire rotations calculated from fires that occurred during the California Gold Rush era (e.g., Leiberg 1902) or through the use of methods that are based upon an assumption that tree establishment is primarily linked to high-severity fire. These methods are prob-lematic for several reasons. First, effects of fires caused by California Gold Rush era activ-ities did not necessarily represent the pre-set-tlement fire regime (Safford and Stevens 2017). Second, tree establishment in dry for-ests is more closely linked to periodic wet epi-sodes or longer fire-free periods (Fulé et al.
2014). Finally, comparing high-severity rota-tions does not answer the question of how fire behavior differs in individual modern fires, on average, compared with pre-settlement fires. The difference between the two questions is important. The average proportion of high se-verity per fire is typically used as a description of the fire regime (Sugihara et al. 2006a). Pro-portion of high severity per fire is important because it is related to high-severity patch size (van Wagtendonk and Lutz 2007). In Sierra Nevada YPMC forests, high-severity patches often result in early seral shrub patches, which subsequently nearly always burn at high sever-ity (van Wagtendonk 2012, van Wagtendonk et al. 2012). It is the average proportion of high severity, therefore, that, when coupled with fire rotation, describes how fire would have driven high-severity patch size, subsequent successional patterns, and the amount of young and old forests that could exist on a landscape (Sugihara et al. 2006a).
In this manuscript, we investigate underex-ploited data sources to provide insight into the amount of high-severity burning that charac-terized the average pre-settlement fire. These include late nineteenth and early twentieth century accounts and datasets, as well as
con-temporary forest dynamics modeling. Ac-counts and data from near the turn of the twen-tieth century are valuable because (1) at that time, FRIs were likely still within or near their long-term range of variability (Van de Water and Safford 2011); and (2) because it can take many decades for forests to reestablish in se-verely burned areas, these early sources from areas relatively less impacted by Euro-Ameri-can settlement activities may also contain use-ful insights about pre-settlement rates of high-severity fire (Wilken 1967, Russell et al.
1998, Nagel and Taylor 2005, Knapp et al.
2013). Based on these and other data sources, modeling efforts can be used to develop mech-anistic models of forest and fire dynamics that can provide insight into the amount of young versus old forest conditions that would likely result from different scenarios of fire frequen-cy and severity (Swetnam and Brown 2010).
We use these early accounts and datasets to ask the following questions. First, how does the amount of early seral vegetation in early twentieth century vegetation maps in areas highly impacted by California Gold Rush ac-tivities compare with areas that were less im-pacted? And how do the early twentieth cen-tury vegetation maps compare with late twen-tieth century maps? Second, using state-and-transition simulations, we compare proportions of early, mid, and late develop-ment mixed conifer forests that would result from two different proportions of fire severi-ties representing the best estimates for the pre-settlement regime and the modern regime, retaining well-established pre-settlement FRIs in both cases.
METHODS
Study Area
Ser-vice managed lands within the SNFPA bound-ary. This region is approximately the area as-sessed by the Sierra Nevada Ecosystem Proj-ect (SNEP) and is often called the SNEP area (Figure 1). The SNEP study area consists pri-marily of the Sierra Nevada, but also includes the Modoc Plateau and Warner Mountains, the White-Inyo Mountains, and portions of the southern Cascades. Because the original Wi-eslander vegetation-type maps (VTM, de-scribed below) that we used were created by drawing polygons directly on United States Geological Survey (USGS) quadrangle map sheets (Kelly and Allen-Diaz 2005) that do not conform to the SNEP boundary, we restricted most of our analyses to the least common de-nominator boundary defined by the VTM, na-tional parks, and nana-tional forests (NF) in the Forest Service’s Pacific Southwest Region that intersect the SNEP area (Figure 2).
Our study focused primarily on two coni-fer-dominated forest types in the study region: yellow pine forests and woodlands dominated by ponderosa pine or Jeffrey pine, and mixed conifer forests with three or more co-dominant conifer species, including various mixtures of ponderosa pine, Jeffrey pine, sugar pine, white fir, incencedar, Douglas-fir, and giant se-quoia (Sequoiadendron giganteum [Lindl.] J. Buchholz), plus hardwoods such as black oak, canyon live oak (Quercus chrysolepis Liebm.), interior live oak (Q. wislizenii A. DC.), and tan oak (Notholithocarpus densiflorus [Hook. & Arn.]). Sawyer et al. (2008) describe almost 20 forest alliances that make up the montane mixed conifer forest, but, for this study, we follow common practice (e.g., Barbour et al.
2007, Steel et al. 2015, Safford and Stevens 2017) and treat mixed conifer forests as a sin-gle type. The lower elevation of ponderosa pine dominated forests is 300 m to 400 m in the northern portion of the study area and in-creases to over 1000 m in the southern Sierra Nevada, but also depends upon aspect, soil depth, etc. (Storer and Utsinger 1963, Fites-Kaufman et al. 2007). Jeffrey pine dominated
forests occur mostly between 1500 m and 2400 m in the northern subregion, and from 1700 m to 2800 m in the southern Sierra Neva-da (Barbour and Minnich 2000, Fites-Kaufman
et al. 2007). A large area east of the Sierra Ne-vada crest supports a mixed yellow pine forest co-dominated by ponderosa and Jeffrey pine, commonly referred to as eastside pine. The upper elevation of yellow pine and lower ele-vation of mixed conifer overlap. At the upper elevational limit of mixed conifer (1700 m to 2200 m in elevation, depending on latitude), red fir (A. magnifica A. Murray bis), western white pine (Pinus monticola Douglas ex D. Don), and lodgepole pine (Pinus contorta
Douglas ex Loudon) can be found (Safford and Stevens 2017).
We combine yellow pine and mixed coni-fer forests in this study for two reasons. First, under most ecological circumstances, they are successionally related (Safford and Stevens 2017). Historically, frequent fire that usually burned at low to moderate severity led to the maintenance of yellow pine dominated stands, primarily found in relatively more xeric topo-graphic settings, by removing more fire sensi-tive shade tolerant fir and cedar species. Mixed conifer forests would have had slightly longer fire return intervals and would have oc-curred in more mesic settings. Over the last century, yellow pine forests have become rare on the west side of the Sierra Nevada due to logging and fire suppression-driven succession to mixed conifer stands dominated by more shade tolerant and fire intolerant species like white fir and incense-cedar (Parsons and De-Benedetti 1979, North et al. 2007, Thorne et al. 2008, Scholl and Taylor 2010). Second, other than the slightly different fire return in-tervals, yellow pine and mixed conifer forests in California have very similar fire regime characteristics (Weaver 1974, Sugihara et al.
2006b, Van de Water and Safford 2011, Saf-ford and Stevens 2017).
of severe disturbance in YPMC forests (e.g., logging, fire, or erosion; Risser and Fry 1988, Kaufmann and Martin 1991). Montane chap-arral is composed of one or more shrub species such as deerbrush (Ceanothus integerrimus
Hook. & Arn.), mountain whitethorn ( Cean-othus cordulatus Kellogg), snowbrush cean-othus (C. velutinus Douglas ex Hook.), or greenleaf manzanita (Arctostaphylos patula
Greene). After severe fire, montane chaparral may delay conifer establishment for many de-cades, and it may persist for centuries in the event of recurrent fires (Wilken 1967, Pinder
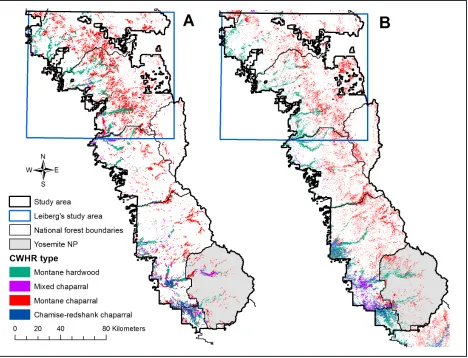
et al. 1997, Taylor and Skinner 2003, Nagel and Taylor 2005, Lauvaux et al. 2016). In some cases, montane chaparral can also form an edaphic quasi-climax community on shal-low, low productivity soils (Risser and Fry 1988), but these sites can also succeed to coni-fer over a longer time frame. Montane chapar-ral occurs throughout the range of YPMC for-ests and should not be confused with other, lower elevation chaparral types dominated by shrub species that are not typically seral to co-nifer forest (e.g., chamise [Adenostoma fascic-ulatum Hook. & Arn.], buckbrush [Ceanothus Figure 2. Major conifer vegetation types in the early and late twentieth century A) Wieslander vegetation type map (VTM) (Thorne et al. 2006, Thorne et al. 2008), and B) existing vegetation (CALVEG)
(Kee-ler-Wolf 2007) circa 2000 to 2009 (online at
cuneatus {Hook.} Nutt.], toyon [Heteromeles arbutifolia], silk tassel bush [Garrya spp.], chaparral pea [Pickeringia montana Nutt.], or
shrub oaks like Q. berberidifolia Liebm.). These lower elevation chaparral types are probably best viewed as climax vegetation types, and tend to occur on drier sites with thin soils; at higher elevations, they are often re-stricted to steep south and west facing canyon slopes (England 1988a, b; Risser and Fry 1988).
Background on Late Nineteenth and Early Twentieth Century Accounts and Datasets
After the establishment of the federal For-est Reserves, beginning in 1891, the USGS and Forest Service produced a series of reports that inventoried and described merchantable timber. Most of the surveys conducted in Cal-ifornia provide at least qualitative information on fire effects that can be used to infer severity (Fitch 1900a, b; Sudworth 1900; Cooper 1906; Larson and Woodbury 1916; Figure 1). Leiberg (1902) includes several maps detailing areas burned for a portion of the northern Sier-ra Nevada that have been used by some re-searchers as evidence of extensive pre-settle-ment high-severity fire (e.g., Baker 2014, 2015; Odion et al. 2014). Leiberg’s study area encompassed not only YPMC forests but also upper montane forests dominated by red fir. The elevational boundary between mixed co-nifer and red fir forests in the Sierra Nevada coincides with a major ecological transition zone that corresponds to the approximate ele-vation of freezing in mid-winter storms, and the transition from rain-dominated to snow-dominated climate regimes (Safford and Van de Water 2014). Like yellow pine, pre-settlement mixed conifer forests in Cali-fornia were largely “fuel-limited” and charac-terized by frequent, lower-severity wildfires, whereas red fir forests were more “cli-mate-limited” and thus characterized by less frequent, more severe wildfires (Barbour et al.
2002, Sugihara and Barbour 2006, Barbour et al. 2007, Safford and Van de Water 2014, Steel
et al. 2015). Leiberg’s study area had also been highly impacted by California Gold Rush era logging, mining, and grazing activities. In-deed, nearly all the major gold veins that occur on Forest Service lands in the Sierra Nevada are in Leiberg’s study area (Figure 1). For-ty-six out of 49 of the largest-scale hydraulic mining operations in the Sierra Nevada were found in Butte, Plumas, Yuba, Sierra, Nevada, and Placer counties, which comprise the ma-jority of Leiberg’s study area (Clark 1970). Logging activities prior to 1900 were not all well documented; however, existing records indicate that they were mostly associated with mining activities or supported development of local settlements (McKelvey and Johnston 1992, Beesley 1996). Leiberg (1902) reported that 44 % of forests in his study area had been affected by some degree of logging, compared with 21 % of Sudworth’s study area (Sudworth 1900). Fitch (1900a, b) reported that there was not any logging activity in his study areas at the time of his surveys; however, at least some logging had occurred earlier (Hurt 1941). In summary, impacts from mining and logging at the time of the surveys had been far greater in northern Sierra Nevada compared with the central and southern Sierra Nevada (Clark 1970, Beesley 1996, Gruell 2001).
In the early twentieth century, the USDA Forest Service published a series of reports that supported the imposition of a full fire ex-clusion policy. The reports provide the most detailed broad scale summary information on vegetation and fire effects in pine dominated forests produced up until that time for Califor-nia, including information on number of igni-tions, ignition sources, and fire sizes (Show and Kotok 1923); fire statistics stratified by vegetation type (Show and Kotok 1929); and tree mortality due to fire (Show and Kotok 1924, 1925).
Albert Wieslander developed the first compre-hensive vegetation map for portions of Cali-fornia (Wieslander 1935a, b). Beginning in 1928 and continuing up until World War II, the project surveyed over 17 000 vegetation plots and mapped the vegetation for approximately 35 % of the state and about 60 % of Forest Ser-vice lands, including the areas surveyed by Leiberg, Sudworth, and Fitch (online at http:// vtm.berkeley.edu). The vegetation maps vide the extent (polygons) and the plots pro-vide composition and structure. The maps were created by surveyors by drawing poly-gons directly onto USGS topographic maps. Plots were then established within the poly-gons to measure representative conditions (Wieslander 1935a). The plot data have most often been used to contrast early and late twen-tieth century forest conditions (e.g., Dolanc et al. 2013, 2014). The map data have only been infrequently used to this point, but the map sheets were recently digitized and georefer-enced, and vegetation types crosswalked to equivalent types in late twentieth century maps (Thorne et al. 2006, 2008). As a result, the map data are now usable for spatial analysis and can be used to provide broad-scale spatial estimates of vegetation-type cover.
Limitations of Early Accounts and Datasets
When extrapolating information presented in late nineteenth and early twentieth century reports and datasets to pre-settlement forests, it is important to understand that changes in ignition patterns, and extensive mining, log-ging, and grazing had already begun to trans-form the conifer forests of California when these data were collected and reports written. Lightning ignition patterns likely did not sub-stantially change between pre-settlement times and the early twentieth century, but human ig-nition patterns undoubtedly did. The occur-rence of lightning strikes decreases from east to west, and is low in the western foothills and lower slopes of the Sierra Nevada where
Na-tive American populations were densest (Cook 1978, van Wagtendonk and Cayan 2008). There is disagreement among researchers as to the extent of the impact of Native American ignitions on the Sierra Nevada landscape (Parker 2003), but the high pre-Euro-Ameri-can settlement fire frequencies seen in oak woodlands and lower elevation conifer forests in the Sierra Nevada were likely due in part to Native American practice. In at least some lo-cations, there is evidence that ignitions by Na-tive Americans associated with foraging prac-tices played a role in reducing surface fuels and thinning lower to middle elevation mixed conifer and pine forests (Reynolds 1959, An-derson 2005, Morgan 2008). Historical ac-counts indicate that many fires ignited by Na-tive Americans were ignited in the fall when negative impacts to food resources would be minimized (Anderson 2005, Morgan 2008). In contrast, most human ignited fires during the early part of the twentieth century occurred in July and August when there is a higher risk of escaping control and extreme fire behavior (Show and Kotok 1923). Ignitions by Native Americans had largely been eliminated by the mid 1800s as the Native American population had been reduced by >80 % by 1855, and most of the remaining population removed to reser-vations (Cook 1978, Kilgore and Taylor 1979, Dutschke 1988).
stud-ies show a dramatic decrease in fires after about 1900 throughout the Sierra Nevada (Kil-gore and Taylor 1979, Caprio and Swetnam 1995, Taylor 2000, Collins and Stephens 2007, Scholl and Taylor 2010).
Vegetation Data
We used two spatial vegetation datasets in this study: 1) Wieslander VTM , and 2) the most recent version of the Forest Service CALVEG (Classification and Assessment with Landsat of Visible Ecological Groupings) ex-isting vegetation maps.
The VTM from the 1930s is the earliest comprehensive vegetation map for California (Barbour and Major 1988). Recently, the VTM map sheets covering a contiguous 30 236 km2 area of the Sierra Nevada, stretching from the southern half of the Plumas NF south through Yosemite National Park (NP), were digitized and the VTM vegetation types were crosswalked to the California Wildlife Habitat Relationship (CWHR) types (Mayer and Laudenslayer 1988; Thorne et al. 2006, 2008; Figure 2). Although there are map polygons smaller than 1 ha, the minimum mapping unit (MMU) was typically around 16 ha (Wi-eslander et al. 1933, Thorne et al. 2006).
Technically, CALVEG is a vegetation clas-sification scheme used by the Forest Service in California to map existing vegetation (Matyas and Parker 1980, Keeler-Wolf 2007, USDA 2014). However, we follow standard practice and also refer to the vegetation map data as CALVEG. The CALVEG MMU is considered to be approximately 1 hectare. We used the most recent CALVEG vegetation data with mapping dates 2000 to 2009 (USDA 2014). In addition to being labeled by CALVEG vegeta-tion type, map polygons are also labeled with CWHR type (Mayer and Laudenslayer 1988), which we used for our analyses to facilitate comparison with the VTM. We modified the CALVEG data where some forested areas on the Plumas NF that had been severely burned just prior to being mapped in 2000 were
mapped as barren. For this study, we counted those areas as early seral montane chaparral.
Analyses
Succession modeling. To estimate the pro-portion of young and old pre-settlement YPMC forests, we used the Vegetation Dy-namics Development Tool (VDDT; ESSA 2007). The VDDT is an aspatial, nonequilibri-um state-and-transition model (Stringham et al. 2003) that incorporates multiple ecosystem states linked by pathways representing deter-ministic and probabilistic transitions. The VDDT is a Monte Carlo simulator that uses random draws to determine the order and oc-currence of disturbances, which may then drive probabilistic transitions (ESSA 2007).
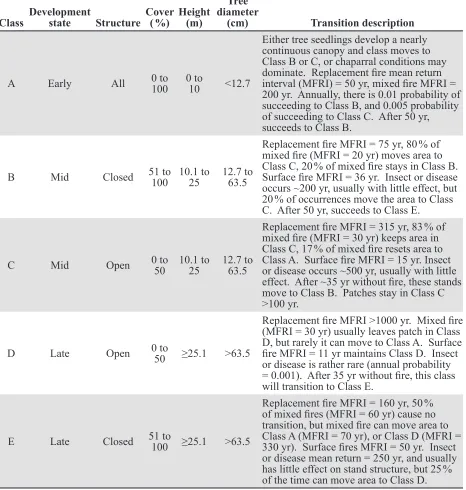
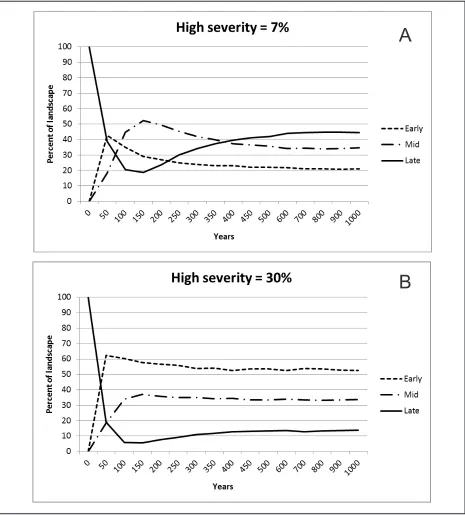
late in our manuscript to remain consistent. The VDDT state-and-transition models do not associate specific tree mortality thresholds with their fire effects terms. Surface fire usu-ally results in the mortality of few overstory trees, whereas replacement fire usually means sufficient tree mortality to convert forest to non-forest (i.e., tree canopy cover of <10 % [Brohman and Bryant 2005]). We therefore assumed, for the purpose of this manuscript, that the model’s fire effects terms equate to low, moderate, and high severity (surface, mixed, and replacement, respectively). Fire frequency and severity vary substantially among the five states (development stage-structure combination; Table 1), in the model, but the overall mean FRI is approxi-mately 11 years and the overall mean distribu-tion of high-, moderate-, and low-severity fire is 7:30:63. These FRI and fire severity values are very close to pre-settlement reference val-ues (e.g., Leiberg 1902, Van de Water and Saf-ford 2011, Rivera-Huerta et al. 2016, Safford and Stevens 2017). To contrast forest condi-tions resulting from a hypothetical situation that reflects the proportions of severity in mod-ern fires but retains all other aspects of the pre-settlement fire regime, we retained the structure of the 0610270 model, but propor-tionally and iteratively changed the fire transi-tion probabilities among states until the distri-bution of fire severities approximated 30:22:48 (high:moderate:low), the mean severity distri-bution of Sierra Nevada fires between 1984 and 2010 (Mallek et al. 2013). Hereafter, we refer to these two models as the pre-settlement and hypothetical models. We began each sim-ulation with 100 % of the landscape in a late development closed state (late seral, closed forest, with canopy cover >50 %). Both mod-els were run for 10 simulations of 1000 years each, using the pre-settlement FRI of 11 years. We plotted the average percentage of the mod-eled landscape in each of three development states: early, mid, and late over time.
RESULTS
Vegetation Data
The percentage of montane chaparral within Leiberg’s study area compared with outside was 2.4 times greater in the 1930s VTM map (12.0 % versus 5.0 %), but was only 1.2 times greater in modern CALVEG map (7.2 % versus 5.8 %; Table 2). Overall, the percentage of montane chaparral was 1.3 times greater in the VTM map than in CALVEG (8.2 % versus 6.5 %, respectively). However, the difference between VTM and CALVEG was largely restricted to Leiberg’s study area. The VTM chaparral cover was 1.7 times greater than CALVEG inside Leiberg’s study area (12.0 % versus 7.2 %, respectively) compared with 1.2 times less outside (5.0 % versus 5.8 %, respectively).
Most areas of montane chaparral in the VTM south of Leiberg’s study area correspond to steep south-facing canyon slopes at upper elevations associated with red fir and subal-pine conifer forests that match similar patches and locations in CALVEG (Figures 2 through 4; before resampling to 16 ha MMU, VTM mean, standard deviation, and maximum mon-tane chaparral patch size = 33.2 ha, 82.3 ha, and 1640.2 ha, respectively). Areas of mon-tane chaparral that appear in CALVEG but not the VTM are primarily due to recent fires or the smaller CALVEG minimum mapping unit of 1 ha versus 16 ha for the VTM (Figure 3). There are also minor differences due to dis-crepancies in areas mapped as hardwood ver-sus chaparral vegetation types.
the percentage of yellow pine and mixed coni-fer only slightly increased (57.5 % versus 59.5 %, respectively) (Table 2). The trends of decreasing yellow pine and increasing mixed conifer was consistent both inside and outside of Leiberg’s study area.
Succession Modeling
State-and-transition simulations, using the original LANDFIRE 0610270 VDDT model representing 7 % high severity (pre-settlement model), stabilized at around 700 years with Class Development state Structure Cover ( %) Height (m)
Tree diameter
(cm) Transition description
A Early All 0 to 100 0 to 10 <12.7
Either tree seedlings develop a nearly continuous canopy and class moves to Class B or C, or chaparral conditions may dominate. Replacement fire mean return interval (MFRI) = 50 yr, mixed fire MFRI = 200 yr. Annually, there is 0.01 probability of succeeding to Class B, and 0.005 probability of succeeding to Class C. After 50 yr, succeeds to Class B.
B Mid Closed 51 to 100 10.1 to25 12.7 to63.5
Replacement fire MFRI = 75 yr, 80 % of mixed fire (MFRI = 20 yr) moves area to Class C, 20 % of mixed fire stays in Class B. Surface fire MFRI = 36 yr. Insect or disease occurs ~200 yr, usually with little effect, but 20 % of occurrences move the area to Class C. After 50 yr, succeeds to Class E.
C Mid Open 0 to50 10.1 to25 12.7 to63.5
Replacement fire MFRI = 315 yr, 83 % of mixed fire (MFRI = 30 yr) keeps area in Class C, 17 % of mixed fire resets area to Class A. Surface fire MFRI = 15 yr. Insect or disease occurs ~500 yr, usually with little effect. After ~35 yr without fire, these stands move to Class B. Patches stay in Class C >100 yr.
D Late Open 0 to50 ≥25.1 >63.5
Replacement fire MFRI >1000 yr. Mixed fire (MFRI = 30 yr) usually leaves patch in Class D, but rarely it can move to Class A. Surface fire MFRI = 11 yr maintains Class D. Insect or disease is rather rare (annual probability = 0.001). After 35 yr without fire, this class will transition to Class E.
E Late Closed 51 to 100 ≥25.1 >63.5
Replacement fire MFRI = 160 yr, 50 % of mixed fires (MFRI = 60 yr) cause no transition, but mixed fire can move area to Class A (MFRI = 70 yr), or Class D (MFRI = 330 yr). Surface fires MFRI = 50 yr. Insect or disease mean return = 250 yr, and usually has little effect on stand structure, but 25 % of the time can move area to Class D.
California wildlife habitat
relationship (CWHR) type
Wieslander vegetation type
map (VTM) a
VTM for Leiberg’s study area a
VTM outside Leiberg’s
study area a CALVEG
a for Leiberg’s CALVEG study area a
CALVEG outside Leiberg’s study area a
ha % ha % ha % ha % ha % ha %
Annual grassland 11 888 0.6 5 808 0.7 6 080 0.6 20 976 1.1 8 464 1.0 12 512 1.2
Aspen 2 352 0.1 320 0.0 2 032 0.2 640 0.0 0 0.0 640 0.1
Bitterbrush 2 176 0.1 1 040 0.1 1 136 0.1 864 0.0 864 0.1 0 0.0
Blue
oak-foothill pine 8 992 0.5 1 296 0.1 7 696 0.7 1 984 0.1 448 0.1 1 536 0.2
Blue oak woodland 640 0.0 96 0.0 544 0.1 576 0.0 0 0.0 576 0.1
Chamise-redshank
chaparral 12 608 0.6 0 0.0 12 608 1.2 1 488 0.1 0 0.0 1 488 0.1
Closed-cone
pine-cypress 1 088 0.1 144 0.0 944 0.1 2 272 0.1 576 0.1 1 696 0.2
Douglas-fir 35 264 1.8 28 224 3.2 7 040 0.7 74 720 4.0 74 112 8.6 608 0.1
Eastside pine 33 664 1.7 16 464 1.8 17 200 1.6 70 688 3.8 70 096 8.1 592 0.1 Jeffrey pine 268 928 13.8 153 392 17.2 115 536 11.0 48 160 2.6 5 376 0.6 42 784 4.2
Juniper 6 720 0.3 464 0.1 6 256 0.6 10 960 0.6 128 0.0 10 832 1.1
Lodgepole pine 123 120 6.3 10 720 1.2 112 400 10.7 38 288 2.0 5 264 0.6 33 024 3.3
Low sage 3 184 0.2 2 416 0.3 768 0.1 160 0.0 112 0.0 48 0.0
Mixed chaparral 25 040 1.3 4 944 0.6 20 096 1.9 27 328 1.5 1 808 0.2 25 520 2.5 Montane chaparral 159 456 8.2 106 688 12.0 52 768 5.0 121 504 b 6.5 62 800 b 7.2 58 704 5.8
Montane
hardwood-conifer 736 0.0 144 0.0 592 0.1 47 392 2.5 28 368 3.3 19 024 1.9
Montane hardwood 86 192 4.4 48 304 5.4 37 888 3.6 126 416 6.7 41 488 4.8 84 928 8.4 Montane riparian 1 376 0.1 352 0.0 1 024 0.1 3 888 0.2 1 312 0.2 2 576 0.3
Perennial grassland 0 0.0 0 0.0 0 0.0 19 888 1.1 1 264 0.1 18 624 0.0
Ponderosa pine 245 088 12.6 58 752 6.6 186 336 17.7 81 568 4.3 15 872 1.8 65 696 6.5 Red fir 218 352 11.2 114 480 12.8 103 872 9.9 223 712 11.9 76 032 8.8 147 680 14.6
Sagebrush 27 456 1.4 18 896 2.1 8 560 0.8 25 328 1.3 24 544 2.8 784 0.1
Sierran mixed
conifer 412 336 21.2 235 552 26.4 176 784 16.8 736 832 39.2 355 264 41.0 381 568 37.7 Subalpine conifer 111 696 5.7 18 784 2.1 92 912 8.8 80 048 4.3 1 680 0.2 78 368 7.7
Wet meadow 23 520 1.2 6 240 0.7 17 280 1.6 6 432 0.3 1 200 0.1 5 232 0.5
White fir 122 016 6.3 57 744 6.5 64 272 6.1 105 808 5.6 89 328 10.3 16 480 1.6
Table 2. Comparison of the Wieslander VTM and CALVEG for Forest Service and National Park Service lands within the VTM study area delineated in Figures 2A and 3A.
a Although there are polygons <1 ha, the minimum mapping unit was typically about 16 ha (Wieslander et al. 1933, Thorne et al. 2006). Polygons were resampled to 400 m × 400 m pixels for comparing CALVEG to the VTM.
b Includes areas on the Plumas NF that burned at high severity but mapped in 2000 as barren in the 1999 Bean Creek,
mean proportions across the 10 model runs of YPMC forests in early, mid, and late develop-ment state of about 20 %, 35 %, and 45 %,
re-spectively (Figure 5A). The hypothetical model (30 % high severity) stabilized much earlier in the simulation at around 400 years,
A
B
with 2.7 times more early development, and 3.5 times less late development compared to the pre-settlement model (53 %, 34 %, and 13 % for early, mid, and late states, respective-ly; Figure 5B). Open forest conditions (<50 % canopy cover) were more common than closed conditions (>50 % canopy cover; results for open and closed conditions not shown). In the pre-settlement model, 5.6 times more of the landscape (mid and late combined) was in the open canopy versus closed canopy condition (67 % versus 12 %, respectively). The pre-set-tlement model had 1.9 times more open canopy forests than did the hypothetical model. Closed canopy conditions in the two models were sim-ilar (12 % versus 13 % for the pre-settlement and hypothetical models, respectively).
Discussion
Inferences from
Early Twentieth Century Maps
The 1930s VTM map appears to retain some characteristics of pre-settlement forests. Compared with the VTM, the modern CALVEG map shows a replacement of yellow pine by mixed conifer forests that corresponds to the post-suppression densification and infill by white fir and incense-cedar documented by numerous studies (Figure 2 and Table 2; e.g., Vankat and Major 1978, Beaty and Taylor 2007, North et al. 2007, Scholl and Taylor 2010, Taylor et al. 2014).
The percentage of early seral vegetation in the VTM may also provide hints as to the amount of high-severity fire that occurred pri-or to its creation, because montane chaparral, which is often early seral successional to coni-fer forests following severe fire, can persist for many decades in the absence of fire. However, chaparral patches can persist for centuries in the case of repeated fire (Wilken 1967, Risser and Fry 1988, Russell et al. 1998, Nagel and Taylor 2005, Collins and Stephens 2010). Therefore, it is not always possible to know
when fire originally converted forest to chap-arral and, without direct evidence of fire killed trees, mere evidence of recent fire is likely not indicative of a recent conversion of forest to chaparral. Furthermore, in some cases, mon-tane chaparral may persist due to edaphic and topographic factors, rather than repeat fire (Risser and Fry 1988).
Leiberg (1902), whose study area is entire-ly within the northern extent of the VTM (Fig-ures 2 and 3), recognized that many of the chaparral fields he mapped were likely due to fires ignited by miners:
The only older burns which give any clue to the age are those which stretch in a line from northwest to southeast through the central district of the region. They are marked by the occurrence of large tracts covered with chaparral. Most of these are situated contiguous to placer camps, worked from the earliest times, and might be regarded as having been burned over by fires spreading from such camps.
(Leiberg 1902: page 41)
The amount of montane chaparral in Leiberg’s study area was thus likely greater than in pre-settlement forests. This hypothesis is supported by the fact that the amount of montane chaparral in the VTM within Leiberg’s study area is >2.4 times than in the remainder of the VTM area (Table 2 and Fig-ure 3), which experienced much less late-nine-teenth century human disturbance.
mixed conifer, and white fir) outside Leiberg’s study area have burned at high severity through 2014 on National Park Service and Forest Service managed lands in our study area. It is therefore probable that the amount of montane chaparral outside Leiberg’s study area is currently greater than when the VTM was created.
The scale of the VTM (i.e., 16 ha MMU) is important when considering the amount of montane chaparral in pre-settlement forests. Under a frequent low- to moderate-severity fire regime, dry YPMC forests would have been less dense and more heterogeneous com-pared with modern forests, characterized by patches of trees, solitary trees, and abundant canopy gaps (Hessburg et al. 2005, Collins et al. 2011, Larson and Churchill 2012, Hag-mann et al. 2013, Fry et al. 2014). High-se-verity patches would have followed a power law distribution with many small patches and relatively few large patches (Perry et al. 2011). Groupings of similarly aged trees suggest that most canopy gaps resulting from high-severity fire (but also insects, drought, or disease) in the SNEP area were <1.0 ha (Bonnicksen and Stone 1982, Beaty and Taylor 2007, Scholl and Taylor 2010, Taylor 2010, Safford and Stevens 2017). Therefore, the amount of mon-tane chaparral in pre-settlement forests might be underestimated with a 16 ha MMU.
Inferences from Succession Modeling
Comparing the amount of montane chapar-ral in the VTM to the outputs of the state-and-transition simulations, there is much more similarity between the VTM and the VDDT pre-settlement model (early develop-ment vegetation = 20 % of the landscape), than the hypothetical model (early development vegetation = 53 % of the landscape; Figure 5). Considering only the YPMC CWHR types (eastside pine, Jeffrey pine, ponderosa pine, Douglas-fir, Sierran mixed conifer, and white fir), the percentage of montane chaparral in the
VTM (16 ha MMU) is 12.5 % (16.2 % for Leiberg’s study area, 8.5 % outside Leiberg’s study area; Table 2). We should note that there are some challenges in comparing the amount of early development state in the state-and-transition results with the VTM. First, the LANDFIRE 0610270 model that we used defines early development state to not only represent areas where trees are absent and early seral chaparral might dominate, but also areas dominated by small trees (<12.7 cm dbh). Although tree size information was col-lected in the vegetation plots, it was never at-tributed to the maps. Therefore, the VTM only exhibits vegetation type, and areas with young trees cannot be distinguished from mid or late development states. Second, since state-and-transition models are aspatial, there is no MMU.
The pre-settlement state-and-transition model resulted in about 45 % of YPMC forests in late development condition; this is at the low end of independent estimates in the litera-ture. For example, at the beginning of the twentieth century, Greeley (1907) estimated that 40 % to 65 % of trees in uncut yellow pine and mixed conifer forests were “decadent” or “mature,” referring to large trees that were no longer rapidly growing. The national parks contain the best examples of old forests in the SNEP area, although some areas were mini-mally impacted by logging in the late nine-teenth and early twentieth centuries (Beardsley
because of suppression polices, but there are also fewer trees >92 cm dbh (Parsons and De-Benedetti 1979, Taylor 2000, Lutz et al. 2009, Scholl and Taylor 2010). What is clear, though, is that the average of 30 % high severi-ty in modern YPMC fires would have been much too high to maintain more than a small area of old forest if it were typical of pre-set-tlement fire regimes.
In addition, the pre-settlement state-and-transition model appears to support the assess-ment that a majority of YPMC forests were of an open nature, as documented by early twen-tieth century surveys (Collins et al. 2011, 2015; Stephens et al. 2015).
Other Evidence for Low Levels of Fire-Caused Tree Mortality
Show and Kotok (1925) reported that re-peated enlargement of fire scars on individual trees (so-called “cat faces”) in the entire “Cali-fornia pine region” resulted in mortality of about 5 % of the merchantable timber (>30 cm dbh; but overall loss of timber volume because of trees with fire scars was 14 %). Show and
Kotok (1925) do not provide an estimate of timber lost due to crown fire. In an earlier re-port, however, Show and Kotok (1924) report-ed the volume of merchantable timber killreport-ed in several early twentieth century fires, including mortality from both direct heat and repeated surface fires that scarred and hollowed out tree trunks. Restricting Show and Kotok’s fires to those that occurred in the SNEP area, the ar-ea-weighted average volume of killed trees was 1562 board m ha-1 (Table 3)the
equiva-lent of one 91 cm dbh ponderosa pine tree ha-1
(conversion of merchantable volume in units of Scribner board meters to 91 cm dbh, basal area 0.66 m2 ha-1; McDonald and Skinner
1989: Table 1). Show and Kotok did not re-port average merchantable volume within each fire. However, most late nineteenth and early twentieth century inventories of unlogged for-ests in the Sierra Nevada show basal areas for merchantable timber mostly between about 16 m2 ha-1 and 50 m2 ha-1 (Scholl and Taylor 2010;
Taylor et al. 2014; Stephens et al. 2015; B.M. Collins, USDA Forest Service, Pacific South-west Research Station, Davis, California, USA, personal communication; E.E. Knapp,
Fire name National forest Fire size (ha) Fire scarred trees felled(board m ha-1) a Direct damage from heat(board m ha-1) b
Bear River Eldorado 202 181 29
Butler Meadow Eldorado 453 375 173
Ferris Creek Plumas 1876 2531
Ham Station Eldorado 3839 358 414
Lassen-Walker Lassen 89 2523
Pilot Creek Eldorado 154 3134 188
Quincy Junction Plumas 81 1582
Slate Mountain Eldorado 142 153 38
White Horse Modoc 8296 467 1198
Weighted average 455 1106
Table 3. Fires that occurred from 1911 to 1922 in the northern and central Sierra Nevada sampled for mortality of merchantable timber (data from Show and Kotok 1924).
a Includes trees that fell due to loss of structural integrity from the enlargement of fire scars created by repeated fires.
USDA Forest Service, Pacific Southwest Re-search Station, Redding, California, USA, per-sonal communication), although Sudworth re-ported plots with basal areas of 130 m2 ha-1 to
215 m2 ha-1 (University of California,
Biosci-ence and Natural Resources Library, Berkeley, USA, unpublished field note books of Sierra Nevada forest reserve inventory). The Sud-worth plots have been the source of much dis-cussion in the ecology literature, with the gen-eral consensus that Sudworth’s plots were pur-posely sited in the largest stands he could find (Stephens and Elliott-Fisk 1998, Stephens 2000, Baker 2014). Whatever the case, in Sudworth’s plots, Show and Kotok’s reported mortality would translate to ≤0.5 % of average basal area of merchantable timber, while in the other more representative stands, Show and Kotok’s measured mortality would have repre-sented between 1 % and 4 % of a stand (0.66 m2 ha-1 divided by 50 m2 ha-1 and 16 m2 ha-1, re
-spectively). Assuming that the later mortality rate is a conservative estimate of mortality throughout an entire fire, depending upon the spatial aggregation of the mortality of larger trees described by Show and Kotok, in modern terms it could be considered at the patch scale to be anywhere from low (i.e., one to a few trees killed within a matrix of surviving trees) to high severity (i.e., most to all trees killed in one contiguous patch) (Stephenson et al. 1991, Sugihara et al. 2006a, Perry et al. 2011).
A recent paper that examined early forest inventory data from the same time period as Show and Kotok’s reports provides additional evidence of low amounts of conifer mortality due to fire. Stephens et al. (2015) examined forest survey data (0.9 ha belt transects) col-lected circa 1911 covering 11 500 ha in the southern Sierra Nevada in an area that had not been logged. Assuming that areas of chaparral or dense immature timber reported by the sur-veyors were indicators of high-severity fire, Stephens et al. found that the proportion of the total landscape that burned at high severity was 1 % to 3 % in mixed conifer forests and
4 % to 6 % in ponderosa pine forests, which is much less than what our succession modeling predicts for the proportion of early seral in pre-settlement forests. It is likely that the sur-veys were conducted to inventory timber re-sources; however, the survey data included tal-lies for at least some trees that were not gener-ally included in merchantable timber surveys (<30.5 cm dbh), and similar survey data from the Stanislaus National Forest included tran-sects that were entirely chaparral (Collins et al. 2015).
Conifer mortality from fires in modern an-alog reference sites also support the supposi-tion that pre-settlement fires in our study area were predominately of low severity. The Sier-ra de San Pedro Mártir (SSPM) of northern Baja California, Mexico, is a modern reference site for drier Jeffrey pine-dominated YPMC forests in the eastern Sierra Nevada (Minnich
et al. 2000, Stephens and Fulé 2005, Dun-bar-Irwin and Safford 2016). The SSPM has never been logged, and fires have only been effectively suppressed since the 1980s (Ste-phens et al. 2003). As a result, forest struc-tures do not yet exhibit the levels of infill doc-umented in Sierra Nevada YPMC forests (Dunbar-Irwin and Safford 2016). A recent study shows that forest fires in the SSPM be-tween 1984 and 2010 burned only 3 % to 4 % of their area at high severity, and maximum high-severity patch sizes were at least an order of magnitude smaller than those typical of contemporary fires on Forest Service managed lands in the Sierra Nevada (Miller et al. 2012, Rivera-Huerta et al. 2016).
Contrary Evidence
vegetation or small trees to estimate high-se-verity fire rotation. However, the underlying assumption that tree regeneration in dry forests could only have arisen after high-severity fire is not well founded. In a critique of this as-sumption, Fulé et al. (2014) point out that tree regeneration in dry forests throughout the western US is spatially heterogeneous, often occurring in canopy gaps, and is more closely linked to periodic wet episodes or longer fire-free periods such as the twentieth century sup-pression era (Brown and Wu 2005, North et al.
2005, Scholl and Taylor 2010, Fry et al. 2014, Taylor et al. 2014). Therefore, the methods used by these studies to estimate proportions of small to large trees in pre-settlement forests led to estimates of percent area affected by high-severity fire in pre-settlement YPMC for-ests in the SNEP area that are too high.
Baker (2014, 2015) used late nineteenth century tree data as well as surveyor notes on vegetation cover along section lines acquired by the US General Land Office (GLO) in sur-veys used to establish the public land survey system (PLSS). There is debate whether the GLO section corner tree data can be used to es-timate forest structure because of the small sample. Methods for pooling the data have been devised (Williams and Baker 2011). However, tree density estimates from the Wil-liams and Baker pooling methodology are 2.1 to 5.9 times higher than estimates from several other studies based upon early twentieth centu-ry forest surveys that sampled orders of magni-tude more trees per unit area, with small trees comprising most of the differences in density (Collins et al. 2011; Hagmann et al. 2013, 2014; Stephens et al. 2015). Recent work also suggests that errors in Williams and Baker’s methods explain the nature and magnitude of their overestimated tree densities (C.R. Levine, Department of Environmental Science, Policy, and Management, University of California, Berkeley, USA, unpublished data). Small tree density estimates that are too high, coupled with Baker’s unrealistic assumptions about tree
regeneration in dry forests, suggest that Bak-er’s estimates of percent area affected by high-severity fire in late nineteenth century Si-erra Nevada forests may be unreliable.
Odion et al. (2014) assume that stand age recorded by the Forest Service’s Forest Inven-tory and Analysis (FIA) program represents a single stand initiation date due to high-severity fire. That assumption implies that fire is the only cause of tree mortality, and that trees old-er than the calculated stand age in the modold-ern FIA plot must have survived a hypothetical high-severity fire. There are several funda-mental issues with these assumptions. First, the stand age attribute is an average value de-rived from the observed or inferred ages of a subset of canopy trees, and often does not cap-ture the ages of older trees in multi-aged stands that were typical of pre-settlement dry conifer forests (Scholl and Taylor 2010, Taylor 2010, USDA Forest Service FIA Program 2014, Stevens et al. 2016). In addition, other biological factors other than fire are important in causing tree mortality that would limit the age and number of older trees (Loehle 1988). Consequently, many trees present in the nine-teenth century would have died for reasons other than fire before they were measured in a modern FIA plot. Finally, because tree regen-eration in these forests is more closely linked to periodic wet episodes or longer fire free pe-riods, none of the tree ages in an FIA plot can be linked to fire without independent evidence (Stevens et al. 2016). Thus, modern FIA data are not appropriate to infer rates of historic high-severity fire in dry pine and mixed coni-fer forests.
2014: 19), topographic settings that generally correspond to the driest extent of YPMC for-ests (Fitch 1900a, Vankat 1977, Fites-Kaufman
et al. 2007). Contemporary vegetation maps (CALVEG) demonstrate that these areas are currently covered with canyon live oak or hard chaparral (Society of American Forester [SAF] cover types 249 and 262 corresponding to
oak occurs mostly at elevations below conifer forests (Myatt 1980). In addition, although canyon live oak can be associated with vary-ing densities of Douglas-fir or ponderosa pine, it can also occur in nearly pure stands on steep, rocky south- and west-facing canyon slopes. Where conifers do occur in these types of lo-cations, they are not remnants of a severely burned forest, but rather they are moisture-lim-ited isolated trees (Mallory 1980, Myatt 1980, McDonald 1988, McDonald and Tappeiner 1996). In summary, many areas identified by Baker (2014) as having experienced high-se-verity fire are unsuitable for the persistence of YPMC forests, and are not representative of early seral conditions.
CONCLUSIONS
Percentage of high-severity fire; fire fre-quency; and landscape proportions of early, mid, and late developmental forests are intri-cately linked. While undoubtedly there was variation due to local biophysical settings, we do not see evidence that very large fires with large proportions of high severity were typical during pre-settlement times in SNEP YPMC forests. Early twentieth century vegetation data and succession modeling corroborate pre-vious estimates that the percentage of high-se-verity fire on pre-settlement YPMC forests was generally low. Succession modeling also substantiates previous estimates that around half of pre-settlement YPMC forests were in late development condition, which is fully compatible withand indeed dependent onthe low-severity paradigm. In contrast,
our modeling demonstrated that the prepon-derance of large, old trees in pre-settlement YPMC forests that was described by so many early Euro-Americans would have been im-possible if fires at that time burned at the lev-els of severity that we see in the modern Sierra Nevada. The implication is clear: if 40 % to 60 % of the Sierra Nevada supported old-growth or late development forests, then the average proportion of high severity per fire could not have been more than about 5 % to 10 % in YPMC forests.
Management objectives often call for fuels treatments that mimic pre-settlement fire rota-tions and fire effects to increase the resilience of dry conifer forests to current and future stressors (North et al. 2009, Long et al. 2014). However, mechanical treatments can be imple-mented on less than half of the productive ested lands in the Sierra Nevada national for-ests (North et al. 2015). Furthermore, resto-ration of fire frequency (either prescribed or wildland fire) that would mimic pre-settlement rates may not be achievable in modern times due to land ownership patterns and smoke re-strictions (Quinn-Davidson and Varner 2012). Nevertheless, proactively increasing overall area burned under moderate weather condi-tions will moderate fire severity, decrease high-severity patch size, and decrease smoke emissions in comparison to wildfires burning under more severe weather conditions, while at the same time create and maintain heteroge-neous forest structures that are important to biodiversity, ecological and hydrological func-tion, and overall ecosystem resilience (Sch-weizer and Cisneros 2014).
ACKNOWLEDGEMENTS
LITERATURE CITED
Anderson, M.K. 2005. Tending the wild: Native American knowledge and management of Cali-fornia’s natural resources. University of California Press, Berkeley, USA.
Baker, W.L. 2014. Historical forest structure and fire in Sierran mixed-conifer forests recon-structed from General Land Office survey data. Ecosphere 5: art79. doi: 10.1890/ ES14-00046.1
Baker, W.L. 2015. Are high-severity fires burning at much higher rates recently than historically in dry-forest landscapes of the Western USA? PLoS ONE 10: e0136147. doi: 10.1371/ journal.pone.0136147
Barbour, M., E. Kelley, P. Maloney, D. Rizzo, E. Royce, and J. Fites-Kaufman. 2002. Present and past old-growth forests of the Lake Tahoe Basin, Sierra Nevada, US. Journal of Vegeta-tion Science 13: 461-472. doi: 10.1111/j.1654-1103.2002.tb02073.x
Barbour, M.G., T. Keeler-Wolf, and A.A. Schoenherr, editors. 2007. Terrestrial vegetation of California. Third edition. University of California Press, Berkeley, USA.
Barbour, M.G., and J. Major. 1988. Terrestrial vegetation of California. Second edition. Cali-fornia Native Plant Society, Sacramento, CaliCali-fornia, USA.
Barbour, M.G., and R.A. Minnich. 2000. Californian upland forests and woodlands. Pages 162
-202 in: M.G. Barbour and W.D. Billings, editors. North American terrestrial vegetation, sec-ond edition. Cambridge University Press, Cambridge, England, United Kingdom.
Beardsley, D., C. Bolsinger, and R. Warbington. 1999. Old-growth forests in the Sierra Nevada: by type in 1945 and 1993 and ownership in 1993. USDA Forest Service Research Paper PNW-RP-516, Pacific Northwest Research Station, Portland, Oregon, USA.
Beaty, R.M., and A.H. Taylor. 2001. Spatial and temporal variation of fire regimes in a mixed conifer forest landscape, southern Cascades, California, USA. Journal of Biogeography 28: 955-966. doi: 10.1046/j.1365-2699.2001.00591.x
Beaty, R.M., and A.H. Taylor. 2007. Fire disturbance and forest structure in old-growth mixed conifer forests in the northern Sierra Nevada, California. Journal of Vegetation Science 18: 879-890. doi: 10.1111/j.1654-1103.2007.tb02604.x
Beesley, D. 1996. Reconstructing the landscape: an environmental history, 1820-1960. Pages
3-24 in: D.C Erman, editor. Sierra Nevada Ecosystems Project: final report to Congress, vol-ume II. Assessments and scientific basis for management options. University of California, Centers for Water and Wildland Resources, Davis, California, USA.
Bonnicksen, T.M., and E.C. Stone. 1982. Reconstruction of a presettlement giant sequoia— mixed conifer forest community using the aggregation approach. Ecology 63: 1134-1148.
doi: 10.2307/1937250
Brohman, R., and L. Bryant. 2005. Existing vegetation classification and mapping technical guide. General Technical Report WO-67, USDA Forest Service, Ecosystem Management Coordination Staff, Washington, D.C., USA.
Brown, P.M., and R. Wu. 2005. Climate and disturbance forcing of episodic tree recruitment in a Southwestern ponderosa pine landscape. Ecology 86: 3030-3038. doi: 10.1890/05-0034
Cermak, R.W. 2005. Fire in the forest: a history of forest fire control on the national forests in California 1898-1956. USDA Forest Service Report R5-RF-003, Pacific Southwest Region, Vallejo, California, USA.
Clark, W.B. 1970. Gold districts of California. California Division of Mines and Geology Bul-letin 193, Sacramento, California, USA.
Collins, B.M., R.G. Everett, and S.L. Stephens. 2011. Impacts of fire exclusion and recent man-aged fire on forest structure in old growth Sierra Nevada mixed-conifer forests. Ecosphere 2: art51. doi: 10.1890/ES11-00026.1
Collins, B.M., and S.L. Stephens. 2007. Managing natural wildfires in Sierra Nevada wilderness areas. Frontiers in Ecology and the Environment 5: 523-527. doi: 10.1890/070007
Collins, B., and S. Stephens. 2010. Stand-replacing patches within a “mixed severity” fire re-gime: quantitative characterization using recent fires in a long-established natural fire area. Landscape Ecology 25: 927-939. doi: 10.1007/s10980-010-9470-5
Collins, B.M., J.M. Lydersen, R.G. Everett, D.L. Fry, and S.L. Stephens. 2015. Novel character-ization of landscape-level variability in historical vegetation structure. Ecological Applica-tions 25: 1167-1174. doi: 10.1890/14-1797.1
Cook, S.F. 1978. Historical demography. Pages 91-98 in: W.C. Sturtevant and R.F. Heizer, edi-tors. Handbook of North American Indians, volume 8: California. Smithsonian Institution, Washington, D.C., USA.
Cooper, A.W. 1906. Sugar pine and western yellow pine in California. USDA Forest Service Bulletin No. 69, Washington, D.C., USA. doi: 10.5962/bhl.title.66268
Dolanc, C.R., H.D. Safford, S.Z. Dobrowski, and J.H. Thorne. 2014. Twentieth century shifts in abundance and composition of vegetation types of the Sierra Nevada, California, US. Ap-plied Vegetation Science 17: 442-445. doi: 10.1111/avsc.12079
Dolanc, C.R., J.H. Thorne, and H.D. Safford. 2013. Widespread shifts in the demographic struc-ture of subalpine forests in the Sierra Nevada, California, 1934 to 2007. Global Ecology and Biogeography 22: 264-276. doi: 10.1111/j.1466-8238.2011.00748.x
Dutschke, D. 1988. A history of American Indians in California. Pages 1-55 in: National Park Service, compiler and editor. Five views: an ethnic historic site survey for California. Office of Historic Preservation, California Department of Parks and Recreation, Sacramento, Cali-fornia, USA.
Dunbar-Irwin, M., and H.D. Safford. 2016. Climatic and structural comparison of yellow pine and mixed-conifer forests in northern Baja California (México) and the eastern Sierra Nevada (California, USA). Forest Ecology and Management 363: 252-266. doi: 10.1016/j.fore-co.2015.12.039
England, A.S. 1988a. Chamise-redshank chaparral. In: K.E. Mayer and W.F. Laudenslayer Jr., editors. A guide to wildlife habitats of California. State of California, Resources Agency, De-partment of Fish and Game, Sacramento, California, USA. <https://www.dfg.ca.gov/biogeo-data/cwhr/wildlife_habitats.asp>. Accessed 24 July 2014.
England, A.S. 1988b. Mixed chaparral. In: K.E. Mayer and W.F. Laudenslayer Jr., editors. A guide to wildlife habitats of California. State of California, Resources Agency, Department of Fish and Game, Sacramento, California, USA. <https://www.dfg.ca.gov/biogeodata/cwhr/ wildlife_habitats.asp>. Accessed 24 July 2014.
ESSA. 2007. Vegetation Dynamics Development Tool user guide version 6.0. ESSA Technolo-gies Ltd., Vancouver, British Columbia, Canada.
Fitch, C.H. 1900a. Sonora quadrangle, California. Pages 569-570 in: Annual reports of the De-partment of the Interior, 21st annual report of the US Geological Survey, part V—forest re-serves. US Government Printing Office, Washington, D.C., USA.
Fitch, C.H. 1900b. Yosemite quadrangle, California. Pages 571-574 in: Annual reports of the Department of the Interior, 21st annual report of the US Geological Survey, part V—forest reserves. US Government Printing Office, Washington, D.C., USA.
Fites-Kaufman, J.A., P. Rundel, N. Stephenson, and D.A. Weixelman. 2007. Montane and subal-pine vegetation of the Sierra Nevada and Cascade ranges. Pages 456-501 in: M.G. Barbour, T. Keller-Wolf, and A.A. Schoenherr, editors. Terrestrial vegetation of California. University of California Press, Berkeley, USA. doi: 10.1525/california/9780520249554.003.0017
Franklin, J., and J. Fites-Kaufman. 1996. Assessment of late-successional forests of the Sierra Nevada. Pages 627-656 in: D.C. Erman, editor. Sierra Nevada Ecosystems Project: final re-port to Congress. University of California, Davis, USA.
Fry, D.L., S.L. Stephens, B.M. Collins, M.P. North, E. Franco-Vizcaíno, and S.J. Gill. 2014. Contrasting spatial patterns in active-fire and fire-suppressed mediterranean climate old-growth mixed conifer forests. PLoS ONE 9: e88985. doi: 10.1371/journal.pone.0088985
Fulé, P.Z. 2008. Does it make sense to restore wildland fire in changing climate? Restoration Ecology 16: 526-531. doi: 10.1111/j.1526-100X.2008.00489.x
Fulé, P.Z., T.W. Swetnam, P.M. Brown, D.A. Falk, D.L. Peterson, C.D. Allen, G.H. Aplet, M.A. Battaglia, D. Binkley, C. Farris, R.E. Keane, E.Q. Margolis, H. Grissino-Mayer, C. Miller, C.H. Sieg, C. Skinner, S.L. Stephens, and A. Taylor. 2014. Unsupported inferences of high-severity fire in historical dry forests of the western United States: response to Williams and Baker. Global Ecology and Biogeography 23: 825-830. doi: 10.1111/geb.12136
Greeley, W.B. 1907. A rough system of management for reserve lands in the western Sierras. Proceedings of the Society of American Foresters 2: 103-114.
Gruell, G.E. 2001. Fire in Sierra Nevada forests: a photographic interpretation of ecological change since 1849. Mountain Press, Missoula, Montana, USA.
Hagmann, R.K., J.F. Franklin, and K.N. Johnson. 2013. Historical structure and composition of ponderosa pine and mixed-conifer forests in south-central Oregon. Forest Ecology and Man-agement 304: 492-504. doi: 10.1016/j.foreco.2013.04.005
Hagmann, R.K., J.F. Franklin, and K.N. Johnson. 2014. Historical conditions in mixed-conifer forests on the eastern slopes of the northern Oregon Cascade Range, USA. Forest Ecology and Management 330: 158-170. doi: 10.1016/j.foreco.2014.06.044
Halofsky, J.S., J.E. Halofsky, T. Burcsu, and M.A. Hemstrom. 2014. Dry forest resilience varies under simulated climate-management scenarios in a central Oregon, USA, landscape. Eco-logical Applications 24: 1908-1925. doi: 10.1890/13-1653.1
Hardy, C.C., K.M. Schmidt, J.P. Menakis, and R.N. Sampson. 2001. Spatial data for national fire planning and fuel management. International Journal of Wildland Fire 10: 353-372. doi: 10.1071/WF01034
Heinselman, M.L. 1978. Fire in wilderness ecosystems. Pages 249-278 in: J.C. Hendee, G.H. Stankey, and R.C. Lucas, editors. Wilderness management. USDA Forest Service Miscella-neous Publication No. 1365, Washington, D.C., USA.