O R I G I N A L A R T I C L E
Open Access
Genome-wide association study and
candidate gene analysis of alkalinity
tolerance in
japonica
rice germplasm
at the seedling stage
Ning Li
1†, Hongliang Zheng
1,2†, Jingnan Cui
1, Jingguo Wang
1, Hualong Liu
1, Jian Sun
1, Tongtong Liu
1,
Hongwei Zhao
1, Yongcai Lai
2and Detang Zou
1*Abstract
Background:Salinity-alkalinity stress is one of the major factors limiting rice production. The damage caused by alkaline salt stress to rice growth is more severe than that caused by neutral salt stress. At present, the genetic resources (quantitative trait loci (QTLs) and genes) that can be used by rice breeders to improve alkalinity tolerance are limited. Here, we assessed the alkalinity tolerance of rice at the seedling stage and performed a genome-wide association study (GWAS) based on genotypic data including 788,396 single-nucleotide polymorphisms (SNPs) developed by re-sequencing 295japonicarice varieties.
Results:We used the score of alkalinity tolerance (SAT), the concentrations of Na+and K+in the shoots (SNC and SKC, respectively) and the Na+/K+ratio of shoots (SNK) as indices to assess alkalinity tolerance at the seedling stage in rice. Based on population structure analysis, thejaponicarice panel was divided into three subgroups. Linkage disequilibrium (LD) analysis showed that LD decay occurred at 109.77 kb for the whole genome and varied between 13.79 kb and 415.77 kb across the 12 chromosomes, at which point the pairwise squared correlation coefficient (r2
) decreased to half of its maximum value. A total of eight QTLs significantly associated with the SAT, SNC and SNK were identified by genome-wide association mapping. A common QTL associated with the SAT, SNC and SNK on chromosome 3 at the position of 15.0 Mb, which explaining 13.36~13.64% of phenotypic variation, was selected for further analysis. The candidate genes were filtered based on LD decay, Gene Ontology (GO)
enrichment, RNA sequencing data, and quantitative real-time PCR (qRT-PCR) analysis. Moreover, sequence analysis revealed one 7-bp insertion/deletion (indel) difference inLOC_Os03g26210(OsIRO3) between the alkalinity-tolerant and alkalinity-sensitive rice varieties.OsIRO3encodes a bHLH-type transcription factor and has been shown to be a negative regulator of the Fe-deficiency response in rice.
Conclusion:Based on these results,OsIRO3maybe a novel functional gene associated with alkalinity tolerance in japonicarice. This study provides resources for improving alkalinity tolerance in rice, and the functional molecular marker could be verified to breed new rice varieties with alkalinity tolerance via marker-assisted selection (MAS).
Keywords:Japonicarice, Alkalinity tolerance, Gene, Genome-wide association study (GWAS)
© The Author(s). 2019Open AccessThis article is distributed under the terms of the Creative Commons Attribution 4.0 International License (http://creativecommons.org/licenses/by/4.0/), which permits unrestricted use, distribution, and reproduction in any medium, provided you give appropriate credit to the original author(s) and the source, provide a link to the Creative Commons license, and indicate if changes were made.
* Correspondence:zoudtneau@126.com
†Ning Li and Hongliang Zheng contributed equally to this work.
1Key Laboratory of Germplasm Enhancement, Physiology and Ecology of
Food Crops in Cold Region, Ministry of Education, Northeast Agricultural University, Harbin 150030, China
Background
Salinity-alkalinity stress is a major constraint to agricul-tural food production because it decreases crop yield and restricts the use of agricultural land. This problem is in-creasing annually due to climate change and poor irriga-tion management (Qadir et al. 2014). Because rice is one of the most important food crops and widely distributed worldwide, monitoring rice planting areas is necessary to ensure national food security (Ma et al.2016). Rice growth and yield have been strongly influenced by the deterior-ation and annual increase in the tillage area of saline-alkaline soils (Takagi et al.2015). Therefore, study-ing the salinity-alkalinity tolerance of rice has important practical significance for breeding tolerant rice cultivars and improving saline-alkaline land (Li et al.2014).
Salinity-alkalinity stress restricts the growth and devel-opment of rice at all its growth stages by decreasing nu-trient solubility, increasing external osmotic pressure, and disrupting ion imbalance, especially cellular pH sta-bility (Chen et al. 2009). High concentrations of Na+ in saline-alkaline soils not only alter the cytoplasmic ion strength necessary for cellular metabolism but also dis-rupt the homeostasis of other mineral elements such as K+. Therefore, reducing the concentration of Na+ in the cytoplasm is required for salinity-alkalinity tolerance in rice (Bal and Dutt1986; Jini and Joseph 2017). Based on the differences of main anions, we can divide the salinity-alkalinity stress into two kinds: salt stress and al-kalinity stress (Poljakoff-Mayber and Lerner 1999). Nu-merous studies have shown that in some respects, alkaline soils dominated by NaHCO3and Na2CO3 may be more
stressful than saline soils containing neutral salts such as NaCl and Na2SO4(Tanji2002; Wang et al.2008).
Salinity-alkalinity tolerance of rice is a very complex quantitative trait that is genetically controlled by mul-tiple quantitative trait loci (QTLs) (Liang et al. 2015). Recently, a large number of studies on QTL mapping of salt tolerance in rice have been carried out (Senadheera et al.2000; Lin et al.2004; Liang et al.2015; Zheng et al.
2015), and some salt-tolerant genes have been obtained by map-based cloning, such as SKC1 (Ren et al. 2005) and DST (Huang et al. 2009). However, progress in the localization of QTLs for alkalinity tolerance under alka-line salt stress (NaHCO3or Na2CO3) obviously lags
be-hind that for salt tolerance. Moreover, most of the related research is in the primary stage of QTL mapping. Cheng et al. (2008) used ten traits to characterize the al-kalinity tolerance of rice at the germination and early seedling stages under a treatment of 0.15% Na2CO3
alka-line solution, and 14 QTLs controlling the tolerance of alkalinity stress were mapped. The dead leaf rate (DLR) and the dead seedling rate (DSR) were identified using 200 F2:3 individuals, thirteen and six QTLs associated
with DLR and DSR were detected under alkalinity stress
(Qi et al. 2008). A few valuable genes have been found that can be used to improve the alkalinity tolerance of rice. Guo et al. (2014) cloned a rice alkalinity-tolerance gene (ALT1) using a mutant that negatively regulates the alkalinity tolerance of rice by preventing oxidative dam-age. However, ALT1also affects root growth during rice seedling development and reduces the number of tillers. Therefore, genetic resources (QTLs and genes) that can be used by rice breeders to improve alkalinity tolerance are needed.
Genome-wide association study (GWAS) is a powerful approach for gaining insight into the genetic architecture of complex traits in many crops and has been used to identify loci and candidate genes (Zhao et al.2011; Zhou et al. 2015; Huang et al.2016). Compared to traditional QTL linkage analysis, GWAS is based on high-density variation in natural populations and can detect multiple alleles at the same site (Flint-Garcia et al. 2003). Many QTLs associated with multiple traits have been identi-fied, such as agronomic traits (Huang et al. 2010; Zhao et al. 2011; Yang et al. 2014) and traits associated with abiotic stress (Lv et al.2015; Pan et al.2015; Wang et al.
2016; Shakiba et al. 2017). Several loci associated with salt tolerance were also identified in rice based on GWAS. Campbell et al. (2017) found that the genetic basis of root Na+ content varied between indica acces-sions and japonica accessions via GWAS, and a major QTL (RNC4) associated with root Na+/K+ratio and root Na+ content was identified in a region of approximately 575 kb on chromosome 4. Yu et al. (2017) used 295 rice varieties to perform a GWAS of salt tolerance-related traits in rice at the seedling stage, and 25 SNPs were sig-nificantly associated with six phenotypes. Kumar et al. (2015) performed a GWAS of 12 different salt tolerance-related traits in rice and identified 22 SNPs significantly associated with Na+/K+ ratio and 44 SNPs with other traits observed under salt stress condition. In summary, GWAS is a powerful strategy for mapping QTLs of salt tolerance in rice. However, no studies have dissected the QTLs associated with alkalinity tolerance of rice through GWAS.
In this study, 295japonicarice varieties were collected to evaluate alkalinity tolerance at the seedling stage under alkalinity stress conditions. Eight QTLs signifi-cantly associated with the score of alkalinity tolerance (SAT), concentration of Na+
analysis. This result will be useful for improving alkalin-ity tolerance injaponicarice.
Results
Phenotypic variation of 295japonicarice varieties in response to alkalinity treatment
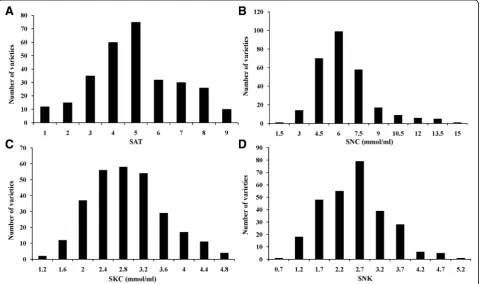
To assess the phenotypic variation in alkalinity tolerance in 295 japonica rice varieties at the seedling stage, four alkalinity tolerance indices were evaluated: the SAT, SNC, concentration of K+in the shoots (SKC) and SNK. Under the alkalinity stress treatment, the average SAT value was 5.02 (Additional file 1: (Table S1). A total of 12 varieties were highly tolerant (SAT = 1) and 10 varieties were highly sensitive (SAT = 9) (Fig. 1). The variation in the SNC and SKC ranged from 1.30 ~ 15.57 mmol/ml and 1.15 ~ 7.74 mmol/ml, respectively, and the coefficient of variation was 35.20% and 27.81%, respect-ively (Additional file1: Table S1). The variation in SNK was between 0.64 and 2.04, and the coefficient of vari-ation is 31.08% (Additional file 1: Table S1). Therefore, the SAT, SNC, SKC and SNK of rice seedlings were af-fected to varying degrees by alkalinity stress, and there were large variations among the 295 japonica rice var-ieties at the seedling stage. The correlation analysis sug-gested that there was a significant positive correlation between the SNC and SAT (r2= 0.577**) and a significant negative correlation between the SNC and SKC, for which
the correlation coefficient was −0.335** (Table 1). Statis-tical analysis (Fig.1) revealed continuous variation in each trait, which was consistent with the genetic characteristics of quantitative traits controlled by multiple genes.
SNP validation, population structure and LD analysis
Re-sequencing of the 295 japonicarice accessions by an Illumina HiSeq XTen sequencer generated a total of 1798.65G of clean data, with an average depth of 14.62× and a coverage of the Nipponbare reference genome of 96.51%. After mapping against the reference genome, a total of 3,437,749 non-redundant SNPs were identified. Based on the criteria of having less than 20% missing data and a minor allele frequency (MAF) greater than 5% in the selected population, a total of 788,396 SNPs were selected for GWAS.
We used ADMIXTURE software to calculate the genetic components of each variety. The K value with the lowest cross-validation (CV) error was considered the number of subgroups (Fig.2a). The 295 japonica rice varieties were divided into three subgroups, designated P1, P2 and P3. (Fig. 2b, Additional file 2: Table S2). Based on principal component analysis (PCA), thejaponicarice panel formed three subgroups with different distributions along the first two eigenvectors; PC1 and PC2 accounted for 19.95 and 12.96% of the genetic variation, respectively (Fig.2c). Add-itionally, a neighbour-joining (NJ) tree was constructed
based on Nei’s genetic distance with the three clusters (red, blue, and green) (Fig. 2d). The combined results of ADMIXTURE, PCA and the NJ tree divided thejaponica
rice panel into three subgroups, and these varieties did not show an extremely differentiated population structure. In the whole panel, ther2estimate was as high as 0.83 for the whole genome (Additional file 3: Figure S1) and ranged from 0.76 to 0.89 among the individual chromo-some (Additional file 4: Figure S2). As expected, the r2
value declined with increasing physical distance between markers. The averager2for the whole genome decreased to half of its maximum value at 109.77 kb. The LD decay was slower for chromosomes 2, 3, 4, 5, 6 and 12. The average r2 decreased to half of its maximum value at 203.70 kb, 162.55 kb, 118.49 kb, 415.77 kb, 344.51 kb and 186.17 kb, respectively. The LD decay was faster for chromosomes 1, 7, 8, 9, 10 and 11. The average r2 de-creased to half of its maximum value at 24.74 kb, 74.56 kb, 90.14 kb, 52.08 kb, 68.13 kb and 13.79 kb, respectively (Additional file4: Figure S2). Therefore, the use of these varieties had a slight advantage over that of the other sets of japonica rice germplasm because it resulted in the inclusion of fewer candidate genes within an LD block (Zhao et al.2011; Yano et al.2016).
GWAS analysis
GWAS was performed via the mixed linear model (MLM) method, considering both population structure Table 1Correlation coefficients between alkalinity
tolerance-related traits in 295japonicarice varieties
SAT SNC SKC SNK
SAT 1
SNC 0.577a 1
SKC -0.476 -0.335a 1
SNK 0.339 0.637a -0.399 1
a
: Indicates significance at the 1 % levels
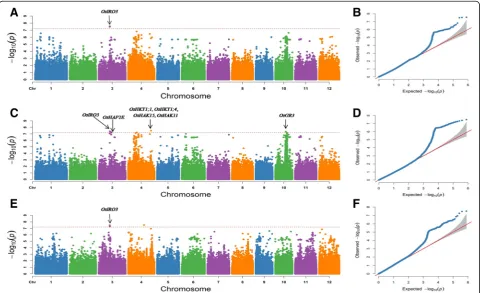
(Q) and kinship (K), in Tassel 5.0 software. According to the LD decay rate for the 12 chromosomes in the 295 ja-ponicarice accessions (Additional file4: Figure S2), a re-gion was considered one QTL if it had more than two SNPs withP< 6.34E-08 within an LD interval. A Manhat-tan plot of the GWAS results is shown in Fig.3. In total, eight QTLs with 11 SNPs were significantly associated with alkalinity tolerance in the 295 japonica rice acces-sions (Table2). These QTLs were distributed on chromo-somes 3, 4, and 10, and the R2 ranged from 13.71% to 13.97%. Three significant SNPs for the SAT were distrib-uted on chromosomes 3 and 4 and contained two genome intervals, named qSAT3 and qSAT4, respectively. Three significant SNPs for the SNC were distributed on chromo-some 3 and contained one genome interval, named
qSNC3.Five significant SNPs for the SNK were distributed on chromosomes 3, 4 and 10 and contained five genome intervals, namedqSNK3–1, qSNK3–2, qSNK4–1, qSNK4–2
and qSNK10, respectively (Fig. 3, Table2). No significant SNPs were detected for the SKC. Among these QTLs,
qSAT3, qSNC3andqSNK3–1were located in the same LD interval near position 15.0 Mb with the lowestP value (P = 2.87E-08) and were considered one QTL, which ex-plained 13.36~13.64% of the total phenotypic variation.
A comparison with previous results of salinity-alkalinity tolerance gene mapping or functional characterization
indicated that six QTLs co-localized with known character-ized genes (Table2). In these QTLs, We found seven genes known to be involved in salinity-alkalinity tolerance of rice:
OsIRO3(Zheng et al.2010),OsHAP2E (Alam et al.2014),
OsHKT1;1 (Wang et al. 2015b), OsHKT1;4 (Suzuki et al.
2016),OsHAK15(Bañuelos et al.2002),OsHAK11 (Bañue-los et al.2002) andOsGR3(Wu et al.2015) (Fig.3). These genes were located within or near six QTL intervals and were identified for the SNC, SNK and SAT via GWAS.
Candidate gene analysis
The GWAS analysis detected a common QTL for the SAT, SNC and SNK on chromosome 3, which harboured the highest-peak SNP at approximately 15.0 Mb (Fig.4a). According to the LD decay analysis of chromosome 3 (Additional file4: Figure S2), a 325-kb region was identi-fied as the candidate region, which contained 54 genes including 20 functionally annotated genes, 17 expressed proteins with unknown function, 5 hypothetical proteins and 12 retrotransposon proteins (Additional file5: Table S3). According to the gene function annotation and GO enrichment analysis (Additional file 6: Table S4), we chose genes with functions related to stress response or metabolic process. We also referred to previously re-ported RNA sequencing data (Additional file 7: Table S5) to analyse the expression pattern of candidate genes
Table 2The mapped QTLs associated with alkalinity tolerance ofjaponicarice at seedling stage
Traits QTLs Lead SNPs Chr. Position Pvalue R2(%) Known genes
SAT qSAT3 Chr3_14978662 3 14978662 3.36E-08 13.36 OsIRO3 qSAT4 Chr4_21534673 4 21534673 3.87E-08 13.97
SNC qSNC3 Chr3_14978662 3 14978662 2.87E-08 13.64 OsIRO3
SNK qSNK3-1 Chr3_15093871 3 15093871 4.06E-08 13.39 OsIRO3 qSNK3-2 Chr3_16913725 3 16913725 5.55E-08 13.17 OsHAP2E qSNK4-1 Chr4_11383297 4 11383297 5.99E-08 13.79
qSNK4-2 Chr4_30958528 4 30958528 3.23E-08 13.85 OsHKT1;1, OsHKT1;4,OsHAK15, OsHAK11 qSNK10 Chr10_14244765 10 14244765 4.74E-08 13.42 OsGR3
R2
(%): Phenotypic variance explained
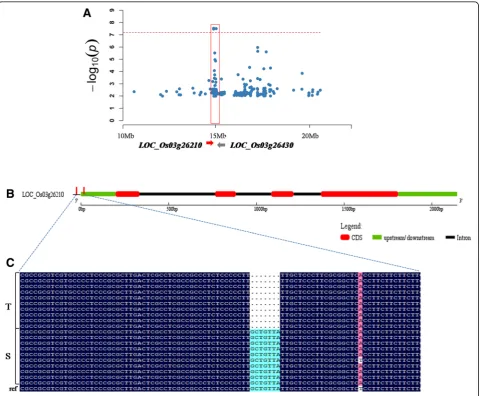
Fig. 4The location ofqSNC3on chromosome 3 and sequence difference analysis ofLOC_Os03g26210.a, Colocalization ofLOC_Os03g26210and
LOC_Os03g26430withqSNC3. The arrow indicates the location and direction ofLOC_Os03g26210andLOC_Os03g26430.b, The gene structure of
under alkaline stress (Li et al.2018). Through further in-tegrated analysis, we selected 12 candidate genes (Add-itional file 8: Table S6) to compare expression levels between alkalinity-tolerant and alkalinity-sensitive var-ieties by qRT-PCR analysis under normal and alkalinity stress conditions. Two genes (LOC_Os03g26430 and
LOC_Os03g26210) were differentially expressed between ten alkalinity-tolerant varieties (SAT = 1) and ten alkalinity-sensitive varieties (SAT = 9) (Fig.5). Under the alkalinity stress treatment, LOC_Os03g26210 showed higher expression levels in alkalinity-sensitive varieties than in alkalinity-tolerant varieties (Fig.5). The opposite expression pattern was observed for LOC_Os03g26430. The candidate gene LOC_Os03g26210 is a gene that have been studied and named (OsIRO3) in a prior study (Zheng et al. 2010). This gene encodes a bHLH-type transcription factor and has been shown to be a negative regulator of the Fe-deficiency response in rice.
LOC_Os03g26430is an aldose 1-epimerase gene, and its function has not been preliminary studied.
Identification of candidate genes responsible for alkalinity tolerance of rice
To identify the association between candidate genes and the alkalinity tolerance phenotype, we sequenced
LOC_Os03g26430 and OsIRO3 in ten alkalinity-tolerant and ten alkalinity-sensitive varieties. The sequence ana-lysis ofOsIRO3showed that the alkalinity-tolerant varieties contained one deletion in the starting position of 5′ un-translated region (UTR) (ATG start codon 193–199 bp up-stream) with a total length of 7 bp compared with the alkalinity-sensitive varieties (Fig. 4b and c).
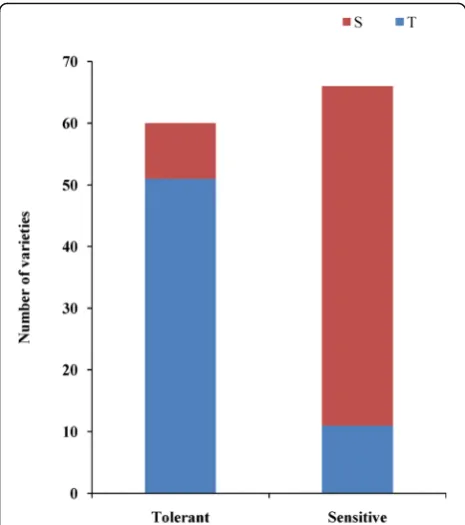
LOC_Os03g26430 exhibited no significant sequence differ-ences between alkalinity-tolerant and alkalinity-sensitive varieties. Furthermore, we designed an insertion-deletion (indel) marker using the 7-bp deletion sequence to geno-type 126japonicarice varieties (60 tolerant and 66 sensitive varieties). The results showed that 85.00% (51 of 60) of the tolerant varieties (SAT≤3) had the tolerant allele, and 83.33% (55 of 66) of the sensitive varieties (SAT≥6) had the sensitive allele (Fig.6).
Discussion
Salinity-alkalinity stress is an important abiotic stress af-fecting rice cultivation worldwide (Li et al. 2014). In contrast to salinity stress, alkalinity stress can not only cause ionic toxicity in plants but also damage the stabil-ity of cells due to its high pH, thus affecting the normal growth of plants (Chen et al.2009). Phenotypic identifi-cation is an important genetic tool for studying alkalinity tolerance in rice. In previous studies, many methods were used to assess alkalinity tolerance of rice, and the determination of concentrations of Na+and K+ was one of the commonly methods (Li et al. 2017). Previous studies have shown that alkalinity-tolerant plants can se-quester Na+ in vacuoles by compartmentalizing of ions at the cellular level to enhance tolerance of a high con-centration of ions (Wang et al. 2015a). In this study, there was a significant positive correlation between the SAT and SNC (r2= 0.577**). In addition, excessive accu-mulation of Na+in the shoots of rice indirectly affects the upward transport of K+. This view was supported by the results of this study, which revealed a significant negative correlation between the SNC and SKC (r2=−0.335**). Moreover, there was a significant positive correlation be-tween the SNC and SNK (r2= 0.637**) (Table1).
Salinity-alkalinity tolerance is a very complex trait in rice (Zhang et al.2013). Many genes related to salt toler-ance have been identified in rice using multiple
strategies. However, few genes have been found to in-crease the tolerance of rice under alkalinity stress. Therefore, we compared the results identified in this study with the genes related to salt tolerance obtained in previous studies. Six of the eight QTLs co-localized with seven genes found to be involved in salt tolerance of rice in previous studies (Fig. 3, Table 2). OsHAP2E was lo-cated withinqSNK3–2and enhance the ability of rice to tolerate high salt and drought stress.OsGR3plays an im-portant role in salt tolerance in rice by regulating the glutathione redox state and was found to be located withinqSNK10in this study. We found similar cases for four genes known to be involved in salt tolerance in rice:
OsHKT1;1, OsHKT1;4, OsHAK15 and OsHAK11. These genes were located within or near the interval of
qSNK4–2. Among these genes, OsHKT1;1 and
OsHKT1;4are two member of the high-affinity K+ trans-porter (HKT) family and play an important role in redu-cing the Na+ accumulation in shoots to cope with salt stress in rice.OsHAK15 and OsHAK11 are located near the lead SNP Chr4_30958528 and involved in the ab-sorption and transport of K+in roots.
Among these QTLs, qSAT3 overlapped with qSNC3
and qSNK3–1, which harboured the highest-peak SNP on chromosome 3 (at 15.0 Mb), and explained 13.64% of the total phenotypic variation. The LD decay analysis in-dicated that an approximately 325-kb region at the asso-ciated locus was a candidate region for further study (Fig. 4). On the basis of GO enrichment and gene func-tional annotation results and gene expression profiles before and after alkalinity treatment in rice, we selected 12 candidate genes for gene expression analyses. These methods are commonly used to verify the function of genes identified in GWAS, especially those related to abiotic stress. After filtering using these methods, only two genes remained as candidate genes for the alkalinity tolerance of rice.
Of the two candidate genes, OsIRO3 contained a 7-bp deletion in the starting position of the 5’UTR that was sig-nificantly associated with the alkalinity-tolerant phenotype and thus was the most likely candidate gene, which en-codes a rice bHLH-type transcription factor. A previous study indicated thatOsIRO3is a negative regulator of the Fe-deficiency response in rice (Zheng et al. 2010). Trans-genic rice plants over-expressingOsIRO3were hypersensi-tive to Fe deficiency, indicating that the Fe deficiency response was compromised. Furthermore, the Fe concen-tration in shoots of transgenic rice plants over-expressing
OsIRO3 was less than that in wild-type plants. In this study, OsIRO3 showed higher expression levels in alkalinity-sensitive varieties than in alkalinity-tolerant var-ieties. Moreover, the sequence analysis ofOsIRO3revealed that the tolerant varieties contained one deletion in the starting position of 5’UTR (ATG start codon 193–199 bp
upstream) with a total length of 7 bp compared with the sensitive varieties. The 5′ UTR is a piece of RNA or mRNA located at 5′upstream to the protein-coding re-gion or unit of that RNA or mRNA. This rere-gion of mRNA will not be translated into amino acid peptides, but it may play regulatory roles in the translation, transcription and stability of RNA. Therefore,OsIRO3not only regulates the Fe-deficiency response in rice but also enhances the alka-linity tolerance of rice by regulating the transcription level of the gene under alkalinity stress.
In addition, we examined the distribution of this 7-bp indel in 66 diverse rice accessions, including six diver-gent groups of cultivated rice and the wild rice, and have been subjected to pan-genome analysis (Zhao et al.
2018). The results showed that 9 of the 66 rice acces-sions contained this 7-bp deletion, and these 9 rice ac-cessions were O. sativatemperate japonica, which were GP551, GP677, GP669, HP13–2, HP390, KY131, LG31, IL9 and UR28. Moreover, this deletion fragment was not detected in other five groups of cultivated rice and wild rice accessions including O. sativa tropical japonica, O. sativa aromatic, O. sativa indica, O. sativa aus and O. rufipogon. Therefore, we conclude thatOsIRO3may be a novel functional gene associated with alkalinity tolerance in temperatejaponica.
Conclusion
In the present study, 295 japonica rice varieties were collected to evaluate the tolerance of alkalinity stress at the seedling stage. Eight QTLs significantly related to the SAT, SNC and SNK were identified by GWAS. A common QTL on chromosome 3 associated with the SAT, SNC and SNK was selected for further analysis. Based on sequence analysis, LOC_Os03g26210 maybe a novel functional gene for alkalinity tolerance ofjaponica
rice. This study provides resources for improving rice alkalinity-tolerant breeding.
Methods
Plant material and genotyping
The natural population comprised 295japonicarice var-ieties, which were collected from the Heilongjiang, Jilin and Liaoning provinces in China and other countries in-cluding Japan, the Republic of Korea, the Democratic People’s Republic of Korea and Russia (Additional file2: Table S2). All 295japonica rice varieties were belong to temperate japonica rice. Most of the varieties in this population were selected from a previous study (Zheng et al.2015).
Total DNA was extracted from leaves of each variety using an EsayPure Plant Genomic Kit (TransGen Bio-tech, Beijing, China). The DNA was physically sheared into ~ 500 bp fragments using a Covaris S2 (Covaris). The fragmented DNA was used for DNA library
construction with an NEBNext DNA Library Prep Re-agent Set for Illumina (BioLabs). The DNA library was sequenced using an Illumina HiSeq XTen (Illumina Co, Ltd.) at the Beijing Genomics Institute (BGI). All reads were mapped against Nipponbare-Reference-IRGSP-1.0 pseudomolecules using BWA software (Li and Durbin
2009). SNP calling for each sample were performed using HaplotypeCaller in GATK software based on GATK Best Practices. The number of SNPs with an MAF≥5% and a missing rate≤20% ultimately identified in this study was 788,396. The chromosomal distribution of the SNPs is shown in Additional file9: Figure S3.
Alkalinity tolerance evaluation at the seedling stage
Alkalinity tolerance was evaluated in a hydroponics sys-tem at Northeast Agricultural University’s experimental station in 2018. The experiment followed a randomized complete block design with two treatments (control and alkalinity treatment) and three replications of each treat-ment. Fifty seeds of each accession were naturally air dried and kept at 55 °C for 5 days to break dormancy. Then, the seeds were surface sterilized with 70% ethyl alcohol and washed three times with sterile water. Next, the seeds were soaked in water for approximately 2 days and allowed to germinate for 1 day. Finally, thirty-six uniform germinated seeds of each variety were sown in 96-well plates supported by a plastic container contain-ing Yoshida’s culture solution (Yoshida et al. 1976) and grown to the two leaf stage. The seedlings were grown in a phytotron glasshouse maintained at 14 h light/10 h dark photoperiod (27 °C/25 °C) and relative humidity of 70%. For the alkalinity treatment, the culture solution was replaced by a fresh solution containing 0.15% Na2CO3 for 7 days, and the seedlings were then
trans-ferred to Yoshida’s culture solution and allowed to con-tinue growth. After 5 days of recovery growth, the seedlings were assessed to determine their SAT on a 1–9 scale. For scores of 1, 2, 3, 4, 5, 6, 7, 8, and 9, the per-centage of dry and yellow leaves was ≤20, between 21 and 30, between 31 and 40, between 41 and 50, between 51 and 60, between 61 and 70, between 71 and 80, be-tween 81 and 90, and > 90, respectively. Then, the shoots of each sample were harvested. The samples were oven dried at 105 °C for 20 min and 60 °C for 1 week prior to measuring the ion content of the shoots. A total of 0.1 g of dried sample was ground and then digested with 0.1 N Nitric acid (Fisher Scientific) at 70 °C for 8 h (Camp-bell et al.2017). The SNC and SKC were analysed using a flame photometer (Sherwood410, Cambridge, UK) (Li et al.2017).
Population genetic analysis
exported phylogenetic tree (Newick format) was modi-fied using the online tool Interactive Tree of Life (iTOL,
https://itol.embl.de/) (Letunic and Bork 2011). GCTA software was used to conduct a PCA to estimate the number of subpopulations (Yang et al. 2011). ADMIX-TURE software was used to calculate the genetic compo-nent for each variety (H Alexander et al.2009), and each variety was assigned to a subpopulation for which the membership value (Q value) was > 0.65 (zheng et al.
2015). LD was calculated using PopLDdecay software (Zhang et al. 2018). The Pairwise r2 was calculated for all SNPs in a 50-kb window and averaged across the whole genome and 12 chromosomes separately. The LD decay was measured as the chromosomal distance at which the average pairwise correlation coefficient (r2) decreased to half its maximum value.
GWAS analysis
GWAS was conducted via the MLM method using Tas-sel 5.0 software (Bradbury et al. 2007). The population structure (Q) and kinship calculated among individuals were used to adjust the population structure. The threshold was set at P= 6.34E-08 (that is 0.05/788,396) by the Bonferroni correction method. To obtain the loci with the lowest P value, redundant SNP were filtered in an LD interval, and the SNP with the minimum P value was considered the lead SNP. The manhattan plot and quantile-quantile (Q-Q) plot were produced by the CMplot package in R.
RNA extraction and quantitative real-time PCR analysis
For analysis of candidate gene expression in leaves, ten each of the alkalinity-tolerant and alkalinity-sensitive rice accessions were selected according to the SAT of 295 japonica rice accessions. The procedure and man-agement of the experiment were the same as those in the above-mentioned experiment. After 48 h of alkalinity stress implemented with 0.15% of Na2CO3, five shoots
from each variety were sampled under alkaline and nor-mal conditions. Total RNA was extracted from rice shoots using aTranZolUp RNA kit (TransGen Biotech). All samples were treated with DNase I (TransGen Bio-tech). Complementary DNA was synthesized from total RNA using HiFiScript cDNA Synthesis Kit (CoWin Bio-sciences, Beijing, China). qRT-PCR was performed using 2 × Fast qPCR Master Mixture (DINING, Beijing, China) on Analytik Jena qTOWER system (German). Additional file 8: Table S6 summarizes the gene accessions and primers used for qRT-PCR in this study. The mRNA level of these genes was determined with the housekeep-ing gene Actin1 (Li et al. 2018) as an internal control. Relative gene expression levels were determined using the 2 −ΔΔCt method (Livak and Schmittgen 2001). The
data shown in figures and tables are mean values of three replicates.
Candidate gene prediction, sequencing, and sequence alignment
According to LD decay analysis of chromosome 3, a 325-kb reference sequence of the mapped QTL regions was identified as the candidate region. Based on the gene annotation and RNA sequencing data collected under al-kalinity stress and control condition in a previous study (Li et al. 2018), the genes related to stress were selected as candidate genes. GO enrichment analysis of candidate genes was performed by using agriGO (Tian et al.2017). Then, the corresponding candidate genes were cloned by PCR and sequenced in ten alkalinity-tolerant and ten alkalinity-sensitive rice varieties. Sequence alignment was performed in DNAMAN software with the genes in the Nipponbare genome as a reference.
Validation of candidate genes with molecular markers
A 7-bp indel difference between the alkalinity-tolerant and alkalinity-sensitive rice cultivars for the candidate gene LOC_Os03g26210 was designed as an indel maker using the conserved flanking sequences as primers (for-ward primer: CCCTTGCTGTTATTGCTC; reverse pri-mer: GAGGAGGGCGAAGATTGA). The marker was further used to genotype 126 japonica rice varieties by PCR with the following PCR protocol: 30 cycles at 94 °C for 30 s, 55 °C for 30 s, and 72 °C for 1 min. PCR prod-ucts were separated on 6% denaturing polyacrylamide gels and stained with AgNO3.
Additional files
Additional file 1: Table S1. Phenotypic variation in 295japonicarice varieties under alkalinity condition. (DOCX 13 kb)
Additional file 2: Table S2.Geographical distribution of 295 japonica rice varieties (XLSX 22 kb)
Additional file 3:Figure S1.LD decay analysis of the whole genome in 295japonicarice varieties. (TIFF 534 kb)
Additional file 4: Figure S2. LD decay analysis of 12 chromosomes in 295japonicarice varieties. The x-axis represents the distance (bp) of the SNP; the y-axis represents r2. (TIFF 708 kb)
Additional file 5: Table S3.Summary of functional annotation of the genes in the candidate region on chromosome 3 (XLSX 12 kb)
Additional file 6: Table S4.GO enrichment analysis of the genes in candidate region. (XLSX 15 kb)
Additional file 7: Table S5.RNA-seq dates of the genes in candidate region. (XLSX 12 kb)
Additional file 8: Table S6.Primers for qRT-PCR in this study. (DOCX 14 kb)
Additional file 9: Figure S3. The chromosomal distribution of the SNPs used for GWAS in this study. (JPG 633 kb)
Abbreviations
SAT: the score of alkalinity tolerance; SKC: Concentration of K+in the shoots;
SNC: Concentration of Na+in the shoots; SNK: Na+/K+ratio of shoots;
SNP: Single-nucleotide polymorphism
Acknowledgments
This research was supported by the National Natural Science Foundation of China (31872884 and 31601377), the University Nursing Program for Young Scholars with Creative Talents in Heilongjiang Province (UNPYSCT-2017009), the“Young Talents”Project of Northeast Agricultural University (17QC02) and the Heilongjiang Provincial government Postdoctoral Foundation of China (LBH-Z16188).
Funding
Funding for this study was provided by the National Natural Science Foundation of China (31872884 and 31601377), the University Nursing Program for Young Scholars with Creative Talents in Heilongjiang Province (UNPYSCT-2017009), the“Young Talents”Project of Northeast Agricultural University (17QC02) and the Heilongjiang Provincial government Postdoctoral Foundation of China (LBH-Z16188).
Availability of data and materials
The raw Illumina sequencing data from this study have been submitted to NCBI Sequence Read Archive (SRA) under the accession number PRJNA512109.
Authors’contributions
N L, HL Z, and DT Z conceived and designed the experiment. N L, HL Z, and JN C conducted the experiments, performed data analysis and wrote the manuscript. HL L, JG W, J S, TT L, YC L and HW Z participated in material development, sample preparation and data analysis. DT Z and N L drafted proposals and corrected the manuscript. All authors read and approved the final manuscript.
Ethics approval and consent to participate
Not applicable.
Consent for publication
Not applicable.
Competing interests
The authors declare that they have no competing interests.
Publisher’s Note
Springer Nature remains neutral with regard to jurisdictional claims in published maps and institutional affiliations.
Author details
1
Key Laboratory of Germplasm Enhancement, Physiology and Ecology of Food Crops in Cold Region, Ministry of Education, Northeast Agricultural University, Harbin 150030, China.2Heilongjiang Academy of Agricultural
Sciences Postdoctoral Programme, Harbin 150030, China.
Received: 18 January 2019 Accepted: 2 April 2019
References
Alam M, Tanaka T, Nakamura H, Ichikawa H, Kobayashi K, Yaeno T, Yamaoka N, Shimomoto K, Takayama K, Nishina H, Nishiguchi M (2014) Overexpression of a rice heme activator protein gene (OsHAP2E) confers resistance to pathogens, salinity and drought, and increases photosynthesis and tiller number. Plant Biotechnol J 13(1):85–96
Alexander HD, Novembre J, Lange K (2009) Fast model-based estimation of ancestry in unrelated individuals. Genome Res 19(9):1655–1664
Bal AR, Dutt SK (1986) Mechanism of salt tolerance in wild rice (Oryza coarctata Roxb). Plant Soil 92:399–404
Bañuelos MA, Garciadeblas B, Cubero B, Rodŕıguez-Navarro A (2002) Inventory and functional characterization of the HAK potassium transporters of rice. Plant Physiol 130:784–795
Bradbury PJ, Zhang Z, Kroon DE, Casstevens TM, Ramdoss Y, Buckler ES (2007) TASSEL: software for association mapping of complex traits in diverse samples. Bioinformatics 23:2633–2635
Campbell MT, Bandillo N, Al Shiblawi FRA, Sharma S, Liu K, Du Q, Schmitz AJ, Zhang C, Véry AA, Lorenz AJ, Walia H (2017) Allelic variants of OsHKT1;1 underlie the divergence between indica and japonica subspecies of rice (Oryza sativa) for root sodium content. PLoS Genet 13(6):e1006823 Chen W, Cui P, Sun H, Guo W, Yang C, Jin H, Fang B, Shi D (2009) Comparative
effects of salt and alkali stresses on organic acid accumulation and ionic balance of seabuckthorn (Hippophae rhamnoides L.).
Ind Crop Prod 30:351–358
Cheng H, Jiang H, Xue D, Guo L, Zeng D, Zhang G, Qian Q (2008) Mapping of QTL underlying tolerance to alkali at germination and early seedling stages in rice. Acta Agron Sin 34:1719–1727
Flint-Garcia SA, Thornsberry JM, Buckler ES (2003) Structure of linkage disequilibrium in plants. Annu Rev Plant Biol 54:357–374
Guo M, Wang R, Wang J, Hua K, Wang Y, Liu X, Yao S (2014) ALT1, a Snf2 family chromatin remodeling ATPase, negatively regulates alkaline tolerance through enhanced defense against oxidative stress in rice. PLoS One 9:e112515
Huang X, Chao D, Gao J, Zhu M, Shi M, Lin H (2009) A previously unknown zinc finger protein, DST, regulates drought and salt tolerance in rice via stomatal aperture control. Genes Dev 23(15):1805–1817
Huang X, Wei X, Sang T, Zhao Q, Feng Q, Zhao Y, Li C, Zhu C, Lu T, Zhang Z, Li M, Fan D, Guo Y, Wang A, Wang L, Deng L, Li W, Lu Y, Weng Q, Liu K, Huang T, Zhou T, Jing Y, Li W, Lin Z, Buckler ES, Qian Q, Zhang Q, Li J, Han B (2010) Genome-wide association studies of 14 agronomic traits in rice landraces. Nat Genet 42:961
Huang X, Yang S, Gong J, Zhao Q, Feng Q, Zhan Q, Zhao Y, Li W, Cheng B, Xia J, Chen N, Huang T, Zhang L, Fan D, Chen J, Zhou C, Lu Y, Weng Q, Han B (2016) Genomic architecture of heterosis for yield traits in rice. Nature 537:629
Jini D, Joseph B (2017) Physiological mechanism of salicylic acid for alleviation of salt stress in rice. Rice Sci 24:97–108
Kumar S, Stecher G, Tamura K (2016) MEGA7: molecular evolutionary genetics analysis version 7.0 for bigger datasets. Mol Biol Evol 33:1870–1874 Kumar V, Singh A, Mithra SA, Krishnamurthy SL, Parida SK, Jain S, Tiwari KK, Kumar
P, Rao AR, Sharma SK, Khurana JP, Singh NK, Mohapatra T (2015) Genome-wide association mapping of salinity tolerance in rice (Oryza sativa). DNA Res 22:133–145
Letunic I, Bork P (2011) Interactive tree of life v2: online annotation and display of phylogenetic trees made easy. Nucleic Acids Res 39:W475–W478
Li H, Durbin R (2009) Fast and accurate short read alignment with burrows– wheeler transform. Bioinformatics 25:1754–1760
Li J, Pu L, Han M, Zhu M, Zhang R, Xiang Y (2014) Soil salinization research in China: advances and prospects. J Geogr Sci 24:943–960 Li N, Liu H, Sun J, Zheng H, Wang J, Yang L, Zhao H, Zou D (2018) Transcriptome analysis of two contrasting rice cultivars during alkaline stress. Sci Rep 8:9586 Li N, Sun J, Wang J, Liu H, Zheng H, Yang L, Liang Y, Li X, Zou D (2017) QTL
analysis for alkaline tolerance of rice and verification of a major QTL. Plant Breed 136:881–891
Liang J, Qu Y, Yang C, Ma X, Cao G, Zhao Z, Zhang S, Zhang T, Han L (2015) Identification of QTLs associated with salt or alkaline tolerance at the seedling stage in rice under salt or alkaline stress. Euphytica 201:441–452 Lin H, Zhu M, Yano M, Gao J, Liang Z, Su W, Hu X, Ren Z, Chao D (2004) QTLs for
Na+and K+uptake of the shoots and roots controlling rice salt tolerance. Theor Appl Genet 108:253–260
Livak KJ, Schmittgen TD (2001) Analysis of relative gene expression data using real-time quantitative PCR and the 2−ΔΔCTmethod. Methods 25:402–408 Lv Y, Guo Z, Li X, Ye H, Li X, Xiong L (2015) New insights into the genetic basis
of natural chilling and cold shock tolerance in rice by genome-wide association analysis. Plant Cell Environ 39:556–570
Ma X, Feng F, Wei H, Mei H, Xu K, Chen S, Li T, Liang X, Liu H, Luo L (2016) Genome-wide association study for plant height and grain yield in rice under contrasting moisture regimes. Front Plant Sci.https://doi.org/10.3389/ fpls.2016.01801
Pan Y, Zhang H, Zhang D, Li J, Xiong H, Yu J, Li J, Rashid MR, Li G, Ma X, Cao G, Han L, Li Z (2015) Genetic analysis of cold tolerance at the germination and booting stages in rice by association mapping. PLoS One 10:e0120590 Poljakoff-Mayber A, Lerner H (1999) Plants in saline environments. Handbook of
plant and crop stress, vol 2, pp 125–154
Qi D, Guo G, Lee MC, Zhang J, Cao G, Zhang S, Suh SC, Zhou Q, Han L (2008) Identification of quantitative trait loci for the dead leaf rate and the seedling dead rate under alkaline stress in rice. J Genetics Genomics 35:299–305 Ren Z, Gao J, Li L, Cai X, Huang W, Chao D, Zhu M, Wang Z, Luan S, Lin H (2005)
A rice quantitative trait locus for salt tolerance encodes a sodium transporter. Nat Genet 37:1141–1146
Saitou N, Nei M (1987) The neighbor-joining method: a new method for reconstructing phylogenetic trees. Mol Biol Evol 4:406–425
Senadheera P, Bagali P, Hittalmani S, Shashidhar H (2000) Molecular mapping of quantitative trait loci associated with seedling tolerance to salt stress in rice (Oryza sativa L.). Curr Sci India 78(2):162–164
Shakiba E, Edwards JD, Jodari F, Duke SE, Baldo AM, Korniliev P, McCouch SR, Eizenga GC (2017) Genetic architecture of cold tolerance in rice (Oryza sativa) determined through high resolution genome-wide analysis.
PLoS One 12:e0172133
Suzuki K, Yamaji N, Costa A, Okuma E, Kobayashi NI, Kashiwagi T, Katsuhara M, Wang C, Tanoi K, Murata Y, Schroeder JI, Ma JF, Horie T (2016) OsHKT1;4-mediated Na+transport in stems contributes to Na+ exclusion from leaf blades of rice at the reproductive growth stage upon salt stress. BMC Plant Biol 16:22
Takagi H, Tamiru M, Abe A, Yoshida K, Uemura A, Yaegashi H, Obara T, Oikawa K, Utsushi H, Kanzaki E, Mitsuoka C, Natsume S, Kosugi S, Kanzaki H, Matsumura H, Urasaki N, Kamoun S, Terauchi R (2015) MutMap accelerates breeding of a salt-tolerant rice cultivar. Nat Biotech 33:445–449
Tanji KK (2002) Salinity in the soil environment. Salinity:environment-plants-molecules, pp 21–51
Tian T, Liu Y, Yan H, You Q, Yi X, Du Z, Xu W, Su Z (2017) agriGO v2.0: a GO analysis toolkit for the agricultural community, 2017 update. Nucleic Acids Res 45:W122–W129
Wang D, Liu J, Li C, Kang H, Wang Y, Tan X, Liu M, Deng Y, Wang Z, Liu Y, Zhang D, Xiao Y, Wang G (2016) Genome-wide association mapping of cold tolerance genes at the seedling stage in rice. Rice 9:61
Wang H, Lin X, Cao S, Wu Z (2015a) Alkali tolerance in rice (Oryza sativa L.): growth, photosynthesis, nitrogen metabolism, and ion homeostasis. Photosynthetica 53:55–65
Wang R, Jing W, Xiao L, Jin Y, Shen L, Zhang W (2015b) The rice high-affinity potassium transporter1;1 is involved in salt tolerance and regulated by an MYB-type transcription factor. Plant Physiol 168:1076–1090
Wang Y, Ma H, Liu G, Xu C, Zhang D, Ban Q (2008) Analysis of gene expression profile of limonium bicolor under NaHCO3stress using cDNA microarray.
Plant Mol Biol Report 26:241–254
Wu T, Lin W, Kao C, Hong C (2015) Gene knockout of glutathione reductase 3 results in increased sensitivity to salt stress in rice. Plant Mol Biol 87:555–564 Yang J, Lee SH, Goddard ME, Visscher PM (2011) GCTA: a tool for genome-wide
complex trait analysis. Am J Hum Genet 88:76–82
Yang W, Guo Z, Huang C, Duan L, Chen G, Jiang N, Fang W, Feng H, Xie W, Lian X, Wang G, Luo Q, Zhang Q, Liu Q, Xiong L (2014) Combining high-throughput phenotyping and genome-wide association studies to reveal natural genetic variation in rice. Nat Commun 5:5087
Yano K, Yamamoto E, Aya K, Takeuchi H, Lo PC, Hu L, Yamasaki M, Yoshida S, Kitano H, Hirano K, Matsuoka M (2016) Genome-wide association study using whole-genome sequencing rapidly identifies new genes influencing agronomic traits in rice. Nat Genet 48:927
Yoshida S, Forno DA, Cock JH (1976) Laboratory manual for physiological studies of rice. International Rice Research Institute, Manila
Yu J, Zao W, He Q, Kim TS, Park YJ (2017) Genome-wide association study and gene set analysis for understanding candidate genes involved in salt tolerance at the rice seedling stage. Mol Gen Genomics 292:1391–1403 Zhang C, Dong S, Xu J, He W, Yang T (2018) PopLDdecay: a fast and effective
tool for linkage disequilibrium decay analysis based on variant call format files. Bioinformatics. bty875
Zhang Y, Lin X, Ou X, Hu L, Wang J, Yang C, Wang S, Liu B (2013) Transcriptome alteration in a rice introgression line with enhanced alkali tolerance. Plant Physiol Biochem 68:111–117
Zhao K, Tung CW, Eizenga GC, Wright MH, Ali ML, Price AH, Norton GJ, Islam MR, Reynolds A, Mezey J, McClung AM, Bustamante CD, McCouch SR (2011) Genome-wide association mapping reveals a rich genetic architecture of complex traits in Oryza sativa. Nat Commun 2:467
Zhao Q, Feng Q, Lu H, Li Y, Wang A, Tian Q, Zhan Q, Lu Y, Zhang L, Huang T, Wang Y, Fan D, Zhao Y, Wang Z, Zhou C, Chen J, Zhu C, Li W, Weng Q, Xu Q, Wang ZX, Wei X, Han B, Huang X (2018) Pan-genome analysis highlights
the extent of genomic variation in cultivated and wild rice. Nat Genet 50:278–284
Zheng H, Zhao H, Liu H, Wang J, Zou D (2015) QTL analysis of Na+and K+
concentrations in shoots and roots under NaCl stress based on linkage and association analysis in japonica rice. Euphytica 201:109–121
Zheng L, Ying Y, Wang L, Wang F, Whelan J, Shou H (2010) Identification of a novel iron regulated basic helix-loop-helix protein involved in Fe homeostasis in Oryza sativa. BMC Plant Biol 10:166


![Poly[μ2 aqua aqua(μ3 1H benzimidazole 5,6 dicarboxylato κ3N3:O5:O5′)manganese(II)]](data:image/gif;base64,R0lGODlhAQABAIAAAP///wAAACH5BAEAAAAALAAAAAABAAEAAAICRAEAOw==)