Copyright © 2018 Techno-Press, Ltd.
http://www.techno-press.org/?journal=aer&subpage=7 ISSN: 2234-1722 (Print), 2234-1730 (Online)
Retrofit of a UK residential property to achieve nearly zero
energy building standard
Radwa Salem
1, Ali Bahadori-Jahromi
*1, Anastasia Mylona
2, Paulina Godfrey
3and Darren Cook
31
Department of Civil and Built Environment, School of Computing and Engineering, University of West London, W5 5RF, London, U.K.
2
Chartered Institution of Building Services Engineers, SW12 9BS, London, U.K.
3
Hilton, Maple Court, Reeds Crescent, WD24 4QQ, Watford, U.K.
(Received November 15, 2017, Revised March 15, 2018, Accepted March 16, 2018)
Abstract. It is currently agreed upon that one of the major challenges in the construction industry is the energy efficiency of existing buildings. The World Meteorological Organisation (WMO) and United Nations (UN) have reported that the concentration of global atmospheric carbon dioxide has increased by an average of 50%, a record speed, from 2015 to 2016. The housing sector contributes to 45% of the UK’s carbon emissions. To help tackle some of those issues the recast Energy Performance Building Directive (EBPD) has introduced Nearly Zero Energy Buildings (NZEBs) in the coming years (including buildings that will undergo refurbishment/ renovations). This paper will explore the retrofitting of a UK residential dwelling using Thermal Analysis Simulation (TAS, EDSL) software by focusing on building fabric improvements and usage of on-site renewables. The CIBSE Test Reference Year (TRY) weather data has been selected to examine the performance of the building under current and future climate projections. The proposed design variables were finally implemented in the building altogether on TAS. The simulation results showed a reduction in the building’s annual energy consumption of 122.64kWh/m2
(90.24%). The greatest savings after this were achieved for the annual reduction in carbon emissions and avoided emissions, which were 84.59% and 816.47kg/CO2, respectively.
Keywords: building performance; sustainability; near-zero; thermal analysis simulation; energy consumption
1. Introduction
Traditional properties are undergoing retrofitting to be able to compare to newer buildings’ energy performance. Per UK’s energy statistics, 2016, the domestic sector is responsible for 40-45 percent of energy consumption and contributes to approximately 45% of the UK’s CO2 emissions. Within this framework, in 2007, a policy stating that “…in the household sector we will continue to raise energy performance standards for new homes… through Part L of the Building Regulations with the aim of delivering zero-carbon homes by 2016” was introduced (although has
not been fully implemented in 2016) (DEFRA 2007).
Whilst many new buildings comply with the high standards of Part L of the building regulations, thereby making the process of retrofitting them into Nearly Zero Energy Buildings (NZEBs) less challenging (i.e., fewer alterations needed); older buildings have little/no measures in place to save energy (Gagliano et al. 2017). Therefore, even if the new policy is fully implemented, within urban areas particularly where most space is occupied with existing older buildings, it will mean reaching this target is still a difficult task. More than 50% of residential buildings were built before 1971 (Itard and Meijer 2008). Thus, it is essential that those older buildings are also retrofitted to help achieve the target.
According to Zero Carbon Hub (ZCH), “the main sources of energy consumption in homes are heating/cooling, lighting, hot water (regulated energy) and appliances (unregulated energy).” Retrofitting of existing buildings with a focus on those sources therefore has the potential to bring substantial savings in energy consumption. Compared to ‘demolishing and rebuilding,’ retrofitting, is considered an excellent alternative as it is significantly more environmentally efficient and can easily achieve the same results. In addition, demolishing of buildings contributes to approximately 30 percent of total landfill waste, making it the biggest source of landfill by volume. Retrofitting an older building uses four to eight times less resources in comparison to new buildings (Gagliano et al. 2017).
This paper will therefore use dynamic thermal simulation to propose how an existing UK residential building can be retrofitted to achieve the NZEB standard. Thereby establishing a method platform to discern an adequate design solution for common UK households, whilst taking into consideration the influence of current and future climate conditions on performance of said buildings. For this work an adequate solution will be one that matches the ZCH definition for NZEBs. The dwelling will be retrofitted with a focus on incorporating on-site renewables and improving the building fabric. The analysis software for this work will be Thermal Analysis Simulation (TAS) software (EDSL TAS 2017). It should also be noted that the scope of this paper is limited to the retrofitting of the case study dwelling and examining its performance under various climates, therefore, costs will not be considered in the selection of design variables and solution.
2. Literature review
EPBD aimed to improve overall energy efficiency of buildings, which in turn would reduce CO2 emission and energy consumption contribution of the building sector (DBL 2016). Indeed, many countries including the UK adopted the directive which introduced the ‘Home Information Packs’ (HIPs). Despite this a recast directive was introduced on 19th
May 2010 after it had emerged that the building sector still contributed to 40 percent of total energy consumption within Europe (Brian 2011, EU Parliament 2010). It was specified that member states need to reduce total energy consumption from the building sector and increase usage of renewable energy sources. It was this recast directive which introduced NZEBs.
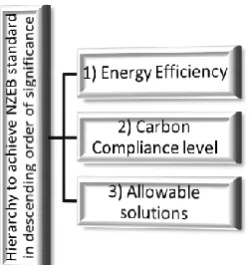
Fig. 1 Reproduced figure of government’s preferred hierarchy to achieve N/ZEB standards (ZCH 2009)
As can be seen from Fig. 1, ZCH has set out a hierarchy to achieve the standard. Within this, energy efficiency is the prime issue which needs to be addressed. This focuses particularly on the energy efficiency of the building fabric. ‘Fabric Energy Efficiency Standard’ (FEES) compliant homes mean that a comfortable internal temperature is maintained. The FEESs’ specify the “minimum level for overall fabric performance” required to achieve a NZEB. It is essentially the maximum calculated energy required for a house to maintain internal comfort conditions. It does not consider systems’ efficiencies, building services, fixed lighting, ventilation strategy or the nature of the fuel used; but rather the fabric U-values, thermal bridging, thermal mass, and features affecting lighting and solar gains (ZCH 2009). A limit of 46 kWh/m2/year for detached dwellings is set for UK NZEBs.
The subsequent factor to take into consideration is the ‘Carbon Compliance.’ The current average carbon emissions per household in the UK is 26 kg CO2/m2/year (CCC 2016). Once the fabric performance has been taken into consideration, any residual CO2, “must be less than or equal to the carbon compliance limit” set by ZCH. For a detached house, this compliance level is set as 10 kg CO2(eq)/m
2
/year. Whilst this may seem challenging, ZCH reiterated it is deliverable (ZCH 2013).
Finally, by means of ‘allowable solutions’, any CO2 emissions remaining after achieving carbon compliance (which “cannot be cost-effectively off set on-site”), are offset via “nearby or remote measures.” The allowable solutions to be incorporated in this paper will only include ‘on-site’ options such as electricity storage for PV panels to investigate its effect via simulation. Moreover, ‘near-site’ and ‘off-site options’ were introduced for multi-storey residential buildings.
Looking at other available definitions it can see that the EPBD provides a generic definition for NZEBs. However, a widely accepted definition does not exist (Κοlokotsa 2010). Moreover, acknowledging the various climatic conditions of member states, the EPBD does not provide specific requirements such as set energy consumption values. These shortcomings, together with the absence of a standardised calculation methodology for energy performance, lead to a disparity in the approach undertaken to achieve NZEBs. Furthermore, in certain cases this has led to “national targets based on the concept without a clear definition” (Voss et al. 2011).
EPBD intended that NZEBs are to be connected to an energy grid or a smart grid and import/export electricity rather than being energy autonomous. Another example would be considering only thermal or electrical needs to achieve the balance. In other cases, energy inefficient buildings were classified as NZEBs due to their use of “oversized photovoltaic (PV) systems but without applying relevant energy saving measures” (Voss et al. 2011, 2012). Consequently, these definitions cannot form an adequate standard that can be used for regulations and policies.
One the most widely-used definition of NZEBs was developed by the ‘National Renewable Energy Laboratory’ (NREL). This definition places emphasis on the use of on-site renewables and makes it a requirement that the building needs to generate an equal amount of energy as it uses on an annual basis. It also considers costs and carbon emissions. This is very similar to the definition developed by the International Energy Agency (IEA), although the IEA considers NZEBs as dwellings which do not rely on any fossil fuels (Voss and Riley 2009). The United States Department of Energy (DOE) has also released a definition which applies to both residential and commercial buildings. The main consideration in this definition is that the nearly-zero balance should be met via renewables, similarly to the EU definition (DOE 2008). The California Energy Commission (CEC) has described a NZEB as a building which would meet its energy efficiency target via renewables and would be grid connected (CEC 2009).
The main reasons for selecting the UK’s definition for this work are as follows:
• The UK’s definition only applies to domestic buildings; whereas other definitions cover both residential and commercial buildings. This paper is using a residential building; therefore, the UK’s definition will be more focused, detailed, and relevant to the scope of this paper.
• Although ZCH has ceased operation since mid-2016, which was a direct result of the government no longer pursuing the 2016 NZEB target, the work and definition produced over their 8 working years is still endorsed by the industry and the government. Furthermore, no other organisation has been set up to carry on with this work and many elements of the definition have been directly incorporated into current building regulations. For instance, many of the energy efficiency targets have been incorporated into Part L of the building regulations (ZCH 2016).
Overall, the variations in currently available definitions are minute. Most importantly they all cover the same areas of focus as they consider the use of renewable energy, the zero-carbon balance, grid connections, and the costs. For this reason, choosing one of these definitions over the other will not lead to significant variation in analysis and discussion.
3. Methodology
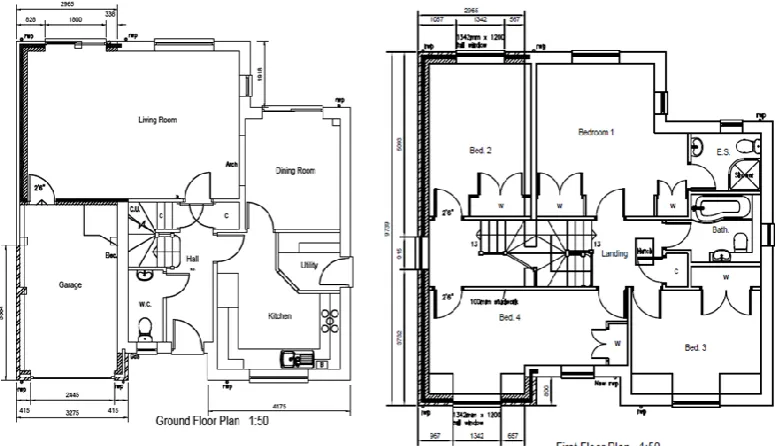
The building to be studied is a four-bedroom detached dwelling located in Bracknell, Berkshire, England. According to the English Housing Survey (2016), 35 percent of the British population live in detached houses. Meaning that this type of dwelling is the second most common type of residential dwelling (with semi-detached being the most common) across the UK, thereby making it an excellent representative as a case study. Furthermore, this dwelling was built pre-1990, meaning that the standards to which the house was built were below today’s targets, making it more challenging to retrofit.
Fig. 2 Floor plans of the case study building with a scale of 1:50
North angle was set to 135 degrees clockwise to the North to match the actual orientation of the dwelling. Furthermore, the latitude was changed to 51.42 degrees North, the longitude to -0.75 degrees East, and the Coordinated Universal Time (UTC) to +0.00. Initially, the model created on TAS was a replica of the existing state of the dwelling. Thus, the initial generated energy model was the reference point for improvements. Refer to Amaoko-Attah and B-Jahromi (2014) for detailed description of the modelling process on TAS.
In essence, it would be viable to implement a Heuristic search method. This systematic approach guarantees the provision of a good solution in a relatively short time (Pean et al. 2017). However, for this work a stochastic approach is followed. This is compatible with the spectrum of this paper and has the advantage of allowing the computation of results for the many design variables which could be adopted.
As this work aims to study the effectiveness of proposed design variables to reach NZEB standards, even under potentially different climatic conditions, weather data is a vital consideration of the methodology. The type of weather file selected for carrying out the analysis is the Test Reference Year (TRY). This was selected because the Design Summer Year (DSY) weather file is suitable for overheating analysis, meanwhile the Test Reference Year (TRY) is suitable for “energy analysis and for compliance with the UK Building Regulations (Part L)” (Eames et al. 2016, EDSL TAS 2017).
dwelling continues to perform under this worst-case scenario, regardless of which climatic condition is accurate in the future, the building’s energy performance will not be undermined.
3.1 Modelling assumptions
1. It was assumed that the dwelling is occupied from 6pm-8am during weekdays and for a full 24 hours during the weekend. Furthermore, the boiler is in operation between 5am and 9pm daily. This was selected based on average occupancy patterns in domestic buildings in the UK (UOS 2016).
2. The automatic simulation of natural ventilation (because of windows, doors, ventilators, and other apertures-relative to their altitude and orientation) will be assumed to be the realistic representation of the actual airflow (EDSL TAS 2017).
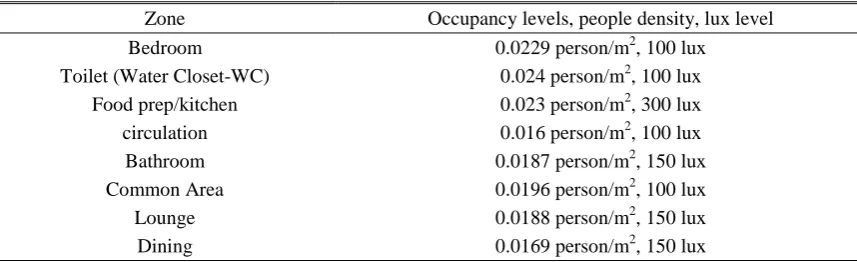
3. The National Calculation Method (NCM) database will be used to represent all zones, including circulation, kitchen, and toilets (EDSL TAS 2017). It will be assumed that these internal conditions are the actual current conditions of the dwelling (Table 1).
4. Fully adopting the CIBSE TRY weather files without any alterations and assuming that they are valid and relevant to the micro-climate of Bracknell.
5. Fuel Source CO2 Factor-Natural gas=0.216 Kg/kWh and Grid Supplied Electricity=0.519 Kg/kWh (EDSL TAS 2017).
Summary of selected climatic weather files: London TRY-Test reference year for London adapted to UKCP09 ‘High’ scenarios for 2020s, 2050s, and 2080s weather file
(a) Front elevation (b) Rear elevation
Fig. 3 TAS 3D Modelling results
Table 1 NCM internal conditions database
Zone Occupancy levels, people density, lux level
Bedroom 0.0229 person/m2, 100 lux
Toilet (Water Closet-WC) 0.024 person/m2, 100 lux
Food prep/kitchen 0.023 person/m2, 300 lux
circulation 0.016 person/m2, 100 lux
Bathroom 0.0187 person/m2, 150 lux
Common Area 0.0196 person/m2, 100 lux
Lounge 0.0188 person/m2, 150 lux
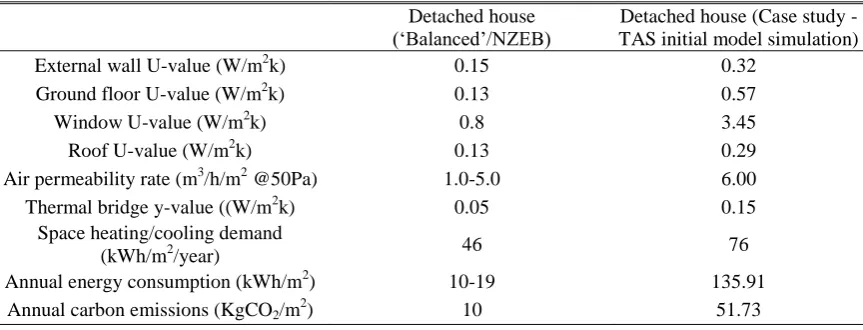
Table 2 Building fabric results of baseline model
Detached house (‘Balanced’/NZEB)
Detached house (Case study - TAS initial model simulation)
External wall U-value (W/m2k) 0.15 0.32
Ground floor U-value (W/m2k) 0.13 0.57
Window U-value (W/m2k) 0.8 3.45
Roof U-value (W/m2k) 0.13 0.29
Air permeability rate (m3/h/m2 @50Pa) 1.0-5.0 6.00
Thermal bridge y-value ((W/m2k) 0.05 0.15
Space heating/cooling demand
(kWh/m2/year) 46 76
Annual energy consumption (kWh/m2) 10-19 135.91
Annual carbon emissions (KgCO2/m2) 10 51.73
4. Results and discussions
4.1 Results of baseline model
Looking Table 2, it can be seen that there is an almost 40% difference between the case study’s space heating/cooling demand and the NZEB target. As mentioned previously, the space heating and cooling demand (FEES) refers to the maximum amount of energy that is required to maintain a comfortable internal temperature and is influenced by the building fabric U-value, thermal bridging, air permeability, thermal mass, external heat gain (solar), and internal heat gains (ZCH 2009). The value obtained as a result of simulation suggests that current occupants require a large amount of energy to achieve and maintain a comfortable internal temperature.
Another important aspect of the results that needs to be taken into consideration is the annual energy consumption of the dwelling. Unlike the space heating and cooling demand, the annual energy consumption is affected by carbon emission factors for the different fuel types and provides a value for the actual energy used per year to keep the building at 19oC and above (CIBSE 2000). Houses with very poor insulation can reach values of 400kWh/m2/year. The reason for this high value is because generally 1 litre of fuel oil is required to heat a square metre of a building per year (Seiders et al. 2007). However with adequate insulation this value can be considerably lowered. The total energy consumption considers heating, cooling, auxiliary, lighting, Domestic Hot Water (DHW), equipment, and displaced electricity (where applicable). In addition, the simulation results for the carbon emissions also takes into consideration building systems, air/ plan side HVAC control(s), building envelope elements (insulation, glazing etc.), lighting/daylighting interaction(s), energy consumption, occupancy schedule, fuel type, ventilation, DHW etc. (EDSL TAS 2017).
4.2 Results of various design variables
4.2.1 Thermal Insulation
(EPS). Looking at the initial results generated by the building it can be concluded that the insulation of all those building elements is insufficient.
Table 3 shows that an implemented increase of the thickness of the thermal insulating layer can contribute to a reduction in U-values. Furthermore, EPS did not only have the lowest U-values in comparison to wool insulation, it also contributed to significantly lower annual energy consumption, and lower CO2 emissions. Previous studies have demonstrated that whilst increasing the thickness of the thermal material is favourable, it is essential that an ‘optimal thickness’ is selected (Ma and Wang 2012). This is because, further increase beyond the optimal thickness will not have any additional benefit for reducing U-Value and energy consumption. Therefore, one further simulation using EPS was conducted with varying thickness as shown in row 7 and 8. Once the simulation with 130 mm thickness was conducted, it was apparent that this was the optimal thickness for this building and will therefore be the adopted value in the final analysis of the building.
Table 3 U-value results of various thickness of EPS, mineral wool batt, and rock wool
Material External Wall U- Value (W/m2k)
Roof U- Value (W/m2k)
Ground Floor U- Value (W/m2k)
1 EPS, 85 mm 0.32 0.29 0.18
2 EPS, 150 mm 0.15 0.14 0.12
3 Mineral wool batt, 85 mm 0.38 0.31 0.22
4 Mineral wool batt, 150 mm 0.25 0.22 0.16
5 Rock wool, 85 mm 0.38 0.34 0.24
6 Rock wool, 150 0.24 0.23 0.17
7 EPS, 100 mm 0.24 0.21 0.15
8 EPS, 130 mm 0.15 0.16 0.12
Table 4 Simulation results of various ventilation systems and its comparison to baseline model
Type of Ventilation Air Permeability rate
(m3/h/m2 @50Pa) Heating Cooling Total Heating Cooling Total Energy Consumption
(kWh/m2)
Carbon Emissions (kgCO2/m2)
Whole-house Ventilation 3 38.21 0.87 84.76 11.63 1.69 28.30
Mechnical Ventilation
(with VRF) 3 35.42 0.53 82.12 10.08 1.20 24.40
Baseline Model 6 60.35 0.00 135.91 20.72 0.00 51.73
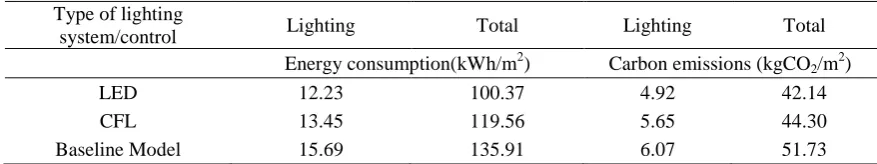
Table 5 Simulation results of various lighting systems and controls and its comparison to baseline model
Type of lighting
system/control Lighting Total Lighting Total
Energy consumption(kWh/m2) Carbon emissions (kgCO2/m2)
LED 12.23 100.37 4.92 42.14
CFL 13.45 119.56 5.65 44.30
4.2.2 Ventilation
Airtightness can be considered one of the most important aspects to ensure that the energy efficiency of the building can reach its full potential. Even if a high level of thermal insulation is reached and a passive solar heating system is incorporated, their benefits will be lost if the “warm air can leak out and cold air can leak in” (Brian 2011). A ‘reasonable’ limit has been set by the building regulations (Part L) as 10 m3/h.m2 at 50 Pa. An energy efficient building should be between the range of 1 to 3 m3/h.m2 at 50 Pa. Mechanical ventilation (MV) in this case is a requirement that needs to be provided to avoid poor air quality as the airtightness value is very low (Ayoubet al. 2017). Currently, ventilation in the dwelling is natural passive ventilation as this is achieved by simply opening windows and doors. The measured air permeability level as shown in Table 4 was 6 m3/h.m2 at 50 Pa with an infiltration level of 0.250 air changes per hour (ACH). Whilst this does not exceed the limit set by the building regulations (Part L), it is still underperforming compared to the target for NZEBs. Although this method of ventilation requires no direct energy to operate, it still accounts for one third of the space heating energy demand, due to the large volume of warm air exiting the property (Ayoub et al. 2017). Consequently, with ‘heating’ being the largest contributor to annual energy consumption, incorporating mechanical ventilation will provide fresh (pre-warmed air), which will in turn reduce space heating demand.
Although ventilation systems added cooling loads to the energy consumption and carbon emissions, the overall values are still much lower in comparison. The simulation runs with various ventilation systems shown in Table 4 indicate that incorporating a ventilation system in the dwelling will have a significantly positive contribution to reducing energy consumption and carbon emissions. The largest difference for energy consumption and carbon emissions is 39.58% and 52.83%, respectively. If Mechanical Ventilation with Variable Refrigerant Flow (VRF) is to be adopted with the other measures, it would have the largest contribution to improving energy efficiency of the building and reduce emissions. It is also worth noting that this system has limited space requirements which make it ideal for incorporating into older buildings undergoing retrofitting.
4.2.3 Lighting
The building currently uses incandescent lighting as its main source of lighting. The simulated results shown in Table 5 demonstrate that incorporating either LEDs or CFLs will further contribute to a reduction in energy consumption and carbon emissions. Initially LEDs are more expensive than CFLs, however in the long-term they are more cost-effective and have a longer life-span (Figueiredo and Martin 2010). Therefore, the existing incandescent lights will be replaced with LEDs; which are more efficient and consume less power for similar illumination intensity.
4.2.4 Glazing
The windows and entrance doors are wooden framed constructed from an uncoated double glazed (air filled) frame with an overall heat transfer coefficient of 2.55 W/m2K. The results in Table 6 show that incorporating triple glazing provides a 42.17% decrease of U-value and 22.64% decrease in average U-value in comparison to the baseline model. Therefore, triple glazing will be selected to undergo simulation for the final analysis.
4.2.5 Renewable/microgeneration systems
carbon emissions and improving energy performance of the dwelling. The solar panels have been selected to be installed on the roof of the building. This is because, with current technology, this is one of the most efficient ways to generate electricity using solar energy. A 20% efficient 4kW module with solar battery storage is to be used; each panel will be made of a ‘Monocrystalline silicon solar cell.’ Amongst commercially available solar panels, Monocrystalline ones, have the highest energy efficiency and longest life expectancy of 25-30 years (Visa 2014). Therefore, although they may seem more expensive initially, in the long term they will offer the most value in terms of energy and cost efficiency.
Table 6 Simulation results of various types of glazing and its comparison to baseline model
Type of glazing
Air permeability rate (m3/h/m2
@50Pa)
Windows Average Heating Total Heating Total
U-value (W/m2k) Energy consumption(kWh/m2)
Carbon emissions (kgCO2/m2) Double glazing, air
filled, low-e 4.5 2.20 0.60 53.97 90.23 16.12 42.37
Triple glazing, argon
filled, low-e 3.0 0.83 0.53 42.65 87.34 15.20 30.53
Baseline model (4-6-4 uncoated glass, air
filled)
6.0 3.45 0.84 60.35 135.91 20.72 51.73
Table 7 Simulation results of various renewable and microgeneration systems and its comparison to baseline model
Type of renewable/
microgeneration system EPC rating
Building emission rate (kgCO2/m2)
Energy performance asset rating (SAP points)
Displaced electricity (kWh/m2)
Solar panel B 17.16 36 55.34
Micro-wind turbine B 24.54 47 49.41
Micro-CHP B 29.13 50 53.19
Baseline model D 51.73 76 0.00
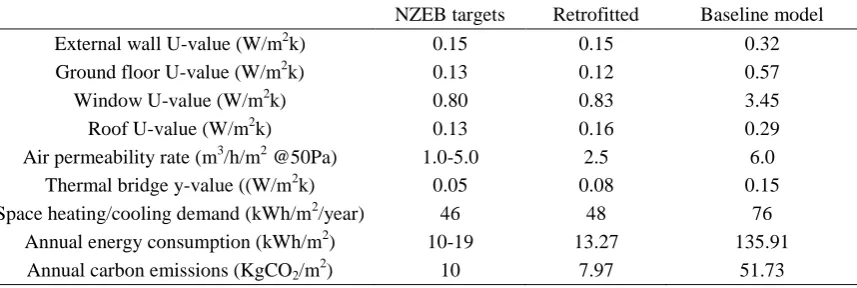
Table 8 Various building fabric, annual carbon emissions, and annual energy consumption results of the retrofitted building and its comparison to baseline model and NZEB targets
NZEB targets Retrofitted Baseline model
External wall U-value (W/m2k) 0.15 0.15 0.32
Ground floor U-value (W/m2k) 0.13 0.12 0.57
Window U-value (W/m2k) 0.80 0.83 3.45
Roof U-value (W/m2k) 0.13 0.16 0.29
Air permeability rate (m3/h/m2 @50Pa) 1.0-5.0 2.5 6.0
Thermal bridge y-value ((W/m2k) 0.05 0.08 0.15
Space heating/cooling demand (kWh/m2/year) 46 48 76
Annual energy consumption (kWh/m2) 10-19 13.27 135.91
Annual carbon emissions (KgCO2/m 2
4.3 Results of final selected design variables
The selected design variables were finally implemented in the building altogether. This resulted in a reduction of the building’s annual energy consumption of 122.64 kWh/m2
(90.24%). The greatest savings after this were achieved for the annual reduction in carbon emissions and avoided emissions, which were 84.59% and 816.47 kg/CO2, respectively. Following the stochastic methodology offered valuable insight into the performance of the dwelling pre- and post-retrofit for individual measures and overall. For instance, the installation of insulation alone reduced the annual space heat demand by 21.85%, however when this was incorporated with the other measures, the overall reduction of space heat demand increased to 40.79%.
Following the definition set out in the literature review, the building is connected to an electricity grid to fulfil the basic requirement of a NZEB. Initially, the dwelling had no renewable or microgeneration system in place, therefore, no displacement of electricity occurred. However, the incorporation of the PV panels, concurrently, introduced the factor of ‘Displaced Electricity.’ According to the Building Regulations, electricity displaced from the grid is a value that is used when crediting on-site generation systems. This is not limited to renewables and can include CHP/trigeneration systems. It is this displacement that highlights the substantial contributions offered by such measures. When the 4 kW panel was incorporated with all the other measures the building’s energy performance was greater than the required standard due to the large amount of displaced electricity. Therefore in the final analysis a 2 kW panel was simulated instead. The initial total of annual carbon emissions and energy consumption did not reach the level set by the definition, however, once the 9.29 kWh/m2 displaced electricity were taken into account, the dwelling was able to reach, and even exceed, the compliance levels as shown by the total values in Table 8.
4.4 Costs
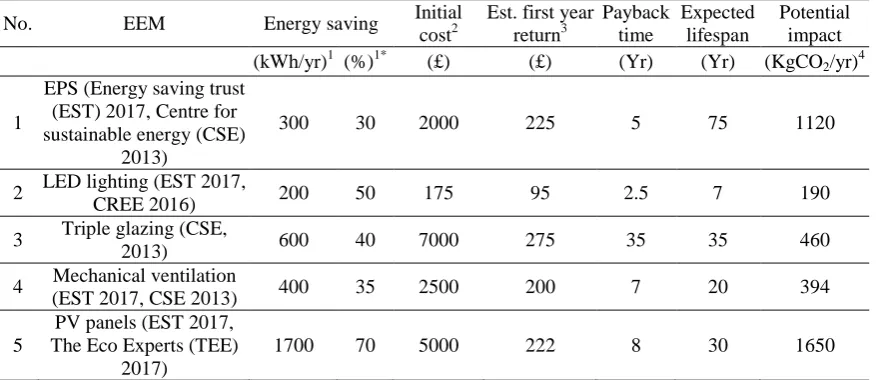
To obtain insight on the economic value of selected measures, an estimated payback period and a simple analysis of the potential impact, in terms of carbon reductions, was conducted to aid in the examination of impact versus economic value. The general observed trend from the results was that the most expensive design measures were at least 3.5-4 times more expensive than the cheapest ones (excluding lighting). It is also those measures that had the longest payback periods as shown by Table 9. In real life applications, it will be the homeowner paying for those measures, therefore, it is essential that an economic analysis is conducted at the early design stage rather than post-selection of measures. The incorporation of triple glazing is an example as to why this is necessary. The extremely long payback period and little annual energy savings, in comparison to PV panels for instance as their costs are similar, show that it would have been more appropriate to install double glazing which would have been approximately 40% cheaper and with annual cost and energy saving of £105-£110 and 100 kWh respectively. The analysis conducted in this section is simply a brief one to illustrate the importance of the inclusion of an economic analysis to reach the energy goals with cost-efficiency.
Table 9 Estimated energy savings and payback period of selected design variables
No. EEM Energy saving Initial
cost2
Est. first year return3
Payback time
Expected lifespan
Potential impact (kWh/yr)1 (%)1* (£) (£) (Yr) (Yr) (KgCO2/yr)4
1
EPS (Energy saving trust (EST) 2017, Centre for sustainable energy (CSE)
2013)
300 30 2000 225 5 75 1120
2 LED lighting (EST 2017,
CREE 2016) 200 50 175 95 2.5 7 190
3 Triple glazing (CSE,
2013) 600 40 7000 275 35 35 460
4 Mechanical ventilation
(EST 2017, CSE 2013) 400 35 2500 200 7 20 394
5
PV panels (EST 2017, The Eco Experts (TEE)
2017)
1700 70 5000 222 8 30 1650
1/1*Based on energy saving by initial measures or average estimates (e.g., LED lighting reduce up to 50 percent of lighting energy consumption in comparison to incandescent lighting).
2Cost of the various systems excluding installation costs.
3In terms of energy saved and therefore cost reductions for all measures except for PV panels where it is actual cashflow due to feed-in tariff system.
4Based on how much CO
2 is typically saved by incorporating the measure
periods mean certain measures are not cost-effective, the measures do provide thermal comfort for its occupants and allow existing buildings to meet the project’s energy goals (Attia 2010).
Undoubtedly, the current paradigm which favours sustainability means that currently and even more so in the future, such measures will become more economically viable. This is a consequence of the ‘Demand Relationship’. As the number of consumer demand increases, the number of units produced of a certain product will also increase. This leads to bulk productions which is invariably cheaper, thereby resulting in cheaper products and shorter payback periods; which in turn increases cost effectiveness. Additionally, as such project rely heavily on the incorporation of renewables, an increase in the number of properties being retrofitted to achieve this standard will lead to a steadying of energy prices. This is because the cost of renewables is reliant on the invested money and not the increasing or decreasing cost of the natural resource (Pean et al. 2017).
4.5 Climatic scenario results
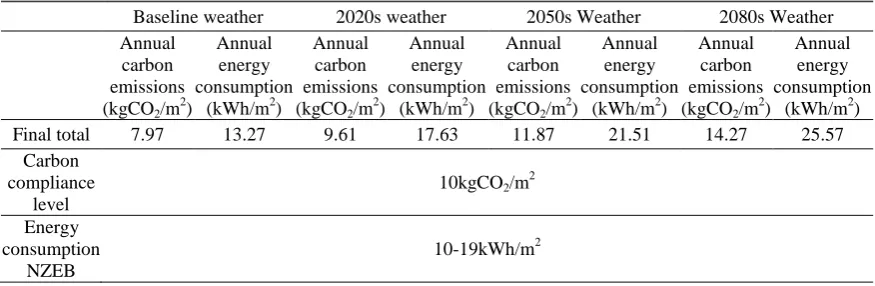
Table 10 Comparison of retrofitted building for baseline and future climatic scenarios
Baseline weather 2020s weather 2050s Weather 2080s Weather Annual
carbon emissions (kgCO2/m
2 )
Annual energy consumption
(kWh/m2)
Annual carbon emissions (kgCO2/m
2 )
Annual energy consumption
(kWh/m2)
Annual carbon emissions (kgCO2/m
2 )
Annual energy consumption
(kWh/m2)
Annual carbon emissions (kgCO2/m
2 )
Annual energy consumption
(kWh/m2)
Final total 7.97 13.27 9.61 17.63 11.87 21.51 14.27 25.57
Carbon compliance
level
10kgCO2/m 2
Energy consumption
NZEB
10-19kWh/m2
demand increased by a substantial 85% from the baseline (current) weather file to the 2080s weather projection. The above results are in consonance with the projected temperature changes. The projections showed a constant increase in temperature over stipulated timelines. Once the building was simulated under the 2050s and 2080s weather files the annual energy consumption and annual carbon emissions immediately exceeded that of the target set by the definition for a NZEB as shown in Table 10.
Nonetheless, it is essential to note that the current results have been generated on the assumption that the flow of generated electricity (from the electricity grid) through to the regional distribution networks will remain constant throughout these years. This is highly unlikely. Meaning that the displaced electricity values may vary, which in turn will lead to potentially different results. Further to the discussion, the simulated model under future climatic conditions suggest that the building may require the incorporation of an energy efficient cooling system. The inclusion of a cooling system will balance any overheating because of raised temperatures.
Moreover, this study did not consider selection of smart appliances. Research confirms that the incorporation of smart appliances “can save up to 60 percent of energy consumed in a household” (Edward 2013). Thus, it may be construed that if such measures were to be implemented, the annual energy consumption and carbon emissions would be reduced even further. This, in turn, will mean that the building’s performance will positively transcend the obtained results for future timeline scenarios.
5. Conclusions
The work evaluated the outcomes of energy efficient design solutions to retrofit an existing pre-1990 building in Bracknell into a NZEB. Subsequent to selecting the design solution, and ensuring that the building meets the NZEB definition set in the literature review, further simulations were processed under future timeline scenarios to assess the building’s future performance.
type of measures needed will depend on the original/ baseline energy performance of the building being retrofitted. This is because certain buildings will inevitably be more challenging to retrofit due to their very poor initial energy performance and building material in comparison to others. Meaning that they will need more measures to reach the energy performance standard required.
As expected there was a progressive increase in the energy consumption and carbon emissions of the dwelling as the final model was simulated under the various timeline scenarios. Currently, the majority of energy consumption is a result of heating demand, which is expected due to the UK’s cold dominant climate. As future projections estimate an increase in temperatures it is plausible that there will be a shift from high heating demand to high cooling demand. However, the simulation results in this study showed that the heating demand remains high and only decreases by less than 24%; meanwhile, the cooling demand increases by more than 80% between the baseline model and 2080s timeline. However, it should be noted that as the worst-case projections were used, the weather scenarios may not present an accurate reflection of the true weather conditions in coming years. The three future timeline scenarios examined also demonstrate that in coming years it may be inevitable that many buildings will need a cooling system. Despite the fact that the case-study model had mechanical ventilation the cooling demand increased significantly and eventually the building was performing below the definition’s standard. A possible solution which would achieve maximum occupant comfort would be incorporating an automated shading system.
In this paper costs were not considered in the selection of design solutions because the spectrum of this paper is to simply retrofit the case-study into a NZEB and examine its performance under various climates. The brief cost analysis was simply conducted to illustrate the importance of an economic analysis at early design stages. However, this must be done whilst ensuring that the energy targets of the building/project are also met. An optimal design solution would balance the energy targets and required cost targets set by the investor.
Overall, it can be said that to successfully retrofit an existing dwelling it is necessary that the designer does not only consider the inclusion of renewables and neglect building fabric improvements and vice versa. The results of this paper should increase encouragement for retrofitting existing buildings into NZEBs, particularly, due to their positive environmental contributions. Costs of measures included in this paper and the many other available measures are expected to decrease significantly in the near future while their efficiency is expected to increase. These factors will make achieving a NZEB less challenging and more economical in the near future.
References
Amoako-Attah, J. and B-Jahromi, A. (2014), “Impact of standard construction specification on thermal comfort in UK dwellings”, Adv. Environ. Res., 3(3), 253-281.
Attia, S. (2010), “Zero energy retrofit case study of a chalet in Ain-Sukhna, Egypt”, Proceedings of the American Solar Energy Society 2010 National Conference, Arizona, U.S.A., May.
Ayoub, J., Aelenei, L., Aelenei, D. and Scognamiglio, A. (2017), Solution Sets for Net Zero Energy Buildings, Wilhelm Ernst & Sohn, Berlin, Germany, 46-86.
Brian, A. (2011), Energy Performance of Building Directives,
<http://www.bre.co.uk/filelibrary/Energy_Performance_of_Buildings_Directive_(EPBD).pdf>.
CIBSE (2000), GPG 303: The Designer’s Guide to Energy-Efficient Buildings for Industry, <http://www.cibse.org/getmedia/a6e0b3e4-d3b3-4f4e-8341-cc9fd1c2af35/GPG303-The-Designers-Guide-to-Energy-efficient-Buildings-for-Industry.pdf.aspx>.
CIBSE, CIBSE Weather Data Sets, <http://www.cibse.org/knowledge/cibse-weather-data-sets>.
Committee on Climate Change (CCC) (2016), The Fifth Carbon Budget, <https://www.theccc.org.uk/wp-content/uploads/2016/07/5CB-Infographic-FINAL-.pdf>.
DCLG (2007), Building a Greener Future: Policy Statement, Department for Communities and Local Government (DCLG), London, U.K.
DCLG (2008), Definition of Zero Carbon Homes and Non-Domestic Buildings: Consultation, <http://www.communities.gov.ukS>.
DCLG (2008a), Code for Sustainable Homes: Technical Guide, Department for Communities and Local Government (DCLG), London, U.K.
DCLG (2008b), Definition of Zero Carbon Homes and Non-Domestic Buildings: Consultation, Department for Communities and Local Government (DCLG), London, U.K.
DCLG (2009), Costs and Benefits of Alternative Definitions of Zero Carbon Homes: Project Report, Department for Communities and Local Government (DCLG), London, U.K.
DCLG (2010), Building Regulations 2010: Approved Document L (Conservation of Fuel and Power), London, U.K.
DCLG (2017), English Housing Survey, <https://www.gov.uk/government uploads/attachment_data/ file/658478/201516_EHS_Headline_Report.pdf>.
DEFRA (2007), Carbon Plan, <https://www.gov.uk/government/uploads/system/uploads/attachment_ data/file/47621/1358-the-carbon-plan.pdf>.
Department for Communities and Local Government (2006), Building a Greener Future: Towards Zero Carbon Development, <http://webarchive.nationalarchives.gov.uk/20120919132719/http://www. communities.gov.uk/documents/planningandbuilding/pdf/153125.pdf >.
Designing Buildings Ltd. (2016), Nearly Zero Energy Buildings,
<https://www.designingbuildings.co.uk/wiki/Nearly_zero_energy_buildings>.
Eames, M.E., Ramallo-Gonzalez, A.P. and Wood, M.J. (2016), “An update of the UK’s test reference year: The implications of a revised climate on building design”, Build. Serv. Eng. Res. Technol., 37(3), 316-333.
EDSL TAS (2017), <http://www.edsl.net/>.
EU Directive (2003), “Directive 2002/91/EC of the European parliament and of the council of 16 December 2002 on the energy performance of buildings”, Official J. Eur. Union,65-71.
EU Directive (2010), “Directive 2010/31/EU of the European parliament and of the council of 19 May 2010 on the energy performance of buildings (recast)”, Official J. Eur. Union,18(06).
Figueiredo, J. and Martins, J. (2010), “Energy production system management-renewable energy power supply integration with building automation system”, Energy Convers. Manage., 51(6), 1120-1126. Gagliano, A., Doria, A., Giuffrida, S., Nocera, F. and Detommaso, M. (2017), “Energy efficient measure to
upgrade a multi-storey residential in a NZEB”, AIMS Energy, 5(4), 601-624.
Hacker, J., Capon, R. and Mylona, A. (2009), Use of Climate Change Scenarios for Building Simulation: The CIBSE Future Weather Years, CIBSE TM48, Chartered Institution of Building Services Engineers, London, U.K.
Itard, L. and Meijer, F. (2008), Towards a Sustainable Northern European Housing Stock: Figures, Facts and Future, IOS Press, Delft, The Netherlands, 28-37
Ma, P. and Wang L.S. (2012), “Effective heat capacity of interior planar thermal mass (iPTM) subject to periodic heating and cooling”, Energy Build., 47, 44-52.
Marszal, A.J. and Heiselberg, P. (2009), A Literature Review of Zero Energy Buildings (ZEB) Definitions, DCE Technical Report No.78, Aalborg University, Copenhagen, Denmark.
Pean, T.Q., Ortiz, J. and Salom, J. (2017), “Impact of demand-side management on thermal comfort and energy costs in a residential nZEB”, Energy Build., 7(2), 37.
Jackson, J. (2007), Study of Life Expectancy of Home Components, <http://www.nahb.orgS>.
U.S Department of Energy (DOE) (2008), Building Technologies Program: Planned Program Activities for 2008-2012, Department of Energy, Washington, D.C., U.S.A.
UKCP09 (2010), UK Climate Projections 09, <http://ukclimateprojections.defra.gov.uk>.
Visa, I. (2014), Sustainable Energy in the Built Environment-Steps Towards NZEB, Springer International Publishing, Switzerland, 32-118.
Voss, K. and Riley, M. (2009), IEA Joint Project: Towards Net Zero Energy Solar Buildings (NZEBs), Task/Annex Text, SHC Task 40 and ECBCS Annex 52 Joint Project, International Energy Agency Solar Heating and Cooling Programme, CanmetENERGY, Natural Resources Canada, Quebec, Canada. Voss, K., Musall, E. and Lichtmeß, M. (2011), “From low-energy to net zero-energy buildings: Status and
perspectives”, J. Green Build., 6(1), 46-57.
Voss, K., Sartori, I. and Lollini, R. (2012), “Nearly-zero, net zero and plus energy buildings-how definitions and regulations affect the solutions”, REHVA J., 49, 23-27.